 Open Access Article
Mechanical properties of the superficial biofilm layer determine the architecture of biofilms
Binu
Kundukad
a,
Thomas
Seviour
b,
Yang
Liang
bc,
Scott A.
Rice
bcd,
Staffan
Kjelleberg
bcd and
Patrick S.
Doyle
*ae
aBioSystems and Micromechanics (BioSym) IRG, Singapore MIT Alliance for Research and Technology (SMART), Singapore
bSingapore Centre on Environmental Life Sciences Engineering, Nanyang Technological University, Singapore
cSchool of Biological Sciences, Nanyang Technological University, Singapore
dCentre for Marine Bio-Innovation and School of Biotechnology and Biomolecular Science, University of New South Wales, Sydney, NSW, Australia
eDepartment of Chemical Engineering, Massachusetts Institute of Technology, Cambridge, Massachusetts 02139, USA. E-mail: pdoyle@mit.edu
First published on 24th May 2016
Abstract
Cells in biofilms sense and interact with their environment through the extracellular matrix. The physicochemical properties of the matrix, particularly at the biofilm–environment interface, determine how cells respond to changing conditions. In this study we describe the application of atomic force microscopy and confocal imaging to probe in situ the mechanical properties of these interfacial regions and to elucidate how key matrix components can contribute to the physical sensing by the cells. We describe how the Young's modulus of microcolonies differs according to the size and morphology of microcolonies, as well as the flow rate. The Young's modulus increased as a function of microcolony diameter, which was correlated with the production of the polysaccharide Psl at later stages of maturation for hemispherical or mushroom shaped microcolonies. The Young's modulus of the periphery of the biofilm colony was however independent of the hydrodynamic shear. The morphology of the microcolonies also influenced interfacial or peripheral stiffness. Microcolonies with a diffuse morphology had a lower Young's modulus than isolated, circular ones and this phenomenon was due to a deficiency of Psl. In this way, changes in the specific polysaccharide components imbue the biofilm with distinct physical properties that may modulate the way in which bacteria perceive or respond to their environment. Further, the physical properties of the polysaccharides are closely linked to the specific architectures formed by the developing biofilm.
1 Introduction
Biofilms are formed when microorganisms secrete a viscoelastic matrix of the extracellular polymeric substance (EPS) that adheres them to surfaces and to each other. The EPS is a cross-linked network of polymers made up of polysaccharides, nucleic acids, proteins and other macromolecules that facilitate biofilm formation and maintenance. The matrix also facilitates cell–cell interactions, including between species and the matrix biopolymers and is often cited for its contribution to the protection of the cells from environmental stresses,1 and for providing the three-dimensional architecture of the biofilm.2,3 The matrix typically accounts for 90% of the dry mass of biofilms compared to just 10% for the bacteria;4,5 its composition and structure define the physicochemical properties of biofilms6 as well as contribute to the key properties such as antibiotic resistance and processes including detachment.Imaging techniques such as Confocal Laser Scanning Microscopy (CLSM) have provided much structural information on biofilms, revealing the existence of distinct morphotypes such as mushroom-shaped microcolonies,7 the spatial distribution of EPS, and the extent of cell viability.8 However CLSM requires that biofilm constituents be stained, which may alter the mechanical properties of matrix components depending on the mode of binding.9 While there have been advances in imaging techniques, including two-photon laser based confocal imaging10 and optical coherent tomography,11 such techniques alone provide little information on biofilm growth mechanisms or how cells interact between themselves and with their environment. To obtain such information requires the means to couple advanced imaging with quantitative and spatial elucidation of, and to effectively probe, the bio- and physicochemical properties of the matrix from which the biofilm is comprised.6
Many biophysical tools have thus recently been applied to biofilms to describe the properties of physiological significance. For example, the rheological properties of the biofilm have been shown to influence a range of key biofilm functions including microcolony migration, antibiotic resistance and the effect of changes in environmental factors such as temperature, osmotic stress and pH.12–15 Tensile testing using a microcantilever has shown that the mechanical properties of biofilms are dependent on the strain rate.16 Microfluidic methods have also been used to probe the mechanical properties of biofilms.17 Tracking the movement of individual bacterial cells during the initial stages of growth has also been undertaken to elucidate the microrheology of the immediate environment of bacterial cells within biofilms.18 Particle tracking was also applied to describe the depth dependence of charge density and viscoelasticity in biofilms of E. coli19 and to map the local viscoelastic properties within biofilms according to the mobility of immobilized beads.20 While these are examples of passive microrheological methods, active techniques such as magnetic tweezers, atomic force microscopy (AFM) and other micromanipulation tools21–23 have also been applied to study biofilms. Magnetic tweezing, for example, also revealed that elastic compliance depends on the biofilm thickness and the flow rate.21
AFM is being increasingly applied to understand microbial systems, allowing for very high-resolution mechanical manipulation across a range of growth states and length scales, from single cells to biofilms.24,25 It is a non-destructive technique that obviates the use of stains and has thus been used to describe a range of key physiological biofilm traits, including their adhesive and cohesive properties23,26,27 and viscoelastic properties at nano Newton resolution.22 However, AFM requires physical contact between the probe and the biofilm, which poses a challenge for biofilms grown in flow cells given that they are typically closed systems. Earlier AFM studies therefore focused on microcolonies grown on agar plates,28 under static conditions. Microbead force spectroscopy has been used to measure the elastic modulus and adhesive forces of biofilms grown under flow conditions. In that study, P. aeruginosa PAO1 biofilms were grown directly on the microbeads, which acted as the probe for the indentation study. The thickness of the early and mature biofilms used in those experiments was 0.5 μm and 3 μm, respectively, and mature biofilms were found to be softer than the early stage biofilms.29 In another study, AFM was used to probe the biofilm grown in an open flow cell. However the narrow channels only allowed a thin layer of the biofilms to be probed.30
Natural biofilms are exposed to a range of flow and nutrient conditions with gradients established longitudinally, radially and laterally. They form microcolony variants and establish different morphotypes with architectures ranging from hemispherical microcolonies of height more than 100 μm, thin bacterial plains only 10 μm in depth, to microcolonies that spread out and coalesce to form even bigger microcolonies. Thus, to obtain detailed force measurements that can be directly correlated with biofilm structures, it is necessary to perform such AFM measurements in a flow through system that can be manipulated to test, among other parameters the effects of the flow rate and species composition, without disrupting the biofilm architecture. Here we describe an open flow cell in which biofilms can be grown under conditions to simulate fluctuations expected in environmental settings, but in which the biofilms can also be accessed and manipulated by AFM without disrupting the structure or the state of the biofilm. We then applied AFM to describe how the Young's modulus of biofilms at their environmental interface changes according to the morphotypes, size and flow rate.
2 Materials and methods
2.1 Open flow chamber
Poly(dimethylsiloxane) (PDMS) flow cells were fabricated from a 3D printed stamp, using a Sylgard 184 kit (Dow Corning, UK). The flow cell had a straight channel with dimensions 0.2 cm × 0.5 cm × 3 cm (height × width × length). PDMS monomer and the curing agent were mixed in a 10![[thin space (1/6-em)]](https://www.rsc.org/images/entities/char_2009.gif) :
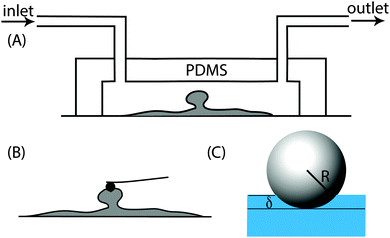
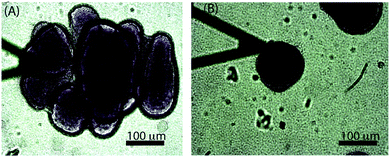
:![[thin space (1/6-em)]](https://www.rsc.org/images/entities/char_2009.gif) 1 ratio (w/w) and this mixture was placed in a vacuum chamber for 1 h to remove air bubbles trapped during mixing. The mixture was then slowly poured into the mould and left at room temperature for 24 h after which it was incubated at 70 °C for 1 h. Once the PDMS cooled, it was removed from the mould and sealed with a clean cover slip. Here the interaction between the glass and the PDMS is strong enough to hold the flowing media at the flow rates used in this work. Once the biofilms formed inside the channels, the PDMS part of the channel could be easily removed and the cover slip containing the biofilm was transferred to a petri dish containing 0.85% NaCl solution (Fig. 1A and B). The NaCl solution was pipetted out and replaced with fresh solution three times to remove non-attached cells and then probed using an atomic force microscope.
1 ratio (w/w) and this mixture was placed in a vacuum chamber for 1 h to remove air bubbles trapped during mixing. The mixture was then slowly poured into the mould and left at room temperature for 24 h after which it was incubated at 70 °C for 1 h. Once the PDMS cooled, it was removed from the mould and sealed with a clean cover slip. Here the interaction between the glass and the PDMS is strong enough to hold the flowing media at the flow rates used in this work. Once the biofilms formed inside the channels, the PDMS part of the channel could be easily removed and the cover slip containing the biofilm was transferred to a petri dish containing 0.85% NaCl solution (Fig. 1A and B). The NaCl solution was pipetted out and replaced with fresh solution three times to remove non-attached cells and then probed using an atomic force microscope.
2.2 Flow system
Continuous flow of nutrients was provided by a simple, gravity fed system, which comprised of an inverted conical flask (1 L), with a one-hole rubber stopper. A clinical transfusion kit (Baxter, UK) was inserted into the rubber stopper and this allows for adjustment of the flow rate. This system provides a continuous flow rather than a pulsating flow as is in the case when using a peristaltic pump.2.3 Sample preparation
2.4 Atomic force measurements
Once mature biofilms formed on the glass surface, the PDMS part of the flow cell was removed and the glass slide containing the biofilm was transferred into a petri dish and topped up with 0.85% NaCl. A Nanowizard II atomic force microscope (JPK Instruments, Berlin, Germany) coupled with an inverted optical microscope (Olympus, Japan) was used to quantify the Young's modulus of the biofilm. A silicon nitride cantilever of a spring constant of 0.03 N m−1 with a polystyrene spherical indenter of diameter 10 μm (Novascan Technologies Inc., USA) was used to indent the biofilms. The instrument was first calibrated using the thermal noise method34 to obtain the spring constant of the cantilever and all force measurements were performed in 0.85% NaCl. A maximum force of 4 nN at a rate of 10 μm s−1 was applied at 60 different points on the top of the microcolonies.2.5 Force–indentation curve analysis
The Young's modulus of biofilms was obtained from the force indentation curves using JPK Data Processing Software (JPK instruments AG). The software uses a built in algorithm based on the Hertz model for the spherical indenter, where force is related to the indentation depth according to the equation, | (1) |
 | (2) |
 | (3) |
2.6 Fluorescent staining and image acquisition
Concanavalin A, Texas Red Conjugate (Thermo Fisher Scientific, USA) at a concentration of 100 μg mL−1 was used to stain the Psl exopolysaccarides, of the 3 d biofilm for 20 min under static conditions. Three dimensional image stacks of biofilm colonies of different sizes were acquired using a FluoView 1000 confocal microscope (Olympus Japan). Two image channels were acquired for each stack, GFP 488 and Alexa 594. The number of z-stacks depended on the height of the colonies. The mean grey value for Alexa 594 for each frame of the z-stack was obtained using Image J (NIH, US).3 Results
3.1 Control experiments on the curved gel surface
In this study we aimed to describe how the mechanical properties at the biofilm periphery determine the architecture of the biofilm microcolony. We therefore determined the Young's modulus, E, of biofilms as a function of size, morphology and flow rate. To validate this approach and rule out the possibility of artifacts in the measurements due to the curvature of biofilm surfaces, the Young's modulus was first determined from the surface of cylindrical, homogenous hydrogels. The hydrogels used in these experiments had a diameter of 48 μm and a height of 30 μm, approximately the size of the smallest microcolonies studied here. The force curves were obtained from 60 different points each along the circumference, height, edges and in a spiral manner at the centre as in Fig. 2A, B, C and D respectively. The average Young's modulus obtained from the measurements along the circumference, height and in a spiral pattern was 3.3 ± 0.9 kPa, 3.3 ± 0.9 kPa and 3.6 ± 0.6 kPa respectively. However, measurements made along the edges of the hydrogel particles (5 μm from the edge) gave a lower E value of 1.6 ± 0.3 kPa. These values were highly reproducible when compared with multiple hydrogel cylinders tested independently. Hence, to avoid having a biased data by taking measurements along only one specific direction, all data were obtained by measuring points in a spiral manner (Fig. 2D). At an indentation depth of 500 nm the contact radius of the probe is 1.6 μm. As the ratio of the contact radius of the probe to the radius of curvature of the colony is small, the surface can be considered to be planar. Deviation in the measured E values was observed only if measurements were made at distances less than 5 μm from the edges of the hydrogels.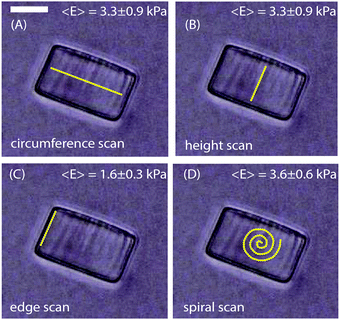 | ||
| Fig. 2 Hydrogel cylinders of diameter 48 μm and height 30 μm were probed along the (A) circumference (B) height (C) edge and (D) in a spiral manner. The scale bar is 20 μm. | ||
3.2 Plains and mushroom-shaped microcolonies have different surface mechanics
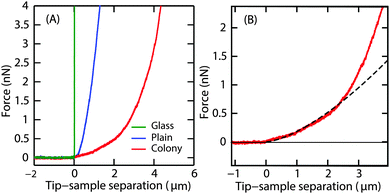
P. aeruginosa biofilms were grown in the flow cell for 3 d at a flow velocity of 0.03 cm s−1. On day 3, a thin layer of the biofilm of up to 10 μm thick covering the glass surface of the flow cell (henceforth referred to as ‘plains’) as well as randomly located hemispherical microcolonies of about 100 μm in height were observed. Indentation curves for the two different regions were compared (Fig. 3A). The difference in penetration depths on the biofilm surfaces and the non-deformable surface gives the indentation depth. A force of 4 nN indented the microcolony to a depth of 4 μm and the plain to 1 μm, demonstrating that the surface of the plains was stiffer than that of the microcolonies.Unlike the force curves obtained from the glass surface, the force curves obtained from the biofilm microcolonies and plains displayed two distinct regions (Fig. 3B), a small slope region immediately after the contact point followed by a steeper slope. This illustrates that the peripheral regions of the biofilm had distinct rheological properties as compared to the deeper regions of the biofilm, with the small slope region attributable to the response from the EPS on the surface of the biofilm.
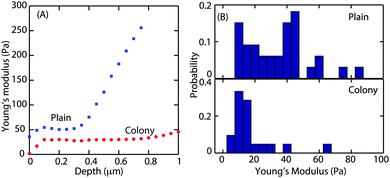
The Young's modulus, E, was obtained by fitting the Hertz model to the small slope region of the indentation curve, i.e. immediately after the contact point. It is important to find the optimal fit range that can be applied to all force curves. About 10 force curves were analysed and E values were obtained by increasing the fit range in steps of 0.05 μm. A representative curve of the Young's modulus as a function of increasing indentation depth in the case of microcolony and plains is shown in Fig. 4A.
For both morphotypes, after an initial equilibration of up to a depth of 100 nm, E was constant with increasing indentation depth. This plateau extended to a depth of 1 μm in the case of the microcolony (as shown by the red circles) and to a depth of about 0.3 μm (blue squares) in the case of the plains. Hence the average Young's modulus was obtained by fitting the Hertz model to all the force curves up to a depth of 0.3 μm. Fig. 4B shows the probability distribution of the Young's modulus obtained from 60 force curves. The average E value was 20 Pa for the microcolonies and 35 Pa for the plains. This demonstrates that the matrix at the surface of the microcolonies was softer than that of the plains. We also observed that the surface of the plains was much more rheologically heterogeneous, with E ranging from 20 to 1000 Pa depending on the thickness of the biofilm.
3.3 Microcolony size is a greater determinant of superficial biofilm rheology than hydrodynamic shear
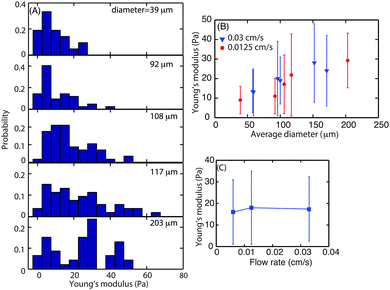
To investigate whether biofilms responded to increasing hydrodynamic shear by modifying their interfacial rheology, biofilms were grown at three different flow velocities, 0.03, 0.0125 and 0.006 cm s−1 which correspond to a mean hydrodynamic shear rate of 0.15, 0.0625 and 0.03 s−1. Following 3 d of growth of the biofilm, microcolonies were observed at random locations along the length of the flow cell. The size of those microcolonies was not uniform and varied in average diameter from 40 to 200 μm.The dependence of superficial E on microcolony diameter was investigated to understand the contribution of the rheological properties of the matrix to the structure of the microcolonies. For this purpose, biofilms grown at flow velocities of 0.0125 and 0.003 cm s−1 were studied. The probability distribution of superficial E for microcolonies of different sizes was determined for microcolonies with average diameter ranging from 39 to 203 μm (Fig. 5A). The average E value for smaller microcolonies with average diameter 1100 μm was approximately 10 Pa. The E values for the microcolonies with average diameters of 108, 117 and 200 were found to be 17, 19 and 25 Pa, respectively. The average biofilm surface E was plotted as a function of average microcolony diameter (Fig. 5B). It can be seen that the Young's modulus increases with diameter up to an average diameter of 150 μm but seems to approach a plateau thereafter. The data for larger diameters are not available as the larger spherical microcolonies either disperse or form diffuse colonies.
This also demonstrated that superficial biofilm stiffness was most closely related to the microcolony size rather than hydrodynamic shear. To investigate further whether biofilm surface E did in fact depend more on the microcolony size than flow velocity, microcolonies of similar sizes, ranging from 108 to 114 μm in diameter, grown at three flow velocities were probed for their surface mechanical properties (Fig. 5C). This analysis indicated that the Young's modulus of the superficial layer of microcolonies was independent of flow velocity with an average E of 17 Pa for similarly sized colonies (≈110 μm diameter).
3.4 Morphologically different colonies behaved differently
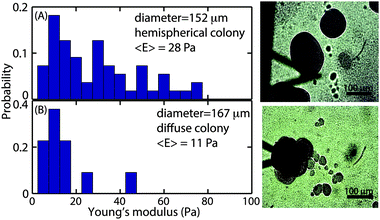
While the size-dependence of the superficial biofilm rheology focused on hemispherical microcolonies, we also observed a subset of microcolonies that were far less regular in form. Approximately 10% of the colonies had poorly defined boundaries, and many appeared to have coalesced into larger microcolonies (Fig. 6A). Microcolonies with this irregular, diffuse morphology tended to have a larger cross sectional area compared to the hemispherical microcolonies. For example, one such irregular microcolony had an average diameter of 406 μm whereas the largest of the mushroom shaped microcolonies had a diameter of approximately 200 μm after 3 d of growth at a 0.03 cm s−1 flow velocity (Fig. 6A). We postulated that the superficial E of the diffuse microcolonies would differ from the more regular colonies and thus compared similarly sized microcolonies of the two distinct forms. The probability distributions of E for hemispherical colony of average diameter 152 μm and a diffuse colony of average diameter 167 μm (Fig. 7A and B) indicated that the hemispherical colony was stiffer than the diffuse colony with E values of 28 Pa and 11 Pa, respectively.3.5 Observation of polysaccharide Psl
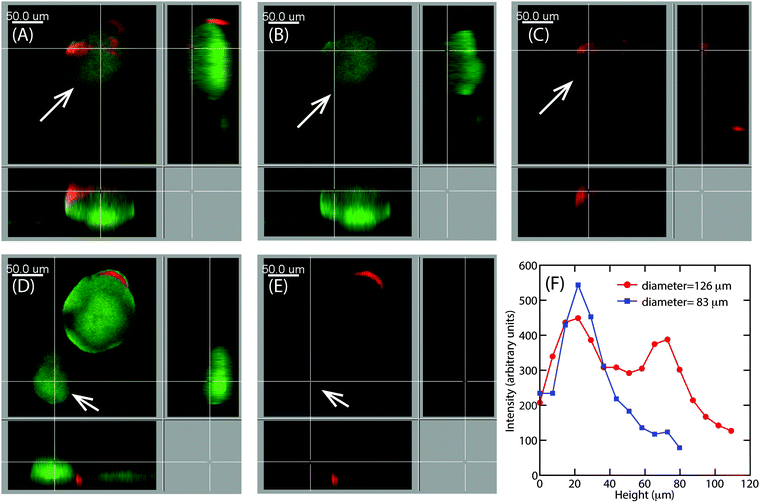
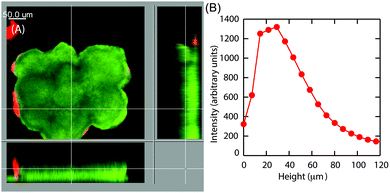
Earlier particle tracking studies have shown that the polysaccharide, Psl contributes to the stiffening of biofilms, as the biofilms formed by Pel mutant strain of P. aeruginosa had a lower creep compliance than the wild type.20 Hence we proposed that the observed size dependent increase in E at the superficial surface of the hemispherical microcolonies could be the result of the expression of Psl. To test our hypothesis, we stained the biofilms for Psl and observed the presence of Psl at the outer surface close to the base of the microcolonies, which is in agreement with the previously reported results.42,43 In addition to this, Psl was also observed as patches on the uppermost surface of larger microcolonies of diameter around 126 μm (Fig. 8A). While there was a higher intensity of red fluorescence, representative of Psl, at the base of small microcolonies, the intensity decreased towards the top of the colony in the case of smaller colony of average diameter about 83 μm (Fig. 8D). A comparison of Psl stain intensity as a function of height from the substratum is shown in Fig. 8F. There is a higher intensity at around 22 μm from the base which is in agreement with the previously reported results that Psl is present at the base of the microcolonies.43 The intensity decreased towards the top of the smaller microcolonies. In larger microcolonies, however, a second peak in fluorescence intensity at a height of 73 μm was observed, indicating that Psl is expressed at a later stage of growth when the microcolonies reach these larger sizes. The diffuse colonies however did not show the presence of Psl on the uppermost surface (Fig. 9A and B).4 Discussion
Interfacial properties are crucial for biofilm function. They determine not only how biofilms sense their physical environment, but also how they sense their chemical environment through irreversible and reversible associations.44 In particular, the matrix potentially plays a role in the signalling responses of bacteria, where the matrix absorbs the signal molecules at concentrations higher than can be achieved in the surrounding aqueous environment.45,46 Similarly, the superficial region of biofilms mediates interactions between biofilm-forming pathogens and hosts. This region mediates modifications in the physicochemical properties of colonized surfaces and changes in host immune responses.47 For example, the matrix facilitates the “launch a shield” response where rhamnolipids surround biofilms and deactivate polymorphonuclear neutrophilic leukocytes.48 These examples, plus the understanding that the matrix also plays a role in the increased tolerance of the biofilm to antimicrobials highlight the need to fully elucidate the roles of exopolymers in these biofilm specific interactions with other community members. The methodology described in this study represents one such tool that allows for the probing of a native biofilm to describe its surface properties and how they change during different developmental stages.The method developed here was used to specifically describe biofilm surface mechanics. To date, studying the rheological properties of biofilms has involved the use of rheometer49 or introducing foreign particles such as microbeads or magnetic probes.20,21 In contrast, the development of open flow cells coupled with atomic force microscopy allowed us to investigate the impact of shear forces on the development of a biofilm structure and the relationship with its viscoelastic properties without disrupting the biofilm structure. Another important consideration when obtaining the Young's modulus of soft biological samples is the accurate determination of the optimum contact point. Various authors have used different approaches to determine the contact point.50 Here, the deflection of the cantilever was assumed to be due to the mechanical indentation of the biofilm.51–53 We assumed that the small characteristic slope observed immediately upon contact was due to the superficial biofilm EPS. This approach is supported by earlier studies showing that if the polysaccharide layer in a single bacterium is removed, this soft slope disappears.54 Some authors have attributed the nonlinear response after the contact point to surface forces and steric interactions.54,55 However, these forces are prominent only at low ionic strength of less than 1 mM. In this study, we have used an ionic strength of 145 mM NaCl and hence the effect of the surface interactions could be ignored. Previous studies have shown that biofilms are sensitive to osmotic stress as there was a dependence of elastic and viscous moduli on the salt concentrations.12 The NaCl concentration used in this study is close to the normal saline concentration.
Traditionally viscoelastic properties of materials are modelled by spring and dashpot elements under indentation loading, where spring and the dashpot represent the elastic and the viscous properties respectively.56 This approach has been used to model the viscoelastic properties of materials in atomic force microscopy.57 Different authors have used the three-element Voigt model or the four-element Maxwell–Voigt model to represent the properties of biofilms.29,58 When the AFM tip is in contact with the sample under a steady force for a certain period of time, two regions are observed in the indentation curve (a) the instantaneous indentation immediately after the contact time (b) followed by a time dependent indentation or the creep. The above models are used to obtain the viscoelastic properties from the creep indentation.12,59,60 In this paper we have obtained the Young's modulus by fitting the time independent Hertz model described in eqn (1) to the instantaneous indentation.
Vastly different surface mechanics were observed for microcolonies and plains, with the microcolonies being softer than the plains. This can be attributed to the fact that the colonies express more EPS to facilitate the formation and maintenance of the architecture of biofilm microcolonies. The plains, on the other hand, are more heterogeneous with E ranging from 30 Pa to 2 kPa, which may be due to the different composition of the matrix corresponding to varying thickness of the biofilm plains along the length of the flow cell. The Young's modulus of the colonies measured here agrees with most data reported in the literature, with values ranging from 20 Pa to 300 Pa.61–64 However, studies using AFM to measure the viscoelastic properties of biofilms reported much larger values, ranging from 15 kPa to 1 MPa, which have been attributed to variations in growth conditions, the type and age of the samples, the length scale and duration of the measurement and the magnitude of the applied stress.29 Other works involving compression22 and uniaxial micro-indentation65 have also reported Young's moduli ranging from 6 to 8 kPa. These differences in moduli from the Pa to kPa range observed by different authors can be related to the difference in the thickness of the expressed EPS which in turn can be related to the thickness of the biofilm and the formation of microcolonies. The microcolonies at different stages of maturity was also found to express different components of the matrix, which can contribute to the differences in values by different authors.
In this study, the microcolony size was found to be the primary determinant of the microcolony surface rheology. It has been reported that biofilm colony growth occurs at the periphery rather than in the interior.66 This demonstrates that the periphery of the microcolonies is dynamic, compositionally and mechanically. This may involve either the expression of different kinds of polysaccharides or other components that determine the biofilm architecture according to the stage of growth.8,20,42,43 Here, the rheological properties, however, were found to be independent of the flow rate. Earlier studies on biofilm streamers under turbulent flow conditions posited that their rheology of the streamers depended on the flow rate.61,63 Magnetic tweezing experiments on biofilms have shown that the rheological properties of biofilms are dependent on the flow rate with creep compliance being larger for biofilms grown under a higher flow rate.21 However, in the same study the authors noted that this dependence did not apply to regions closer to the surface of the biofilm. Our observation of the dependence of the mechanical properties of the superficial layer of the biofilm on the flow rate is thus consistent with those earlier publications.
The formation of the characteristic mushroom-shaped microcolony structures has been shown previously to require the polysaccharides Psl and alginate.67 Confocal images of the hemispherical microcolonies presented here revealed patchy distributions of the Psl polysaccharide at the outermost layer of larger colonies and a lack of Psl on smaller hemispherical colonies and large diffuse colonies. The observed increase in the E values of the microcolonies is due to the increasing production of Psl polysaccharides on larger microcolonies. Beyond the diameter of about 150 μm, the linear dependence tends to reach a plateau as the colonies reach the dispersion stage of the biofilm life cycle and may lead to the thinning of the Psl matrix. Hence, we could correlate the change in the mechanical properties of microcolonies with the change in the composition of the matrix of the growing biofilm. Our work highlights that the dynamic expression patterns of biofilm matrix products are associated with the microcolony size and physical properties, which might have essential roles in biofilm physiology with regards to, for example, antimicrobial tolerance, resistance to the host immune responses and dispersal.
5 Conclusion
AFM has been shown to be an effective tool for scanning the material properties of biofilm surfaces. The flow cell described herein could be opened and accessed by the AFM cantilever, allowing for controlled growth of biofilms and probing of biofilm surface mechanics at desired locations. While this was used to describe surface mechanics, AFM is a suitable method for analyzing a range of properties contributing to biofilm interactions with their environments. We thus demonstrated that the mechanics of microcolonies differed from the plains and depended on the colony size. Further, the microcolony size was a greater determinant factor of the biofilm mechanics than hydrodynamic shear. The positive correlation between the biofilm surface stiffness and the microcolony size was attributed to the differential expression of biofilm EPS according to the stages of biofilm growth.Acknowledgements
This research was supported by the National Research Foundation Singapore through the Singapore MIT Alliance for Research and Technology's BioSystems and Micromechanics (BioSyM) IRG research program, the National Science Foundation and by the National Research Foundation and Ministry of Education Singapore under its Research Centre of Excellence Programme.References
- C. D. Nadell, K. Drescher, N. S. Wingreen and B. L. Bassler, ISME J., 2015, 9, 1700–1709 CrossRef PubMed.
- H.-C. Flemming, T. R. Neu and D. J. Wozniak, J. Bacteriol., 2007, 189, 7945–7947 CrossRef CAS PubMed.
- J. W. Costerton, Z. Lewandowski, D. E. Caldwell, D. R. Korber and H. M. Lappin-Scott, Annu. Rev. Microbiol., 1995, 49, 711–745 CrossRef CAS PubMed.
- H.-C. Flemming and J. Wingender, Nat. Rev. Microbiol., 2010, 8, 623–633 CAS.
- E. Karatan and P. Watnick, Microbiol. Mol. Biol. Rev., 2009, 73, 310–347 CrossRef CAS PubMed.
- B. W. Peterson, Y. He, Y. Ren, A. Zerdoum, M. R. Libera, P. K. Sharma, A.-J. van Winkelhoff, D. Neut, P. Stoodley and H. C. van der Mei, et al. , FEMS Microbiol. Rev., 2015, 39, 234–245 CrossRef PubMed.
- P. Entcheva-Dimitrov and A. M. Spormann, J. Bacteriol., 2004, 186, 8254–8266 CrossRef CAS PubMed.
- L. Yang, Y. Hu, Y. Liu, J. Zhang, J. Ulstrup and S. Molin, Environ. Microbiol., 2011, 13, 1705–1717 CrossRef CAS PubMed.
- B. Kundukad, J. Yan and P. S. Doyle, Soft Matter, 2014, 10, 9721–9728 RSC.
- J. M. Vroom, K. J. De Grauw, H. C. Gerritsen, D. J. Bradshaw, P. D. Marsh, G. K. Watson, J. J. Birmingham and C. Allison, Appl. Environ. Microbiol., 1999, 65, 3502–3511 CAS.
- M. Wagner, D. Taherzadeh, C. Haisch and H. Horn, Biotechnol. Bioeng., 2010, 107, 844–853 CrossRef CAS PubMed.
- L. Pavlovsky, J. G. Younger and M. J. Solomon, Soft Matter, 2013, 9, 122–131 RSC.
- E. J. Stewart, M. Ganesan, J. G. Younger and M. J. Solomon, Sci. Rep., 2015, 5, 13081 CrossRef CAS PubMed.
- M. Böl, A. E. Ehret, A. Bolea Albero, J. Hellriegel and R. Krull, Crit. Rev. Biotechnol., 2013, 33, 145–171 CrossRef PubMed.
- N. Billings, A. Birjiniuk, T. S. Samad, P. S. Doyle and K. Ribbeck, Rep. Prog. Phys., 2015, 78, 036601 CrossRef PubMed.
- S. Aggarwal and R. M. Hozalski, Langmuir, 2012, 28, 2812–2816 CrossRef CAS PubMed.
- D. N. Hohne, J. G. Younger and M. J. Solomon, Langmuir, 2009, 25, 7743–7751 CrossRef CAS PubMed.
- S. Rogers, C. Van Der Walle and T. Waigh, Langmuir, 2008, 24, 13549–13555 CrossRef CAS PubMed.
- A. Birjiniuk, N. Billings, E. Nance, J. Hanes, K. Ribbeck and P. S. Doyle, New J. Phys., 2014, 16, 085014 CrossRef PubMed.
- S. C. Chew, B. Kundukad, T. Seviour, J. R. van der Maarel, L. Yang, S. A. Rice, P. Doyle and S. Kjelleberg, mBio, 2015, 6, e00688 CrossRef PubMed.
- O. Galy, P. Latour-Lambert, K. Zrelli, J.-M. Ghigo, C. Beloin and N. Henry, Biophys. J., 2012, 103, 1400–1408 CrossRef CAS PubMed.
- A. Cense, E. Peeters, B. Gottenbos, F. Baaijens, A. Nuijs and M. Van Dongen, J. Microbiol. Methods, 2006, 67, 463–472 CrossRef CAS PubMed.
- M. Chen, Z. Zhang and T. Bott, Colloids Surf., B, 2005, 43, 61–71 CrossRef CAS PubMed.
- C. J. Wright, M. K. Shah, L. C. Powell and I. Armstrong, Scanning, 2010, 32, 134–149 CrossRef CAS PubMed.
- F. MacKintosh and C. Schmidt, Curr. Opin. Colloid Interface Sci., 1999, 4, 300–307 CrossRef CAS.
- Y. Oh, N. Lee, W. Jo, W. Jung and J. Lim, Ultramicroscopy, 2009, 109, 874–880 CrossRef CAS PubMed.
- F. Ahimou, M. J. Semmens, P. J. Novak and G. Haugstad, Appl. Environ. Microbiol., 2007, 73, 2897–2904 CrossRef CAS PubMed.
- M. Baniasadi, Z. Xu, L. Gandee, Y. Du, H. Lu, P. Zimmern and M. Minary-Jolandan, Mater. Res. Express, 2014, 1, 045411 CrossRef.
- P. C. Lau, J. R. Dutcher, T. J. Beveridge and J. S. Lam, Biophys. J., 2009, 96, 2935–2948 CrossRef CAS PubMed.
- A. P. Mosier, A. E. Kaloyeros and N. C. Cady, J. Microbiol. Methods, 2012, 91, 198–204 CrossRef PubMed.
- D. C. Appleyard, S. C. Chapin, R. L. Srinivas and P. S. Doyle, Nat. Protoc., 2011, 6, 1761–1774 CrossRef CAS PubMed.
- L. Yang, W. Hengzhuang, H. Wu, S. Damkiær, N. Jochumsen, Z. Song, M. Givskov, N. Høiby and S. Molin, FEMS Immunol. Med. Microbiol., 2012, 65, 366–376 CrossRef CAS PubMed.
- B. Koch, L. E. Jensen and O. Nybroe, J. Microbiol. Methods, 2001, 45, 187–195 CrossRef CAS PubMed.
- J. L. Hutter and J. Bechhoefer, Rev. Sci. Instrum., 1993, 64, 1868–1873 CrossRef CAS.
- A. Safari, Z. Tukovic, M. Walter, E. Casey and A. Ivankovic, Biofouling, 2015, 31, 651–664 CrossRef CAS PubMed.
- C. Laspidou and N. Aravas, Water Sci. Technol., 2007, 55, 447–453 CrossRef CAS PubMed.
- D. Taherzadeh, C. Picioreanu, U. Küttler, A. Simone, W. A. Wall and H. Horn, Biotechnol. Bioeng., 2010, 105, 600–610 CrossRef CAS PubMed.
- B. V. Derjaguin, V. M. Muller and Y. P. Toporov, J. Colloid Interface Sci., 1975, 53, 314–326 CrossRef CAS.
- K. Johnson, K. Kendall and A. Roberts, Proc. R. Soc. London, Ser. A, 1971, 301–313 CrossRef CAS.
- R. Garca and R. Perez, Surf. Sci. Rep., 2002, 47, 197–301 CrossRef.
- Y. Chen, W. Norde, H. C. van der Mei and H. J. Busscher, mBio, 2012, 3, e00378 CAS.
- L. Ma, M. Conover, H. Lu, M. R. Parsek, K. Bayles and D. J. Wozniak, PLoS Pathog., 2009, 5, e1000354 Search PubMed.
- S. Wang, M. R. Parsek, D. J. Wozniak and L. Z. Ma, Environ. Microbiol., 2013, 15, 2238–2253 CrossRef CAS PubMed.
- M. J. Brown and J. Lester, Water Res., 1982, 16, 1549–1560 CrossRef CAS.
- T. Seviour, S. H. Hansen, L. Yang, Y. H. Yau, V. B. Wang, M. R. Stenvang, G. Christiansen, E. Marsili, M. Givskov and Y. Chen, et al. , J. Biol. Chem., 2015, 290, 6457–6469 CrossRef CAS PubMed.
- T. Charlton, M. C. Givskov, R. DeNys, J. B. Andersen, M. Hentzer, S. Rice and S. Kjelleberg, Methods Enzymol., 2001, 336, 108–128 CAS.
- N. Hoiby, A. Fomsgaard, E. Jensen, H. Johansen, G. Kronborg, S. Pedersen, T. Pressler and A. Kharazmi, The immune response to bacterial biofilms, Cambridge University Press, Cambridge, UK, 1995, pp. 233–250 Search PubMed.
- M. Alhede, T. Bjarnsholt, P. Ø. Jensen, R. K. Phipps, C. Moser, L. Christophersen, L. D. Christensen, M. van Gennip, M. Parsek and N. Høiby, et al. , Microbiology, 2009, 155, 3500–3508 CrossRef CAS PubMed.
- B. W. Towler, C. J. Rupp, A. B. Cunningham and P. Stoodley, Biofouling, 2003, 19, 279–285 CrossRef PubMed.
- F. Gaboriaud and Y. F. Dufrêne, Colloids Surf., B, 2007, 54, 10–19 CrossRef CAS PubMed.
- A. Touhami, B. Nysten and Y. F. Dufrêne, Langmuir, 2003, 19, 4539–4543 CrossRef CAS.
- F. Gaboriaud, S. Bailet, E. Dague and F. Jorand, J. Bacteriol., 2005, 187, 3864–3868 CrossRef CAS PubMed.
- X. Yao, J. Walter, S. Burke, S. Stewart, M. Jericho, D. Pink, R. Hunter and T. Beveridge, Colloids Surf., B, 2002, 23, 213–230 CrossRef CAS.
- T. A. Camesano and B. E. Logan, Environ. Sci. Technol., 2000, 34, 3354–3362 CrossRef CAS.
- N. I. Abu-Lail and T. A. Camesano, Biomacromolecules, 2003, 4, 1000–1012 CrossRef CAS PubMed.
- H. Murata, Rheology-Theory and Application to Biomaterials, Janeza Trdine, 9, 51000, Rijeka, Croatia, 2012, pp. 403–426 Search PubMed.
- E. A. López-Guerra and S. D. Solares, Beilstein J. Nanotechnol., 2014, 5, 2149–2163 CrossRef PubMed.
- V. Vadillo-Rodriguez, S. R. Schooling and J. R. Dutcher, J. Bacteriol., 2009, 191, 5518–5525 CrossRef CAS PubMed.
- W. L. Jones, M. P. Sutton, L. McKittrick and P. S. Stewart, Biofouling, 2011, 27, 207–215 CrossRef CAS PubMed.
- S. Aggarwal, E. H. Poppele and R. M. Hozalski, Biotechnol. Bioeng., 2010, 105, 924–934 CAS.
- P. Stoodley, Z. Lewandowski, J. D. Boyle and H. M. Lappin-Scott, Biotechnol. Bioeng., 1999, 65, 83–92 CrossRef CAS PubMed.
- P. Stoodley, A. Jacobsen, B. Dunsmore, B. Purevdorj, S. Wilson, H. Lappin-Scott and J. Costerton, Water Sci. Technol., 2001, 43, 113–120 CAS.
- I. Klapper, C. Rupp, R. Cargo, B. Purvedorj and P. Stoodley, Biotechnol. Bioeng., 2002, 80, 289–296 CrossRef CAS PubMed.
- M. Wloka, H. Rehage, H.-C. Flemming and J. Wingender, Colloid Polym. Sci., 2004, 282, 1067–1076 CAS.
- V. Körstgens, H.-C. Flemming, J. Wingender and W. Borchard, J. Microbiol. Methods, 2001, 46, 9–17 CrossRef.
- J. Liu, A. Prindle, J. Humphries, M. Gabalda-Sagarra, M. Asally, D. L. Dong-yeon, S. Ly, J. Garcia-Ojalvo and G. M. Süel, Nature, 2015, 523, 550–554 CrossRef CAS PubMed.
- A. Ghafoor, I. D. Hay and B. H. Rehm, Appl. Environ. Microbiol., 2011, 77, 5238–5246 CrossRef CAS PubMed.
| This journal is © The Royal Society of Chemistry 2016 |

