
 Open Access Article
 This Open Access Article is licensed under a
 Creative Commons Attribution 3.0 Unported Licence
Quantitative morphological characterization of bicontinuous Pickering emulsions via interfacial curvatures†‡
Matthew
Reeves
a,
Kevin
Stratford
ab and
Job H. J.
Thijssen
*a
aSUPA School of Physics and Astronomy, James Clerk Maxwell Building, Peter Guthrie Tait Road, King's Buildings, Edinburgh, EH9 3FD, UK. E-mail: j.h.j.thijssen@ed.ac.uk; Tel: +44 (0)131 650 5274
bEdinburgh Parallel Computing Centre, James Clerk Maxwell Building, Edinburgh, EH9 3FD, UK
First published on 22nd March 2016
Abstract
Bicontinuous Pickering emulsions (bijels) are a physically interesting class of soft materials with many potential applications including catalysis, microfluidics and tissue engineering. They are created by arresting the spinodal decomposition of a partially-miscible liquid with a (jammed) layer of interfacial colloids. Porosity L (average interfacial separation) of the bijel is controlled by varying the radius (r) and volume fraction (ϕ) of the colloids (L ∝ r/ϕ). However, to optimize the bijel structure with respect to other parameters, e.g. quench rate, characterizing by L alone is insufficient. Hence, we have used confocal microscopy and X-ray CT to characterize a range of bijels in terms of local and area-averaged interfacial curvatures; we further demonstrate that bijels are bicontinuous using an image-analysis technique known as ‘region growing’. In addition, the curvatures of bijels have been monitored as a function of time, which has revealed an intriguing evolution up to 60 minutes after bijel formation, contrary to previous understanding.
1 Introduction
Bijels (bicontinuous interfacially-jammed emulsion gels) are a versatile and relatively new class of soft materials, whereby a bicontinuous interlocking structure of two phase-separated liquids is stabilized by a (jammed) layer of interfacial colloids.1–7 As long as the colloids are sufficiently neutrally-wetting, i.e. have no preference for either liquid phase, the bicontinuous pattern formed by the liquid–liquid (L–L) interface during spinodal decomposition can be maintained and eventually locked in (Fig. 1). This is because, during the phase separation, the area fraction of particles increases until they jam, at which point the system stops coarsening.8 Particle rearrangements could lead to residual coarsening,1 but continued macroscopic coarsening is precluded due to the attachment energy E of the interfacial particles, which for particle radius r ≈ 250 nm and interfacial tension ≈0.1 mN m−1, is of the order 103kbT.9 The bijel lends itself to a host of technological applications, including tissue engineering,10 catalysis11 and microfluidics,12 owing to its morphology and high degree of structural tunability.1,2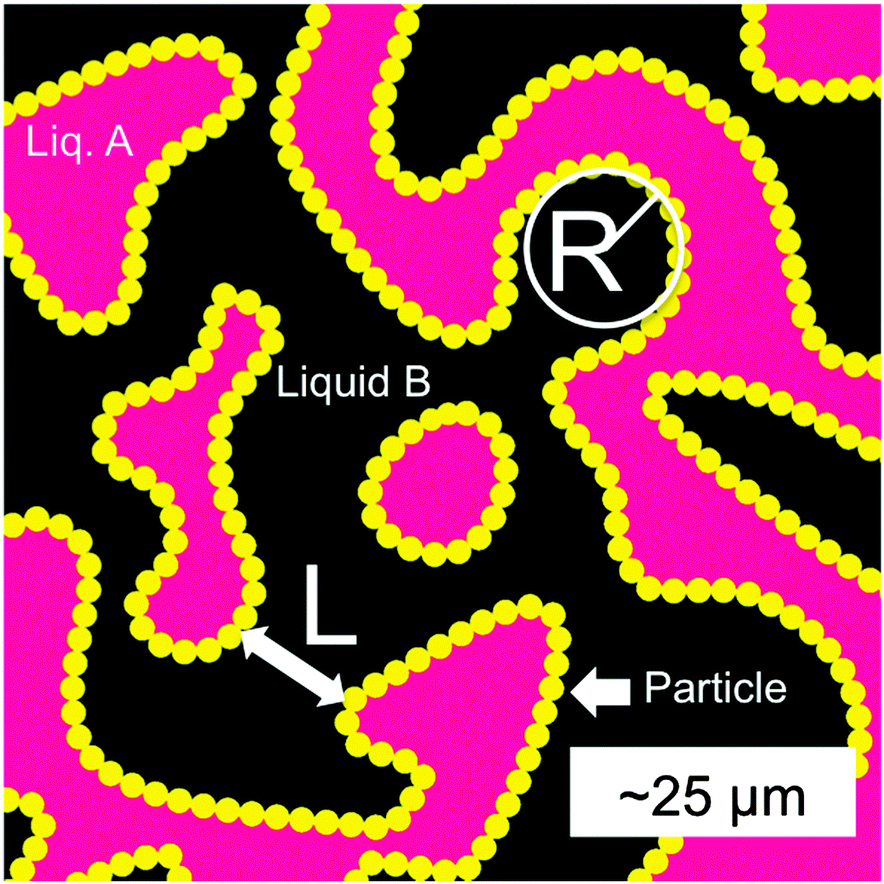 | ||
| Fig. 1 A schematic of a 2D slice of a 3D bijel. The liquid phases (A and B) are separated by a jammed layer of particles (yellow) at the interface, with a typical separation L. The principal radius of curvature R at a point on the interface is the radius of a circle which intersects tangentially at that point, with a curvature κ = 1/R. In 3D a point will have two principal curvatures. Adapted from Reeves et al.15 | ||
The water/lutidine (W/L) bijel has been shown to be a particularly promising system for material templating – one of the fluid phases can be selectively polymerized and, on removal of the unpolymerized liquid phase, results in a bicontinuous microporous monolith.13,14 To tune the final structure of the material, samples are usually (and simply) characterized by their porosity, or rather their average interfacial separation (‘channel width’) L (see Fig. 1). L is controlled by varying the volume fraction (ϕ) and radius (r) of the colloids (L ∝ r/ϕ) in the initial bijel mixture. L can be measured by constructing a pixel-based radial distribution function (in real space) from a 2D fluorescent confocal microscopy image of a bijel,15 in which one phase is bright and the other dark (owing to the preference of a fluorescent dye for one of the phases). Alternatively, the dominant wavevector q* can be determined by performing a scattering experiment16 or by taking the Fourier transform of a 2D bijel image8 – then L = 2π/q*. L in the polymerized case can be extracted from X-ray micro-CT data in a similar fashion, where the contrast is provided by the difference in electron density across the solid/air interface.
Measuring L is relatively straightforward, but does not convey information about local geometrical or global topological parameters which might be useful for optimizing the bijel for applications. Indeed, visible changes in the bijel morphology are noticed when different particle sizes and/or quench rates are used in the fabrication which seem not to be quantified purely by L.15 Moreover, bijel fabrications produce samples which show a sliding scale of quality (as a function of particle size and quench rate), with complete failure on one end and homogenous ‘clean’ samples on the other. It would be beneficial to have a quantitative characterization to accompany these qualitative observations, and hence be able to systematically optimize bijel fabrication procedures.
A complementary way to characterize complex 3D structures such as the bijel is to measure the distributions of interfacial curvatures.13,17 At each point on the interface between the coexisting liquid domains, it is possible to define two mutually-orthogonal principle radii of curvature (see Fig. 1), R1 & R2, and two principle curvatures κ1 & κ2 (κi = ± 1/Ri).18 In the current study, the curvature is defined to be positive if the interface curves towards the oil phase, and negative if it curves towards the water phase. The structure can then be characterized19 by computing the area-averaged mean curvature:
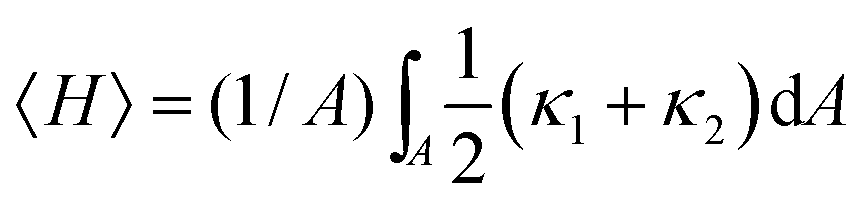 | (1) |
 | (2) |
In addition to the practical motivations for the present study, there are several interesting physics questions to be explored. For example, it is not completely clear whether (neutrally-wetting) particles simply ‘lock in’ the spinodal pattern of the demixing liquids, or if they perturb it in some way before arresting the phase separation.20 Any perturbation could also depend on other parameters like particle size and/or contact angle.15,21 Moreover, in the W/L system, the interfacial particles are known to form a permanent gel after a certain incubation period22 – this may or may not have an effect on the morphology. Finally, it is also not known yet if the bijel structure is entirely homogeneous and/or bicontinuous in three dimensions.
A (small-scale) curvature analysis on a W/L bijel and its polymerized counterpart has already been performed, on one size of particle and one quench rate only, which showed a distribution of mean curvature centred (approximately) on zero, and a negative value for the area-averaged Gaussian curvature, which are similar to the hallmarks of a member of the family of triply-periodic minimal surfaces, the gyroid.13 This means that the L–L interface is, on average, composed of saddle points, with principal curvatures equal in magnitude but opposite in sign. Bicontinuous systems similar in 3D structure to bijels have also been analyzed in this way. For example, it has been shown that a spinodally-decomposing polymer blend also resembles the gyroid.23 More recently, a topological analysis has elucidated the mechanisms at play during the phase separation of such polymer blends.24
In this paper, we systematically characterize a range of W/L bijel samples by using 3D confocal microscopy data and a commercially available image analysis package. We benchmark our analysis by using X-ray CT data (with improved statistics over confocal) and computer-generated data representing the two extremes of the range of possible structures in this system (spheres and gyroid); we also compare our results to lattice-Boltzmann simulation of bijel formation. We measure distributions of interfacial curvatures, and then compute area-averaged quantities in order to characterize the topology of the structures as a function of particle size, quench rate, and time after bijel formation. We find that the most hyperbolic samples are formed when using the smallest particles and the fastest quench rates, and that in some cases the distribution of local curvatures changes with time, which may be linked to the emergence of a particle-bonded network at the L–L interface.
2 Experimental methods
2.1 Particle synthesis
The synthesis procedure for the particles used in this study has been previously reported.15 The most relevant aspects are repeated here for the benefit of the reader. Stöber silica particles, labeled with fluorescein (or rhodamine) isothiocyanate (FITC or RITC) were synthesized with different radii by controlling the reaction temperature. Sizes were obtained from dynamic light scattering (DLS) and transmission electron microscopy (TEM) measurements. The three sizes used in this study are r = 50 nm (TEM), 80/63 nm (DLS/TEM) and 367 nm (TEM) – polydispersities (in terms of TEM results) were 13.8%, 15.1% and 5.5% respectively. The sizes obtained by TEM will be used in this study to provide a valid comparison. The 367 nm and 63 nm particles were labelled with FITC, and the 50 nm particles were labelled with RITC.Surface chemistry was designed to be similar by modifying the concentration of dye in the reaction mixture. Neutral wetting conditions were achieved by drying small amounts (≈50 mg) at 170 °C and 20 mBar pressure.25,26 This process is known to remove surface bound water and may also cause moderate dehydroxylation of the silica surface.27 Wetting properties were maintained across the range of particles used by tuning the drying time and inspecting confocal micrographs of the emulsion structures that they formed. We denote the 50 and 63 nm particles as nanoparticles (NPs) and the 367 nm particles as microparticles (MPs).
2.2 Bijel preparation
Bijels were prepared by first dispersing the MPs or NPs in deionized water by ultrasonication (Sonics Vibracell). The MPs were sonicated for (2 × 2) minutes at 8 W power, with 10 seconds of vortex mixing after each sonication step. The NPs were sonicated for an extra 10 minutes at 8 W with an extra 10 seconds of vortex mixing, to ensure proper redispersion. Subsequently, lutidine (2,6-dimethylpyridine, ≥99% Aldrich), was added along with Nile Red dye (or Nile Blue if the RITC labelled NPs were to be used) at a concentration of around 10 μM, to give a mixture with mass ratio of W![[thin space (1/6-em)]](https://www.rsc.org/images/entities/char_2009.gif) :L = 72:28. This particular mass ratio was used to prepare the system at its critical composition,28 so that spinodal decomposition would be (at least initially) the preferred phase separation mechanism.8 Mixtures were transferred to a glass cuvette (1 mm path length, Starna Scientific) and placed inside a metal block, which was itself placed inside a temperature stage (Instec).
:L = 72:28. This particular mass ratio was used to prepare the system at its critical composition,28 so that spinodal decomposition would be (at least initially) the preferred phase separation mechanism.8 Mixtures were transferred to a glass cuvette (1 mm path length, Starna Scientific) and placed inside a metal block, which was itself placed inside a temperature stage (Instec).
Following ref. 15, the mixtures were quenched from room temperature up to 45 or 50 °C (the vertical line in Fig. 2) in various ways depending on the desired rate. A rate of 1 °C min−1 was achieved by programming the temperature stage – a thermocouple was used to verify that the sample temperature did not lag the stage temperature. A rate of 17 °C min−1 was achieved by pre-warming the metal block to 45 °C before the insertion of the cuvette. A rate of 350 °C min−1 was achieved by placing the cuvette on the top of a small cardboard box inside a microwave (DeLonghi, P80D20EL-T5A/H, 800 W), set to ‘auto-defrost’ for 5 or 6 seconds. In all cases, when the temperature exceeded 34.1 °C the mixture phase separated via spinodal decomposition, resulting in the particles attaching to the liquid–liquid interface and ultimately arresting the bicontinuous structure, with coexisting phase compositions given by the positions A & B in Fig. 2. Some bijels were polymerized following procedures described by Lee & Mohraz.13
 | ||
| Fig. 2 Water/lutidine phase diagram, plotting existing data measured by Grattoni et al.28 Samples are prepared in the single-phase regime (i.e. below the critical temperature of 34.1 °C) at a critical weight fraction of 28% lutidine and are subsequently quenched to 45 °C (or sometimes 50 °C). Coexisting phases of lutidine-poor (composition marked A) and lutidine-rich (composition marked B) are created. | ||
Particle concentrations for the MPs were 2.8%, the 63 nm NPs between 0.6–1.8% and the 50 nm NPs 1.4%, producing bijels with lengthscales 21 μm < L < 91 μm. The full specifications are included in the ESI.‡ The effect of changing the volume fraction is to change the final bijel lengthscale L according to L ∝ r/ϕ which also changes the range of interfacial curvature values.2 Where possible, we compare bijels with similar L values. As this is not always possible, we normalize the curvature values with respect to the surface to volume ratio, a quantity with units of inverse length.29 We also average the results from multiple samples (where possible) to show that the volume fraction does not play a pivotal role in determining the topology of the final structure (see Section 2.5).
2.3 Data acquisition
 | ||
| Fig. 3 (a) Example fluorescence confocal microscopy image of a bijel stabilized by NPs (r = 63 nm), quenched at 17 °C min−1. Particles are shown in yellow, whereas magenta indicates the lutidine-rich phase. Scale bar 200 μm. Z-Stacks are compiled by acquiring these 2D (X–Y) images at incrementing Z positions. (b) Example X-ray CT image of a polymerized bijel, where one of the channels is air (black) and the other polymer (white). Scale bar 500 μm. Imaging with this method allows a larger sample volume to be probed, providing better statistics than confocal microscopy. | ||
:35 by volume. The sample size was approximately 6 × 6 × 3 microns (see ESI‡ for exact simulation parameters). The simulation was run until the particles jammed at the interface, and the resulting structure was approximately steady. Black and white images with an effective resolution of ≈23 nm were generated directly from the simulation data to identify the two fluid phases.
2.4 Image analysis
The 3D data was analyzed using Avizo (FEI Group). An appropriate pixel value threshold was chosen to allow the software to generate an isosurface via the ‘Isosurface’ module, which represents the interface between the two liquid domains. The isosurface was ‘downsampled’ (averaged) over a volume of 3 × 3 × 3 pixels to reduce the impact of noise. This produced a more accurate isosurface in terms of its resemblance to the original bijel (see ESI‡ for an example), as well as reducing the occurrence of surface discontinuities (regions of non-manifold topological structure) on which the measurement of curvature becomes invalid.The software was then instructed to extract the distribution of mean  and Gaussian (K = κ1κ2) curvatures – κ1 and κ2 are the principal curvatures (κi = ±1/Ri, where Ri are the radii of curvature) at each vertex on the triangulated isosurface. The software achieves this by approximating the isosurface locally (a region spanning 4 orders of connecting vertices in all directions, covering an area of the order 10 μm2 in a confocal data stack) in quadric form, then computing the eigenvalues and eigenvectors (the eigenvalues being the principal radii of curvature). This function is contained within the ‘Compute curvatures’ module. The computed curvatures were also averaged over a region spanning 5 orders of adjacent vertices, which reduced the impact of noise further. These specific settings were chosen because they produced the results closest to that expected for our benchmark structure: a simulated gyroid with a similar lengthscale as our bijels in a data volume similar to our confocal stacks – see Section 2.6.
Since H and K will naturally vary with the characteristic lengthscale of the structure19 (smaller lengthscales necessitate larger curvatures) it is necessary to normalize these quantities. This can be done simply by multiplying by the inverse or inverse-square of the surface-to-volume ratio (Σ = A/V), which can also be extracted using the software. The reduced dimensionless quantities are therefore HΣ−1 and KΣ−2.
To reduce the potential impact of artefacts during the software's reconstruction of the bijel interface (i.e. regions of abnormally large curvature) only curvature values in a certain range were used to calculate the area-averaged quantities. This range was chosen to be around the expected curvatures as derived from the measurement of L, i.e. |Hexpected| ≈ 2/L and |Kexpected| ≈ 4/L2. Once the curvature distributions were truncated in this way (resulting in a loss of no more than 5% of the total data), the values were summed to give 〈H〉Σ−1 and 〈K〉Σ−2. Note that this is not the strict calculation of the integral of H or K over the surface required to apply the Gauss–Bonnet theorem,18 but rather the sum of a discrete series of values, without each value being weighted by the area over which the curvature was measured. However, these values still serve as a (scaled) metric to quantify the bijel structure, since it is still sensitive to changes in the distributions. For a bijel, we expect a structure with overall hyperbolic character, 〈H〉Σ−1 ≈ 0, and 〈K〉Σ−2 < 0, although 〈H〉Σ−1 may take a finite value close to zero if the volume ratio between the two phases is not 50:50,19 as is the case in the W/L system employed here28 (see Fig. 2).
An alternative way to probe bicontinuity in our structures, using the same 3D data stacks, relies on an image segmentation method known as ‘region growing’. 3D X-ray CT data stacks were opened in ImageJ (version 1.49v),30 thresholded, and region growing was performed on channel A (high pixel values) using the ImageJ ‘Find Connected Regions’ plugin, with the following settings: diagonal connections not allowed and start from point selection. This procedure was repeated after inverting the image stack to perform region growing on channel B (originally low pixel values). The number of pixels not connected to the grown region was calculated by subtracting the grown region from the thresholded original and extracting the mean grayvalue of the difference stack.
2.5 Errors
Sampling errors have been accounted for by averaging each measurement over three uniquely prepared samples with identical procedures, although in some cases the bijel lengthscales were different. Note that this also means that our results are unlikely to be significantly affected by small wetting differences between batches of dried particles. Where repeat sampling was not feasible (e.g. not enough identical material being available) the threshold value was varied around that which gave the maximum area, and an average of those curvature values taken. Hence, the error bars on these data points represent the thresholding error in the measurement of one sample. It will be made clear in the text which data points have been multiply sampled and which have not. Further discussion of errors, including the fishtank effect, is contained within the ESI.‡2.6 Benchmarking
 | (3) |
 | ||
| Fig. 4 Isosurfaces computed for benchmark structures: system of spheres (a) and a gyroid (b). Matlab was used to numerically generate these structures (see text for details). | ||
Table 1 shows the expected (E) and measured (M) values, along with the relative error (Err). We concluded from the test results that we could use our analysis technique to accurately measure bijel topology. We also explored the possible dependence of the accuracy on λ at fixed box size but found that within the range of L actually studied (in terms of bijels) this is not a concern (see ESI‡).
| Test | 〈H〉Σ−1E/M/Err | 〈K〉Σ−2E/M/Err |
|---|---|---|
| Spheres, r = 32 pixels | 5.05/4.78/5.3% | 25.5/22.9/10% |
| Gyroid, λ = 128 pixels | 0/0.00/0% | −1.7/−1.66/2.4% |
A comparison of the analyses of both types of data is presented in Section 3.1.
3 Results and discussion
3.1 Confocal vs. X-ray CT
Here we compare the analysis of data obtained from confocal microscopy (of a 63 nm NP stabilized bijel) and that obtained from X-ray CT (of a polymerized 63 nm NP stabilized bijel). Fig. 5 shows example isosurfaces and distributions of mean and Gaussian curvatures. Since the X-ray method allows the sampling of much larger volumes than confocal, the isosurfaces created are much larger in area (Fig. 5(a) vs. (b)). This allows the measurement of curvature over a larger number of bijel channels, increasing the accuracy. The increased precision, evidenced by the sharper distributions in (c) and (d), is due to the sharper contrast between the channels, as the confocal data suffers the consequences of the point-spread function and multiple scattering, whereas the X-ray data does not. Although the distributions are sharper, the shape and position of the distributions are qualitatively similar, and produce similar quantities: area-averaged mean curvature 〈H〉Σ−1 = −0.02(1) and area-averaged Gaussian curvature 〈K〉Σ−2 = −0.8(1) in the case of the confocal data, and 〈H〉Σ−1 = 0.002(5) and 〈K〉Σ−2 = −0.45(1) in the case of the X-ray data. Note that although the Gaussian curvature distributions appear to be peaked close to zero, most of the area is in the negative region, leading to a significant negative value for the area-averaged quantity. This has been observed in previous studies of polymer blends.17,32 We have also measured the curvature distributions of a MP stabilized bijel before and after polymerization using the same method (confocal) to show that the polymerization process itself does not drastically alter the structure and that the area-averaged curvature values do not significantly change (see ESI‡). Polymerizing bijel samples does involve a 4 to 5 hour waiting step, to allow the monomer to distribute throughout the sample, which may have an effect on the area-averaged Gaussian curvature values (see Section 3.4). | ||
| Fig. 5 Example data used in the curvature analysis. (a) Isosurface created using X-ray CT data. (b) Isosurface created using confocal data. (c) Mean curvature distributions for both isosurfaces. (d) Gaussian curvature distributions for both isosurfaces. The distributions were normalized by dividing the raw counts by total number of counts. | ||
A comparison of the curvature distributions of a bijel and its polymerized counterpart has been made previously,13 showing 〈H〉 ≈ 0 in both cases (but with a small broadening in the negative region for the polymer) and 〈K〉 < 0 in both cases (but with a small shift towards less negative values in the polymerized case). The results presented in this study are in broad agreement with the results of Lee et al., with both mean curvatures close to zero and a less negative value for the Gaussian curvature of the polymerized sample. In Lee & Mohraz's case, the difference in Gaussian curvature for the polymerized sample cannot be unequivocally explained by the polymerization process however, as the samples were prepared independently.
Note that these results suggest that the bijel structure (both in liquid and polymerized form) is bicontinuous in three dimensions, given the negative values of area-averaged Gaussian curvature and almost zero values of area-averaged mean curvature. To further demonstrate the bicontinuity of the bijel structure, we have performed a region-growing analysis on the X-ray CT data. Fig. 6 shows bottom and top slices from a 3D X-ray CT data set, both in direct (channel A white) and inverted (channel B white) grayscale. Selecting a pixel in the white channel in the lower left corner of the bottom slice (see arrows in Fig. 6(a) and (e)), we use ‘region growing’ to show that it is connected to the pixels in the white channel in the top slice (Fig. 6(d) and (h)). This qualitatively demonstrates that both channel A and channel B are continuous and, thereby confirming that our bijel samples are indeed bicontinuous. As a quantitative measure, the total number of pixels in channel A (in 3D) above the threshold but not connected to the initial point in (a) is only 0.03%.
 | ||
| Fig. 6 2D slices from a 3D X-ray CT data set: (a–d) direct i.e. channel A is white and (e–h) inverted i.e. channel B is white. (a and e) Slice at bottom of 3D data set: The yellow/red arrow points to the initial yellow/red point before region growing of channel A and B. (b and f) Same as (a and e) but after region growing, showing in red all the points above the threshold connected to the initial point in (a and e). (c and g) Slice at top of 3D data set and (d and h) same as (c and g) but after region growing, showing in red all the points above the threshold connected to the initial point in (a and e). | ||
Notably, the fact that we get acceptably similar results when we use the method with a lower signal-to-noise ratio (confocal) allows us to use this in situ characterization technique to study the effect of particle size and quench rate on bijel topology.
3.2 Effect of particle size
We now focus on data obtained from confocal microscopy, and vary the size of the particles used to stabilize the bijel, while keeping the quench rate constant at 350 °C min−1 (microwave method). In this section, the bijel lengthscales were in the range 31 μm < L < 91 μm.Fig. 7 shows how the area-averaged curvatures vary with particle size, including a measurement of simulated data (red point) which we address later. The data corresponding to r = 63 and 367 nm has been averaged over three uniquely prepared samples, whereas the data for r = 50 nm (and the simulated data) has only been sampled once – hence, the error bars for the former indicate one standard deviation, and the error bars for the latter indicate the thresholding uncertainty.
 | ||
| Fig. 7 The change in area-averaged mean curvature (a) and Gaussian curvature (b) as a function of particle size. The red data points are measurements performed on simulated data (see text). The error bars for the two right-most black squares indicate one standard deviation of the distribution of 3 separate measurements, whereas for the left-most point (and the red point) the error bars indicate the thresholding error from one unique measurement. | ||
The area-averaged mean curvatures of the (final) bijel structures show a small dependence on particle size, with a significant positive value for the MP bijel and smaller positive values for the NPs. This does not contradict the results of Lee et al. since an inspection of the histograms reveals that all distributions are centred on zero (see ESI‡). These results are indicative of a stronger preferred direction of curvature for the MP bijel and a weaker preferred direction for the NP bijels. Indeed, since this bijel system has unequal phase volumes we would expect a preferred direction of curvature.17
The area-averaged Gaussian curvatures show a clearer dependence on particle size – the smaller the particle, the more negative the value. In other words, as the size of the stabilizing particles is decreased, the bijel becomes more hyperbolic in character, and more closely resembles the gyroid.
These results can be partly explained by considering the following. The batch of particles used in the bijel mixture will have a distribution of contact angles centred close to the desired 90°,33 and the particles with θ ≠ 90° will induce a spontaneous curvature on the L–L interface.21 Although NPs will induce a larger spontaneous curvature than MPs, the driving force towards this curvature is smaller.15 Hence, it is expected that NPs are less disruptive to the L–L interface than MPs, and hence more likely to lock-in the spinodal structure of the L–L phase separation. The data presented here is largely in agreement with this. The relative lack of preferred curvature direction for the NP stabilized bijels is consistent with the picture of the NPs being more successful at preventing pinch-off events, resulting in a larger number of (hyperbolic) fluid necks rather than (parabolic) bulging regions which would exist immediately after pinch-off.
To assess how closely the bijels resemble the L–L interface without particles we refer to previous work on a mixture of polybutadiene and poly(styrene-ran-butadiene) undergoing spinodal decomposition.29 By using their measured data for the quantities Σ/qm = 0.5 (where qm is the position of the peak in the Fourier intensity spectrum, i.e. after the 3D image data has been transformed into frequency space) and 〈R〉/L = 0.3 (where 〈R〉 is the average radius of curvature), we have calculated a value of 〈K〉Σ−2 ≈ −1.13. Note that this is significantly different from the gyroid, but since the gyroid is a minimal surface (H = 0 everywhere) it may be better at quantitatively describing equilibrium structures rather than the non-equilibrium structures reported here, for which we and others see a distribution of H centred on 0.13,23 Also, there are differences between the system studied here and the system studied by Jinnai et al., namely the ratio of interfacial tension to viscosity, so the calculated value is only an estimation. However, it can still be concluded that the NPs lock-in structures with greater hyperbolic character which more closely resemble the L–L spinodal interface.
To assess how closely the bijels resemble simulated spinodal decomposition in the presence of neutrally-wetting particles, we performed our curvature analysis on data obtained from lattice-Boltzmann simulations. The results are shown as the red data points in Fig. 7. The area-averaged mean curvature has a value of 0.42(3) and the area-averaged Gaussian curvature has a value of −0.95(4). To achieve practical computation times, the simulated particle radius was 63 nm, but the bijel lengthscale L = 500 nm was considerably smaller than in experiments (L/r ≈ 10 as opposed to ≈100–1000 in experiments). We attribute the positive mean curvature to the phase volume asymmetry (simulated as 65:35) as we do in the experimental case outlined above. The simulated Gaussian curvature is significantly below the corresponding experimental value but is very close to the experimental value for r = 50 nm and only slightly above the estimate for the L–L spinodal interface without particles (−1.13). This discrepancy between the 〈K〉Σ−2 values obtained from experimental and simulated data is likely due to the distribution of contact angles (centred on ≈90°) present in the experimental case, which more drastically effects MP stabilized bijels as per our previous discussion (resulting in less negative Gaussian curvature) and suggests that the particles might be making the L–L interface less hyperbolic.15 Another potential factor is the instantaneous quench used in the simulations which cannot be achieved in experiments. Nonetheless, we can conclude that the use of NPs results in structures of greater hyperbolicity which more closely resemble the expected spinodal pattern of a bijel.
From the point of view of applications, we now have a quantitative characterization of bijel topology that allows rational optimization of fabrication parameters. For example, if one wanted to design a symmetric cross-flow microreactor from a bijel, then a hyperbolic rather than a parabolic surface would be desirable (to reduce the occurrence of bottlenecks and/or dead-ends), and our analysis shows that using smaller particles would be beneficial. To further demonstrate this approach to bijel-materials design, we continue by considering two additional bijel fabrication parameters: quench rate and age (i.e. time after bijel formation).
3.3 Effect of quench rate
Here we continue to focus on confocal microscopy data, but now vary the quench rate used in the fabrication step (see Experimental methods). Note that in the bijel literature, the term ‘quench’ can refer to either cooling (in the case of an upper critical solution temperature, UCST) or heating (in the current case of a lower critical solution temperature, LCST). Fig. 8 shows how the area-averaged curvatures vary with quench rate, with the 350 °C min−1 data points being the same as shown in Fig. 7 but on new axes. The 50 nm data and the 1 °C min−1 data has only been sampled once here. In this section, the bijel lengthscales were in the range 21 μm < L < 91 μm. | ||
| Fig. 8 The change in area-averaged mean curvature (a), Gaussian curvature (b) as a function of quench rate. The dashed line in (a) indicates the value expected for the gyroid. | ||
The area-averaged mean curvatures in the case of NP bijels remain constant upon the decrease to 17 °C min−1, but rise upon a further decrease to 1 °C min−1. The preferred direction indicated by this data point could either be due to the presence of droplets (of a size similar to the channel width) in slowly-quenched samples due to secondary nucleation34 or due to the same mechanism which results in the preferred direction in (fast quenched) MP bijels. The area-averaged Gaussian curvatures show a slight variation with quench rate, becoming less hyperbolic as the quench rate is reduced. Interestingly, it appears that quenching the 63 nm particle bijel at 1 °C min−1 yields a structure similar to a 367 nm particle bijel, quenched at 350 °C min−1.
To explore why this might be the case, we explain the effect of quench rate on the phase separation dynamics. In the current case of spinodal decomposition, we assume that the relevant phase-separation regime is the ‘viscous hydrodynamic’ one (based on estimates of the timescale of the crossover between the diffusive and viscous hydrodynamic regimes).35 In this regime, the characteristic lengthscale of the structure scales with time according to  , where γ is the interfacial tension and η the fluid viscosity; γ scales with the quench depth as ΔT0.88, which itself scales with time according to the quench rate used (ΔT = βt, where β is the quench rate, and t = 0 when the temperature reaches 34.1 °C). η shows some variation in the relevant temperature range but for the purposes of this illustration can be approximated as constant.28 Hence, varying the quench rate changes the prefactor in the growth law, which is akin to saying that it changes the phase separation ‘speed’, with faster quenches resulting in higher speeds, which may help in two ways. Firstly, the particles will have less time to accumulate a wetting layer of lutidine, which can affect their contact angle.25 Secondly, the system spends less time in a state where the particles on the interface can interact, because the interfacial particles reach a jammed state quicker, and this may well allow the particles to better lock in the spinodal structure.15
Previous work with the W/L bijel has shown that only certain particle size and quench rate combinations successfully produce bijels15 – the fastest rates are required to form bijels with MPs, but NPs can form bijels at any rate in the range 1 to 350 °C min−1. If we conclude that reducing the quench rate results in a final bijel structure of reduced hyperbolic character, then by applying that reasoning to the 367 nm data point in Fig. 8(b) we can further illustrate why successful bijel formation with MPs at slower rates is unlikely. When the area-averaged Gaussian curvature gets closer to the region 〈K〉Σ−2 ≥ 0, it becomes more and more like a standard Pickering emulsion with increasing amounts of interfacial area curved in the same direction (i.e. droplet morphology), which has been observed previously. Hence, we can argue that bijel formation will succeed only when the combination of particle size and quench rate results in a (final) structure with sufficiently negative area-averaged Gaussian curvature, and we now know (approximately) what the sufficient value is, and what the range of required parameters is.
3.4 Curvature change with time
Fig. 9 shows the area-averaged Gaussian curvatures as a function of time from the onset of phase separation, for three uniquely-prepared (by quenching at 350 °C min−1) samples of (a) MP stabilized bijels and (b) (two unique) NP stabilized bijels along with one sample of a bijel made with a different liquid–liquid combination (and MPs of radius r = 290 nm), nitromethane/ethanediol (NM/ED).36 The data points in the dashed box in (a) were the ones averaged to create the 367 nm 350 °C min−1 data point shown in Fig. 7(b) and 8(b), as these were the points closest together on the time axis. In all cases, the values plotted are obtained from the maximum-isosurface area reconstructions, and the error bars are ±2.4%. | ||
| Fig. 9 (a) The change in area-averaged Gaussian curvature as a function of time for three separately prepared MP bijels (black, red and blue, ϕ = 2.8%). The data points in the dashed box are the ones used to generate the MP 350 °C min−1 data point in Fig. 7 and 8. (b) The change in area-averaged Gaussian curvature as a function of time for 2 NP bijels (black and red, ϕ = 0.7% and 1.0% respectively) and a MP nitromethane/ethanediol bijel (blue, see text for details). Error bars are ±2.4%, the error derived from the analysis test in Section 2.6. | ||
In the MP W/L case (Fig. 9(a)), there is a marked upward movement of the Gaussian curvature in each timeseries, with the final points in all timeseries at least a full error bar above the initial points. In the NP W/L or the MP NM/ED case however (Fig. 9(b)), there is no such upward trend, and arguably a downward trend in the case of the NP W/L bijels (red and black). Note that the black and red NP data represent different concentrations of particles and have different absolute values of 〈K〉Σ−2, but this is most likely due to experimental variation given the spread in absolute values shown in Fig. 9(a) for three identical repeats. It is also interesting to note that the MP bijels begin their ‘life’ with a structure not too dissimilar from the NP bijels, but mutate over the course of about an hour to end up with a less hyperbolic, sub-optimal structure, which may also explain the less negative 〈K〉Σ−2 from X-ray CT data in Section 3.1 (as polymerizing samples requires a 4 to 5 h waiting period).
This phenomena is quite unexpected as all of these samples are considered to be in their ‘jammed’ state. Since the area-averaged Gaussian curvature values have been normalized with respect to the surface-to-volume ratio (A/V), such movement cannot be attributed to any slight reduction in (A/V), i.e. coarsening (which there is, see the ESI‡). Nor can it be related to a change in genus (and therefore pinch-off events) due to the inability to invoke the Gauss–Bonnet theorem (see Experimental methods). Therefore, the movement in Gaussian curvature towards zero indicates a change in the curvature distributions, which we call mutation.
The movement in Gaussian curvature in the case of MPs can be related with the time over which the elastic modulus of the W/L bijel has been measured to increase,14 which can further be associated with the phenomenon of monogelation – the emergence of a permanently-bonded particle network which can survive the remixing of the liquids.22 We observe that a NP-bijel also forms a monogel, but crucially, only requires an incubation period of <1 min (data not shown here). The NM/ED bijel does not form a monogel.14 Hence, it is possible that the process of gelation of particles at the L–L interface leads to a mutation of the bijel structure.
In an attempt to ascertain whether the mutation is a global (happens equally everywhere) or local (happens at only specific locations) phenomenon, we have mapped the Gaussian curvature values onto the reconstructed isosurface and compared the 20 min and 60 min-old bijels from the blue timeseries in Fig. 9(a), shown in Fig. 10. We have thresholded the values so that only positive values appear bright (with varying degrees of brightness), while the black spots are at zero or less.
 | ||
| Fig. 10 A comparison of the isosurfaces representing a 20 minute old bijel and a 60 minute old bijel, stabilized by MPs. The black areas have Gaussian curvature values less than zero, whereas the bright areas have positive Gaussian curvature, to varying degrees indicated by the brightness. | ||
What we see in Fig. 10 are subtle differences in the locations of positive Gaussian curvature, and larger bright spots in the 60 min old sample compared to the 20 min old sample. The changes are so small that it is difficult to say whether there are specific regions which change more than others, but by comparing the curvature distributions we see that most of the changes occur around the 〈K〉Σ−2 = 0 line (see ESI‡). The entirety of these small changes in the curvature distributions is what changes the metric 〈K〉Σ−2. The precise mechanism behind the mutation will need to be confirmed by further study.
4 Conclusions
In this paper, we have performed an extensive characterization of the topology of bijels produced using different particle sizes and quench rates, and monitored the structures over time. In addition, we have demonstrated that bijels are bicontinuous using an image-analysis technique known as ‘region growing’. Optimally hyperbolic (large negative Gaussian curvature) structures are obtained when smaller particles and faster quench rates are used. Nanospheres appear to be better than microspheres at locking in the spinodal pattern of the L–L interface during demixing. Microparticle stabilized bijels appear to mutate away from an optimal structure, which may be related to the monogelation phenomenon.22 Nanoparticle stabilized bijels, which form a monogel on much shorter timescales, become marginally more hyperbolic over time, and a non-monogelling system (nitromethane/ethanediol) shows no such mutation. In practical terms, we now have a characterization which enables us to systematically optimize the morphology of (final-state) bijels, which will assist in its development for applications.Acknowledgements
M. R. is grateful to EPSRC for funding his PhD studentship. J. H. J. T. acknowledges the Royal Society Research Grant, and the University of Edinburgh for support through the Chancellor's Fellowship. This work has been financially supported by EPSRC grant number EP/J007404. The authors would like to thank Rob Wallace for assistance with X-ray CT data acquisition, Andrew Schofield for help with particle synthesis, Katherine Rumble for the preparation of NM/ED bijels and Mike Cates, Aidan Brown, Joe Tavacoli and Michiel Hermes for useful discussions.References
- K. Stratford, R. Adhikari, I. Pagonabarraga, J.-C. Desplat and M. E. Cates, Science, 2005, 309, 2198–2201 CrossRef CAS PubMed.
- M. E. Cates and P. S. Clegg, Soft Matter, 2008, 4, 2132–2138 RSC.
- H. Firoozmand and D. Rousseau, Food Hydrocolloids, 2015, 48, 208–212 CrossRef CAS.
- M. Cui, T. Emrick and T. P. Russell, Science, 2013, 342, 460–463 CrossRef CAS PubMed.
- L. Bai, J. W. Fruehwirth, X. Cheng and C. W. Macosko, Soft Matter, 2015, 11, 5282–5293 RSC.
- M. F. Haase, K. J. Stebe and D. Lee, Adv. Mater., 2015, 27, 7065–7071 CrossRef CAS PubMed.
- J. W. Tavacoli, J. H. J. Thijssen and P. S. Clegg, Particle-Stabilized Emulsions and Colloids: Formation and Applications, The Royal Society of Chemistry, Cambridge, 2015, pp. 129–168 Search PubMed.
- E. M. Herzig, K. A. White, A. B. Schofield, W. C. K. Poon and P. S. Clegg, Nat. Mater., 2007, 6, 966–971 CrossRef CAS PubMed.
- R. Aveyard, B. P. Binks and J. H. Clint, Adv. Colloid Interface Sci., 2003, 100–102, 503–546 CrossRef CAS.
- M. Martina, G. Subramanyam, J. C. Weaver, D. W. Hutmacher, D. E. Morse and S. Valiyaveettil, Biomaterials, 2005, 26, 5609–5616 CrossRef CAS PubMed.
- I.-K. Sung, M. Mitchell, D.-P. Kim and P. J. A. Kenis, Adv. Funct. Mater., 2005, 15, 1336–1342 CrossRef CAS.
- N. Tanaka, H. Kobayashi, N. Ishizuka, H. Minakuchi, K. Nakanishi, K. Hosoya and T. Ikegami, J. Chromatogr. A, 2002, 965, 35–49 CrossRef CAS.
- M. N. Lee and A. Mohraz, Adv. Mater., 2010, 22, 4836–4841 CrossRef CAS PubMed.
- M. N. Lee, J. H. J. Thijssen, J. A. Witt, P. S. Clegg and A. Mohraz, Adv. Funct. Mater., 2013, 23, 417–423 CrossRef CAS.
- M. Reeves, A. T. Brown, A. B. Schofield, M. E. Cates and J. H. J. Thijssen, Phys. Rev. E: Stat., Nonlinear, Soft Matter Phys., 2015, 92, 032308 CrossRef CAS PubMed.
- T. Hashimoto, M. Itakura and H. Hasegawa, J. Chem. Phys., 1986, 85, 6118–6128 CrossRef CAS.
- H. Jinnai, T. Kajihara, H. Watashiba, Y. Nishikawa and R. Spontak, Phys. Rev. E: Stat., Nonlinear, Soft Matter Phys., 2001, 64, 010803 CrossRef CAS PubMed.
- S. Hyde, B. W. Ninham, S. Andersson, K. Larsson, T. Landh, Z. Blum and S. Lidin, The Language of Shape, Elsevier, Amsterdam, 1997, pp. 1–42 Search PubMed.
- S. T. Hyde, Langmuir, 1997, 13, 842–851 CrossRef CAS.
- T.-l. Cheng and Y. U. Wang, J. Colloid Interface Sci., 2013, 402, 267–278 CrossRef CAS PubMed.
- P. A. Kralchevsky, I. B. Ivanov, K. P. Ananthapadmanabhan and A. Lips, Langmuir, 2005, 21, 50–63 CrossRef CAS PubMed.
- E. Sanz, K. A. White, P. S. Clegg and M. E. Cates, Phys. Rev. Lett., 2009, 103, 255502 CrossRef PubMed.
- Y. Nishikawa, H. Jinnai, T. Koga, T. Hashimoto and S. T. Hyde, Langmuir, 1998, 14, 1242–1249 CrossRef CAS.
- H. Saito, M. Yoshinaga, T. Mihara, T. Nishi and H. Jinnai, J. Phys.: Conf. Ser., 2009, 184, 012029 CrossRef.
- K. A. White, A. B. Schofield, B. P. Binks and P. S. Clegg, J. Phys.: Condens. Matter, 2008, 20, 494223 CrossRef.
- K. A. White, A. B. Schofield, P. Wormald, J. W. Tavacoli, B. P. Binks and P. S. Clegg, J. Colloid Interface Sci., 2011, 359, 126–135 CrossRef CAS PubMed.
- L. Zhuravlev, Colloids Surf., A, 2000, 173, 1–38 CrossRef CAS.
- C. A. Grattoni, R. A. Dawe, C. Y. Seah and J. D. Gray, J. Chem. Eng. Data, 1993, 38, 516–519 CrossRef CAS.
- H. Jinnai, T. Koga, Y. Nishikawa, T. Hashimoto and S. Hyde, Phys. Rev. Lett., 1997, 78, 2248–2251 CrossRef CAS.
- W. S. Rasband, ImageJ, U. S. National Institutes of Health, Bethesda, Maryland, USA, 1997–2015, http://imagej.nih.gov/ij/ Search PubMed.
- Y. Matsushita, J. Suzuki and M. Seki, Phys. B, 1998, 248, 238–242 CrossRef CAS.
- H. Jinnai, Y. Nishikawa, R. Spontak, S. Smith, D. Agard and T. Hashimoto, Phys. Rev. Lett., 2000, 84, 518–521 CrossRef CAS PubMed.
- L. Isa, F. Lucas, R. Wepf and E. Reimhult, Nat. Commun., 2011, 2, 438 CrossRef PubMed.
- J. A. Witt, D. R. Mumm and A. Mohraz, Soft Matter, 2013, 9, 6773–6780 RSC.
- I. Pagonabarraga, J. C. Desplat, A. J. Wagner and M. E. Cates, New J. Phys., 2001, 3, 9.1–9.18 CrossRef.
- J. W. Tavacoli, J. H. J. Thijssen, A. B. Schofield and P. S. Clegg, Adv. Funct. Mater., 2011, 21, 2020–2027 CrossRef CAS.
Footnotes |
| † The data corresponding to this paper are available online through Edinburgh DataShare at http://dx.doi.org/10.7488/ds/1360 |
| ‡ Electronic supplementary information (ESI) available. See DOI: 10.1039/c5sm03102h |
| This journal is © The Royal Society of Chemistry 2016 |