 Open Access Article
Supramolecular polymerisation in water; elucidating the role of hydrophobic and hydrogen-bond interactions†
Christianus M. A.
Leenders
,
Matthew B.
Baker
,
Imke A. B.
Pijpers
,
René P. M.
Lafleur
,
Lorenzo
Albertazzi
,
Anja R. A.
Palmans
* and
E. W.
Meijer
*
Institute for Complex Molecular Systems, Eindhoven University of Technology, P.O. Box 513, 5600 MB Eindhoven, The Netherlands. E-mail: A.Palmans@tue.nl; E.W.Meijer@tue.nl
First published on 11th February 2016
Abstract
Understanding the self-assembly of small molecules in water is crucial for the development of responsive, biocompatible soft materials. Here, a family of benzene-1,3,5-tricarboxamide (BTA) derivatives that comprise a BTA moiety connected to an amphiphilic chain is synthesised with the aim to elucidate the role of hydrophobic and hydrogen-bonding interactions in the self-assembly of these BTAs. The amphiphilic chain consists of an alkyl chain with a length of 10, 11, or 12 methylene units, connected to a tetraethylene glycol (at the periphery). The results show that an undecyl spacer is the minimum length required for these BTAs to self-assemble into supramolecular polymers. Interestingly, exchange studies reveal only minor differences in exchange rates between BTAs containing undecyl or dodecyl spacers. Additionally, IR spectroscopy provides the first experimental evidence that hydrogen-bonding is operative and contributes to the stabilisation of the supramolecular polymers in water.
Introduction
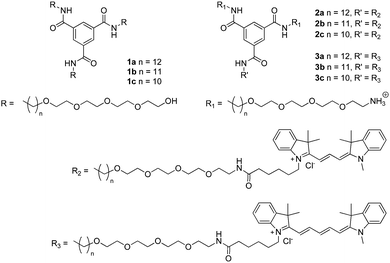
Self-assembling systems in aqueous solution1–5 and low molecular weight (LMW) hydrogelators6–10 that display dynamic and responsive behaviour have great potential as scaffolds in biomedical applications. For the development of such systems it is important to thoroughly understand the self-assembly process. In particular, it is important to understand the role of the different non-covalent interactions, as water molecules compete with hydrogen-bonding motifs and solvophobic effects are particularly strong in water. In linear (non-ionic) amphiphiles, the role of hydrophobic domain size in micelle formation has been extensively studied, and a direct correlation has been found between the length of the hydrophobic domain and the critical micelle concentration (CMC).11–16 Predicting the self-assembly properties of molecules relying on more than amphiphilicity is difficult, let alone predicting the exchange dynamics of monomers between aggregates. Nevertheless, examples of aqueous self-assembly that combine hydrophobic effects with π–π stacking17–22 or make use of directional hydrogen bonds to drive self-assembly have been reported.23–31 To further develop general design rules for aqueous self-assembly, studies are needed which relate systematic modifications of the molecular structure to the self-assembly behaviour and exchange dynamics.In the last two decades, our group and others have studied the aggregation and phase behaviour of N,N′,N′′-trialkyl-benzene-1,3,5-tricarboxamides (BTAs) in great detail.32 The simple and synthetically accessible structure of the BTA moiety allowed the establishment of structure/property relationships for bulk materials,33–38 and unravelling of the mechanism and dynamics of BTA self-assembly in dilute solution.39,40 In apolar organic media, the self-assembly of the alkyl-BTAs is dominated by cooperative hydrogen-bond formation, which results in supramolecular polymers that are stabilised by a triple helical array of hydrogen bonds.40,41 Recently, we redesigned the BTAs to self-assemble in water, by conjugating either water-soluble metal complexes28 or tetraethylene glycol42 (compound 1a, Scheme 1) to their periphery. Detailed studies, both experimentally as well as computationally, on amphiphilic BTA 1a have been conducted. The dodecyl chains of 1a were sufficiently hydrophobic to induce aggregation while the hydrophilic ethylene glycols at the periphery ensured compatibility of the aggregates with water. With microscopic techniques, long and dynamic supramolecular polymers of high aspect ratio were observed, and the mechanism and time-scale of exchange of monomers between different polymers was elucidated.43,44 Furthermore, computational studies supported that the supramolecular polymers formed by 1a were stabilised by hydrogen-bond formation.45
Here, we vary the length of the aliphatic spacer from a dodecyl (1a) to an undecyl (1b), to a decyl spacer (1c), respectively, to systematically study the effect of the hydrophobic/hydrophilic ratio and to establish which length suffices to induce supramolecular polymer formation of the amphiphilic BTAs. Throughout this series, the tetraethylene glycol unit is kept constant and the end group of the glycol motif is a free alcohol function. This free alcohol provides superior water solubility compared to a methoxy end-group46 and allows for synthetic functionalisation, although its use requires protecting group chemistry. Importantly, this study aims to verify experimentally whether intermolecular hydrogen bonds stabilising the supramolecular polymers are present in water. In addition, we want to understand how the length of the alkyl chain affects the time scale of monomer exchange between the assemblies formed. To this end, the BTAs were labelled with either Cy3 dye (compounds 2a–c) or Cy5 dye (compounds 3a–c). These dyes allow the characterisation of the formed assemblies with fluorescence spectroscopy and microscopy.
Results
Design, synthesis and characterisation in the solid state
The synthesis of 1a has been reported elsewhere,42 and 1b and 1c were obtained through an analogous synthetic approach. BTAs 1b and 1c were obtained in high purity as an off-white waxy solid and colourless oil, respectively, and were fully characterised by 1H NMR, 13C NMR and IR spectroscopy and MALDI-TOF-MS (ESI†). Dye-labelled BTAs 2a–c and 3a–c (Scheme 1) were conveniently prepared from 1a–c through a series of high-yielding transformations, followed by separation using preparative HPLC to give the singly-dye-labelled BTAs in high purity (see ESI† for detailed synthesis).45FT-IR spectroscopy has been used to identify threefold intermolecular hydrogen bonding in BTA assemblies, both in the solid state and in solution in organic solvents.40,47 In the bulk, BTA 1a displays vibrations for the N–H stretch, amide I, and amide II typical for threefold intermolecular hydrogen bonding (Fig. 1). The FT-IR spectrum of 1b displays three different frequencies for the N–H stretch (Fig. 1A), two frequencies for the amide I, and one frequency for the amide II vibration (Fig. 1B). This either suggests partial ordering or the presence of more than one type of packing. For 1c, only frequencies typical for the absence of hydrogen bonds are observed (Fig. 1), similar to 1a and 1b at elevated temperature (Fig. S1 and S2, ESI†). We attribute the loss of hydrogen bonds in the bulk of 1c to backfolding of the oligo(ethyleneglycol) side chains that interfere with the intermolecular amide hydrogen bonding.48
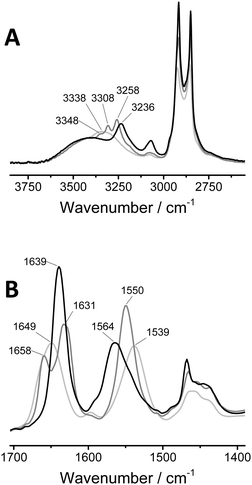 | ||
| Fig. 1 FT-IR spectra of 1a (black curve), 1b (grey curve), and 1c (light grey curve) in the solid state at 25 °C. (A) Zoom of the N–H vibration region. (B) Zoom of the amide I and amide II region. | ||
Self-assembly of 1a–c in aqueous solution
Previously, cryoTEM has been employed to visualise the supramolecular polymers formed by 1a.42 Similarly, cryoTEM reveals fibrillar assemblies of 1b (Fig. 2A, dark spheres are domains of crystallised ice). Although the contrast of the cryoTEM image is low (a digitally enhanced image is shown in Fig. S4, ESI†), 1b forms supramolecular polymers with lengths in the order of micrometres and a diameter of below 10 nm. These aspect ratios are comparable to those previously found for 1a. In contrast, no aggregates could be observed for 1c. Light scattering measurements were in line with these findings; the correlation functions of 1a and 1b show a nearly identical correlation time with comparable count rates, while the very low count rate recorded for 1c is illustrative for the low tendency of 1c to self-assemble (Fig. S4, ESI†).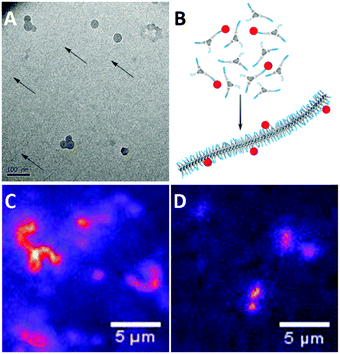 | ||
| Fig. 2 (A) CryoTEM image of 1b (0.5 mg mL−1) in H2O revealing the presence of supramolecular polymers. (B) Schematic representation of mixing a small amount of dye labelled BTAs with unlabelled BTAs prior to injection into water, to allow the assembly of the BTAs into fluorescently labelled fibres. Snapshots from movies taken during fluorescence microscopy (samples were equilibrated at 1 × 10⁻⁵ M, and diluted to 1 × 10⁻⁶ M prior to imaging. See ESI† for sample preparation) show (C) fibres formed by 1a with 5% 3a and (D) fibres formed by 1b with 5% 3b with lengths close to the resolution limit. | ||
Next, we evaluated whether the aggregates could be visualised with fluorescence microscopy. To this end, we mixed small amounts of dye labelled BTAs 2a–c or 3a–c (5 mol%) with the parent BTA 1a–c, prior to assembly (Fig. 2B), following protocols we established previously.43–45 With this procedure, the dye labelled BTAs incorporate randomly into the formed aggregates, creating a fluorescently labelled structure. When imaging the solution, differences between the samples are observed. The snapshots from full movies (see ESI†) clearly show the presence of supramolecular polymers in samples of 1a (Fig. 2C). Because of the resolution limit (250 nm) the fibres appear much wider than those observed with cryoTEM. Samples of 1b also show the presence of elongated aggregates although these were more difficult to capture in a snapshot due to fast diffusion. (Fig. 2D). Furthermore, in line with cryoTEM, no resolved self-assembled structures of 1c were observed.
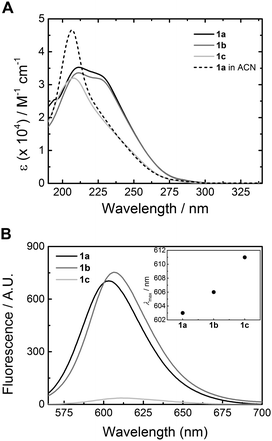
The self-assembly of 1a–c was evaluated in more detail by spectroscopy. UV spectroscopy and fluorescence spectroscopy using the dye Nile Red were applied to identify aggregate formation and the presence of a hydrophobic pocket, respectively. Solutions of 1a–c were prepared by injecting a small aliquot of a concentrated methanol solution into water to obtain the desired final concentration (5 × 10⁻⁵ M). In all cases, the solutions were optically transparent. Similar to previous results42 the UV spectrum of 1a at 20 °C shows two absorption bands at 211 and 226 nm (Fig. 3A), indicating aggregation. In acetonitrile, a solvent in which BTAs are molecularly dissolved,39 the absorption spectrum of 1a displays a maximum at 207 nm (Fig. 3A). The UV spectrum of 1b closely resembles that of 1a at 20 °C with two absorption maxima at 211 nm and 226 nm, respectively (Fig. 3A). In contrast, the UV spectrum of 1c shows only a single absorption maximum at 209 nm at 20 °C (Fig. 3A), similar to 1a in acetonitrile. This indicates that 1b does, but 1c does not self-assemble at this concentration and temperature in water.
The formation of a hydrophobic pocket upon self-assembly by 1a–c was probed using the solvatochromic dye Nile Red.49 In pure water, Nile Red shows low fluorescence intensity with λmax at 650 nm. In a more apolar environment, the fluorescence intensity increases and the λmax emission shifts to shorter wavelengths.10 Solutions of 1a–c were prepared by injection from methanol into water following the same procedure as described before (cBTA = 1 × 10⁻⁵ M), a concentrated solution of Nile Red in methanol (5 μL cNR = 2.5 × 10⁻³ M) was added (cNRfinal = 5 × 10⁻⁶ M), and the solutions were allowed to equilibrate. Compared to water (λmax = 647 nm, intensity 1.8 a.u.), the fluorescence emission intensity of Nile Red in solutions of 1a and 1b increases by two orders of magnitude. This is accompanied by a large blue-shift to λmax = 603 and 607 nm for 1a and 1b, respectively (Fig. 3B). On the other hand, the emission intensity of 1c is very low and the emission maximum is less blue-shifted (λmax = 612 nm). The intensity increase and similar shift in λmax in the solutions of 1a and 1b indicate aggregation and the formation of a hydrophobic pocket in both cases, while in the case of 1c no significant hydrophobic pocket is formed.
Hydrogen-bond formation in water probed by FT-IR spectroscopy
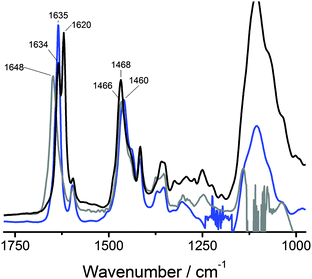
The above results show that BTAs 1a and 1b self-assemble into supramolecular polymers of high aspect ratio while 1c does not. This indicates that a critical hydrophobic spacer length of 11 methylenes is required for the formation of these supramolecular polymers. To investigate whether hydrogen bonds form between the BTAs in water, IR measurements were carried out. We selected D2O as the solvent instead of H2O since the O–H vibrations of water obscure the amide vibrations. Because of the increased mass of deuterium compared to hydrogen, the frequencies of the vibrations change. To assign the amide vibrations, we first investigated the deuterium-amide vibrations in bulk by exchanging all labile OH and NH protons of 1a with deuterium to afford 1a-d6. The bulk FT-IR spectrum of 1a-d6 recorded at 25 °C (Fig. 4, black curve, Fig. S3, ESI†) was compared to that of 1a (Fig. S1, ESI†). In addition, we measured the IR spectrum of 1a in MeOD (c = 50 mg mL−1), a solvent in which BTAs are molecularly dissolved and intermolecular hydrogen bonding is absent (Fig. 4, grey curve).In the bulk, the behaviour of 1a-d6 is similar to that of 1a (Fig. S1, ESI†). At 25 °C the N–D stretch vibration at 2363 cm−1 (Fig. S3, ESI†) is indicative for intermolecular hydrogen-bond formation. The amide I vibration at 25 °C is split up into two very sharp peaks at 1634 and 1620 cm−1, respectively, whereas the amide II vibration has shifted to 1468 cm−1. The origin of the split in the vibration at ∼1600 cm−1 for 1a-d6 is unclear at the moment and warrants more detailed investigations. The IR spectrum of 1a in MeOD shows an amide I vibration at a frequency of 1648 cm−1, a value indicative of the absence of intermolecular hydrogen bonds.
With these spectra as reference, the FT-IR spectrum of a solution of 1a in D2O (c = 50 mg mL−1) was measured (Fig. 4, blue curve). In D2O, the amide I gives a particularly sharp vibration at 1635 cm−1, which overlaps perfectly with one of the amide I vibrations observed in the bulk. This vibration – when compared to the amide I vibration at 1648 cm−1 in MeOD solution – clearly indicates the presence of intermolecular hydrogen bonds. The amide II vibration in D2O solution has a frequency of 1460 cm−1 and is more difficult to interpret. In the field of protein secondary structure determination by FT-IR spectroscopy, the amide I vibration is commonly considered to be highly informative while a correlation between the amide II vibration and the secondary structure is not well established due to its low sensitivity to the secondary structure.50–52 Furthermore, upon N-deuteration the amide II vibration overlaps with aliphatic CH2 vibrations53 and with the bending mode of HOD.54,55 This may cause the position of the amide II vibration to be different for 1a in the solid state compared to 1a-d6 in the solid state and the same position for 1a-d6 in the solid state and for 1a in D2O. Therefore, as is common in secondary structure determination of peptides, solely the amide I vibration is regarded informative for the presence of hydrogen bonds. As such, these results provide the first convincing experimental evidence for the presence of intermolecular hydrogen bonds stabilising BTA assemblies in water.
Thermal stability of supramolecular polymers in water
The thermal stability of the assemblies formed by 1a and 1b was assessed by variable temperature UV measurements (Fig. S5, ESI†). At 20 °C, the UV spectrum of 1a shows two absorption bands at 211 nm and 226 nm (Fig. 2A). Only after heating to above 50 °C the absorption spectrum changes, which finally results in an absorption band at 207 nm at 70 °C. Around this temperature the lower critical solution temperature (LCST) of 1a is reached. We hypothesise that at 70 °C the assemblies are disrupted but the molecularly dissolved state is not reached. Rather, small aggregates held together by the amphiphilic nature of the molecules and hydrophobicity resulting from the LCST are present. Similar to 1a, the UV spectrum of 1b is stable up to 50 °C. At 60 °C, the intensity around 226 nm significantly drops resulting in a single absorption maximum at 209 nm. This implies that the self-assembly of 1b is somewhat more sensitive to temperature than the self-assembly of 1a and indicates a somewhat lower stability of the assemblies. These observations are in line with the results of variable temperature IR measurements of 1a and 1b in the bulk, which show a higher thermal stability of the hydrogen bonds in 1a; in the bulk of 1a the hydrogen bonds are lost above 45 °C compared to 35 °C for 1b (Fig. S1 and S2 (ESI†), respectively).Fluorescence exchange studies
After studying the effect of varying the spacer length on the self-assembly properties, we were interested in the monomer exchange rates within the series 1a–c. Förster resonance energy transfer (FRET) has been widely relied on to probe dynamics and exchange processes,56–60 and has recently been introduced to follow the reversible assembly and disassembly of BTA-based systems.43,45 By co-assembling either 2a–c (FRET donor) or 3a–c (FRET acceptor) (5 mol%) with the parent BTA 1a-c fibres labelled with either Cy3 or Cy5 were prepared (Fig. 5A, cBTA = 1 × 10⁻⁵ M). Mixing these solutions and monitoring the FRET ratio allowed the determination of the rate of equilibration. Both systems of 1a and 1b show a rise in the FRET ratio upon mixing, indicating monomer exchange between the stacks (Fig. 5B). This increase in FRET ratio follows similar kinetics for 1a and 1b, plateauing around 40 minutes. Both of these curves can be fit by a single exponential, resulting in similar time constants (Fig. S6, ESI†). In contrast, for 1c the FRET ratio as function of time proved very erratic and highly irreproducible (Fig. 5C), likely due to poor self-assembly.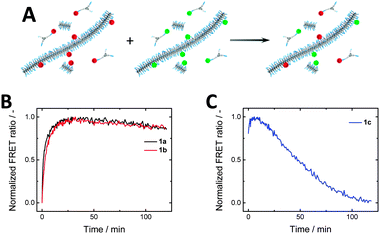 | ||
| Fig. 5 (A) Schematic of FRET exchange experiment. (B) FRET experiments of 1a and 1b show similar exchange kinetics, while (C) 1c shows erratic behaviour due to poor self-assembly (cBTA = 1 × 10⁻⁵ M). | ||
Discussion
The influence of the number of carbons in the aliphatic spacer on the self-assembly of BTAs in water is noteworthy and a C10 spacer corresponds to the limiting case in which self-assembly does not occur. BTAs 1a and 1b self-assemble in water into supramolecular polymers of high aspect ratio. Both form fibres of micrometres in length and of a comparable diameter of less than 10 nm. In sharp contrast, 1c does not form fibrillar aggregates at the same conditions. This indicates that a critical hydrophobic spacer length of 11 carbon atoms is required in order for these BTAs to self-assemble in the concentration regime studied. If we consider 1a–c as simple ethylene-oxide based amphiphiles, the removal of one –CH2– unit is expected to increase the CMC by less than an order of magnitude and this effect becomes smaller with increasing chain length.12–16 Going from 1b to 1c three –CH2– units are removed (one per side chain), which according to this trend would increase the CMC by roughly two orders of magnitude. Although we have not been able to determine the CMC of 1a and 1b, it is below 10−6 M for both compounds, while at two orders of magnitude higher concentration no aggregation was observed for 1c. This suggests that our system does not behave like simple (non-ionic) amphiphiles. Instead, we propose that the hydrophobic–hydrophilic balance in the BTA molecular design plays a double role. First the hydrophobic collapse represents a primary driving force for aggregation, this was also concluded from MD simulations.45 When the hydrophobic domain is too small, the molecules become too soluble in water, whereas the molecules become insoluble when the domain is too large. Secondly, although hydrophobic collapse may suffice to induce aggregation, a sufficiently large hydrophobic pocket around the benzene-tricarboxamide core stabilises amide–amide intermolecular hydrogen-bonding interactions, and shields these interactions from the surrounding water. In that case, intermolecular hydrogen bonding further stabilises the formed aggregates. This is supported by FT-IR measurements on solutions of 1a in aqueous solution, which confirm the formation of hydrogen bonds. The Nile Red experiments show that the polarity of the hydrophobic local domain in aggregates of 1a and 1b is very similar, indicating that the BTA core is effectively shielded from surrounding water in both systems. In the case of 1c, the hydrophobic collapse and hydrophobic shielding appear insufficient to enable interactions between the BTAs needed for the formation of supramolecular polymers.The difference of the thermodynamic stability in water as well as the thermal stability in bulk between 1a and 1b is more subtle. The loss of hydrogen bonds in IR in the bulk occurs at 45 °C and 35 °C for 1a and 1b, respectively, and the stability of the self-assembled structures formed by 1b is lower. Interestingly, the exchange dynamics between supramolecular polymers of BTAs with C11 (1b) or C12 (1a) spacers seem to depend less on the spacer length. In a previous study the rate of monomer exchange between BTA-based supramolecular polymers in water was shown to depend on the character of the hydrophobic spacer.45 The stereogenic nature of that modification was concluded to be the major cause for the change in exchange dynamics. It is of note that within these experiments we observe the exchange of the dye labelled monomers, and not the unlabelled monomers. Despite this limitation, the similar profiles in the FRET experiment observed for 1a and 1b suggest that the extension of the hydrophobic substituent by one CH2 unit does not necessarily affect the exchange dynamics.
Conclusions
We have studied the role of hydrophobic and hydrogen-bonding interactions on the aqueous self-assembly behaviour and exchange dynamics of BTA derivatives 1a–c. The results stress the crucial importance of a delicate balance between hydrophobic and hydrophilic units within the BTA: a decyl spacer is too short to provide the hydrophobicity required for forming ordered assemblies, while the undecyl and dodecyl spacer do result in stable supramolecular polymer formation in water. Furthermore, FT-IR spectroscopy provides the first experimental evidence for stabilisation through hydrogen-bond formation in these supramolecular polymers in aqueous solution and confirms previous computational findings. Finally, while variation of the hydrophobic spacer results in differences in aggregate size and thermal stability, the exchange dynamics of the supramolecular polymers appear to not show such a direct relation with the spacer length. This is exemplified by the equally fast exchange rates observed for 1a and 1b.Acknowledgements
We gratefully acknowledge financial support from the Dutch Ministry of Education, Culture and Science (Gravity program 024.001.035) and the European Research Council (FP7/2007-2013, ERC Grant Agreement 246829). M. B. B. and L. A. are grateful for financial support from the Netherlands Institute for Regenerative Medicine. L. A. is grateful for financial support from the Netherlands Organization for Scientific Research (NWO – VENI Grant: 722.014.010). The ICMS animation studio is acknowledged for providing the artwork.References
- A. R. Hirst, B. Escuder, J. F. Miravet and D. K. Smith, Angew. Chem., Int. Ed., 2008, 47, 8002–8018 CrossRef CAS PubMed.
- A. Noro, M. Hayashi and Y. Matsushita, Soft Matter, 2012, 8, 6416–6429 RSC.
- E. A. Appel, J. del Barrio, X. J. Loh and O. A. Scherman, Chem. Soc. Rev., 2012, 41, 6195–6214 RSC.
- J. H. Collier, Soft Matter, 2008, 4, 2310–2315 RSC.
- B. Rybtchinski, ACS Nano, 2011, 5, 6791–6818 CrossRef CAS PubMed.
- T. Rehm and C. Schmuck, Chem. Commun., 2008, 801–813 RSC.
- L. A. Estroff and A. D. Hamilton, Chem. Rev., 2004, 104, 1201–1217 CrossRef CAS PubMed.
- M. de Loos, J. H. van Esch, R. M. Kellogg and B. L. Feringa, Tetrahedron, 2007, 63, 7285–7301 CrossRef CAS.
- Y. Yan, Y. Lin, Y. Qiao and J. Huang, Soft Matter, 2011, 7, 6385–6398 RSC.
- J. Boekhoven, A. M. Brizard, P. van Rijn, M. C. A. Stuart, R. Eelkema and J. H. van Esch, Angew. Chem., Int. Ed., 2011, 50, 12285–12289 CrossRef CAS PubMed.
- K. Esumi and M. Ueno, Structure-Performance Relationships in Surfactants, CRC Press, 2003 Search PubMed.
- P. D. T. Huibers, V. S. Lobanov, A. R. Katritzky, D. O. Shah and M. Karelson, Langmuir, 1996, 12, 1462–1470 CrossRef CAS.
- A. R. Katritzky, L. M. Pacureanu, S. H. Slavov, D. A. Dobchev and M. Karelson, Ind. Eng. Chem. Res., 2008, 47, 9687–9695 CrossRef CAS.
- M. Mattei, G. M. Kontogeorgis and R. Gani, Ind. Eng. Chem. Res., 2013, 52, 12236–12246 CrossRef CAS.
- L.-J. Chen, S.-Y. Lin and C.-C. Huang, J. Phys. Chem. B, 1998, 102, 4350–4356 CrossRef CAS.
- D. Chandler, Nature, 2005, 437, 640–647 CrossRef CAS PubMed.
- D. Görl, X. Zhang and F. Würthner, Angew. Chem., Int. Ed., 2012, 51, 6328–6348 CrossRef PubMed.
- Y. Tidhar, H. Weissman, S. G. Wolf, A. Gulino and B. Rybtchinski, Chem. – Eur. J., 2011, 17, 6068–6075 CrossRef CAS PubMed.
- V. Villari, P. Mineo, E. Scamporrino and N. Micali, Chem. Phys., 2012, 409, 23–31 CrossRef CAS.
- J. M. Kroon, R. B. M. Koehorst, M. van Dijk, G. M. Sanders and E. J. R. Sudholter, J. Mater. Chem., 1997, 7, 615–624 RSC.
- L. Brunsveld, B. G. G. Lohmeijer, J. Vekemans and E. W. Meijer, Chem. Commun., 2000, 2305–2306 RSC.
- D.-W. Lee, T. Kim, I.-S. Park, Z. Huang and M. Lee, J. Am. Chem. Soc., 2012, 134, 14722–14725 CrossRef CAS PubMed.
- A. Pal, S. Karthikeyan and R. P. Sijbesma, J. Am. Chem. Soc., 2010, 132, 7842–7843 CrossRef CAS PubMed.
- E. Obert, M. Bellot, L. Bouteiller, F. Andrioletti, C. Lehen-Ferrenbach and F. Boue, J. Am. Chem. Soc., 2007, 129, 15601–15605 CrossRef CAS PubMed.
- J. D. Hartgerink, E. Beniash and S. I. Stupp, Science, 2001, 294, 1684–1688 CrossRef CAS PubMed.
- B. J. Cafferty, I. Gállego, M. C. Chen, K. I. Farley, R. Eritja and N. V. Hud, J. Am. Chem. Soc., 2013, 135, 2447–2450 CrossRef CAS PubMed.
- S. Han, S. Cao, Y. Wang, J. Wang, D. Xia, H. Xu, X. Zhao and J. R. Lu, Chem. – Eur. J., 2011, 17, 13095–13102 CrossRef CAS PubMed.
- P. Besenius, G. Portale, P. H. H. Bomans, H. M. Janssen, A. R. A. Palmans and E. W. Meijer, Proc. Natl. Acad. Sci. U. S. A., 2010, 107, 17888–17893 CrossRef CAS PubMed.
- K. J. C. van Bommel, C. van der Pol, I. Muizebelt, A. Friggeri, A. Heeres, A. Meetsma, B. L. Feringa and J. van Esch, Angew. Chem., Int. Ed., 2004, 43, 1663–1667 CrossRef CAS PubMed.
- N. Chebotareva, P. H. H. Bomans, P. M. Frederik, N. Sommerdijk and R. P. Sijbesma, Chem. Commun., 2005, 4967–4969 RSC.
- P. Y. W. Dankers, T. M. Hermans, T. W. Baughman, Y. Kamikawa, R. E. Kieltyka, M. M. C. Bastings, H. M. Janssen, N. A. J. M. Sommerdijk, A. Larsen, M. J. A. van Luyn, A. W. Bosman, E. R. Popa, G. Fytas and E. W. Meijer, Adv. Mater., 2012, 24, 2703–2709 CrossRef CAS PubMed.
- S. Cantekin, T. F. A. de Greef and A. R. A. Palmans, Chem. Soc. Rev., 2012, 41, 6125–6137 RSC.
- A. Timme, R. Kress, R. Q. Albuquerque and H. W. Schmidt, Chem. – Eur. J., 2012, 18, 8329–8339 CrossRef CAS PubMed.
- M. Blomenhofer, S. Ganzleben, D. Hanft, H.-W. Schmidt, M. Kristiansen, P. Smith, K. Stoll, D. Mäder and K. Hoffmann, Macromolecules, 2005, 38, 3688–3695 CrossRef CAS.
- F. Abraham and H.-W. Schmidt, Polymer, 2010, 51, 913–921 CrossRef CAS.
- M. Masuda, P. Jonkheijm, R. P. Sijbesma and E. W. Meijer, J. Am. Chem. Soc., 2003, 125, 15935–15940 CrossRef CAS PubMed.
- C. F. C. Fitie, W. S. C. Roelofs, P. Magusin, M. Wubbenhorst, M. Kemerink and R. P. Sijbesma, J. Phys. Chem. B, 2012, 116, 3928–3937 CrossRef CAS PubMed.
- T. Mes, M. M. J. Smulders, A. R. A. Palmans and E. W. Meijer, Macromolecules, 2010, 43, 1981–1991 CrossRef CAS.
- M. M. J. Smulders, A. P. H. J. Schenning and E. W. Meijer, J. Am. Chem. Soc., 2008, 130, 606–611 CrossRef CAS PubMed.
- P. J. M. Stals, M. M. J. Smulders, R. Martin-Rapun, A. R. A. Palmans and E. W. Meijer, Chem. – Eur. J., 2009, 15, 2071–2080 CrossRef CAS PubMed.
- I. A. W. Filot, A. R. A. Palmans, P. A. J. Hilbers, R. A. van Santen, E. A. Pidko and T. F. A. de Greef, J. Phys. Chem. B, 2010, 114, 13667–13674 CrossRef CAS PubMed.
- C. M. A. Leenders, L. Albertazzi, T. Mes, M. M. E. Koenigs, A. R. A. Palmans and E. W. Meijer, Chem. Commun., 2013, 49, 1963–1965 RSC.
- L. Albertazzi, F. J. Martinez-Veracoechea, C. M. A. Leenders, I. K. Voets, D. Frenkel and E. W. Meijer, Proc. Natl. Acad. Sci. U. S. A., 2013, 110, 12203–12208 CrossRef CAS PubMed.
- L. Albertazzi, D. van der Zwaag, C. M. A. Leenders, R. Fitzner, R. W. van der Hofstad and E. W. Meijer, Science, 2014, 344, 491–495 CrossRef CAS PubMed.
- M. B. Baker, L. Albertazzi, I. K. Voets, C. M. A. Leenders, A. R. A. Palmans, G. M. Pavan and E. W. Meijer, Nat. Commun., 2015, 6 DOI:10.1038/ncomms7234.
- E. E. Dormidontova, Macromolecules, 2004, 37, 7747–7761 CrossRef CAS.
- L. Brunsveld, A. Schenning, M. A. C. Broeren, H. M. Janssen, J. Vekemans and E. W. Meijer, Chem. Lett., 2000, 292–293 CrossRef CAS.
- P. J. M. Stals, J. F. Haveman, R. Martin-Rapun, C. F. C. Fitie, A. R. A. Palmans and E. W. Meijer, J. Mater. Chem., 2009, 19, 124–130 RSC.
- M. C. A. Stuart, J. C. van de Pas and J. B. F. N. Engberts, J. Phys. Org. Chem., 2005, 18, 929–934 CrossRef CAS.
- W. K. Surewicz and H. H. Mantsch, Biochim. Biophys. Acta, Protein Struct. Mol. Enzymol., 1988, 952, 115–130 CrossRef CAS.
- M. Jackson and H. H. Mantsch, Crit. Rev. Biochem. Mol. Biol., 1995, 30, 95–120 CrossRef CAS PubMed.
- J. Kong and S. Yu, Acta Biochim. Biophys. Sin., 2007, 39, 549–559 CrossRef CAS PubMed.
- M. Beer, H. B. Kessler and G. B. B. M. Sutherland, J. Chem. Phys., 1958, 29, 1097–1104 CrossRef CAS.
- H. Susi, S. N. Timasheff and L. Stevens, J. Biol. Chem., 1967, 242, 5460–5466 CAS.
- C. A. Swenson, Spectrochim. Acta, 1965, 21, 987–993 CrossRef CAS.
- J.-Y. Kim, C. Kim and N. K. Lee, Nat. Commun., 2015, 6, 6992 CrossRef CAS PubMed.
- Y. Zhao, P. Schapotschnikow, T. Skajaa, T. J. Vlugt, W. J. Mulder, C. de Mello Donega and A. Meijerink, Small, 2014, 10, 1163–1170 CrossRef CAS PubMed.
- J. Bai and R. E. Pagano, Biochemistry, 1997, 36, 8840–8848 CrossRef CAS PubMed.
- E. S. Barrett, T. J. Dale and J. Rebek, Jr., J. Am. Chem. Soc., 2007, 129, 8818–8824 CrossRef CAS PubMed.
- K. Petkau-Milroy, D. A. Uhlenheuer, A. J H. Spiering, J. A. J. M. Vekemans and L. Brunsveld, Chem. Sci., 2013, 4, 2886–2891 RSC.
Footnote |
| † Electronic supplementary information (ESI) available: Experimental details, characterization by IR and UV spectroscopy and dynamic light scattering, video files of optical microscopy imaging. See DOI: 10.1039/c5sm02843d |
| This journal is © The Royal Society of Chemistry 2016 |

