 Open Access Article
Creative Commons Attribution 3.0 Unported Licence
Supercoiled fibres of self-sorted donor–acceptor stacks: a turn-off/turn-on platform for sensing volatile aromatic compounds†
Anjamkudy
Sandeep
a,
Vakayil K.
Praveen
 a,
Kalathil K.
Kartha
 a,
Venugopal
Karunakaran
ab and
Ayyappanpillai
Ajayaghosh
*ab
aPhotosciences and Photonics Section, Chemical Sciences and Technology Division, CSIR-National Institute for Interdisciplinary Science and Technology (CSIR-NIIST), Thiruvananthapuram 695 019, India. E-mail: ajayaghosh@niist.res.in
bAcademy of Scientific and Innovative Research (AcSIR), CSIR-NIIST Campus, Thiruvananthapuram 695 019, India
First published on 21st March 2016
Abstract
To ensure the comfortable survival of living organisms, detection of different life threatening volatile organic compounds (VOCs) such as biological metabolites and carcinogenic molecules is of prime importance. Herein, we report the use of supercoiled supramolecular polymeric fibres of self-sorted donor–acceptor molecules as “turn-off/turn-on” fluorescent sensors for the detection of carcinogenic VOCs. For this purpose, a C3-symmetrical donor molecule based on oligo(p-phenylenevinylene), C3OPV, and a perylene bisimide based acceptor molecule, C3PBI, have been synthesized. When these two molecules were mixed together in toluene, in contrast to the usual charge transfer (CT) stacking, supramolecular fibres of self-sorted stacks were formed at the molecular level, primarily driven by their distinct self-assembly pathways. However, CT interaction at the macroscopic level allows these fibres to bundle together to form supercoiled ropes. An interfacial photoinduced electron transfer (PET) process from the donor to the acceptor fibres leads to an initial fluorescence quenching, which could be modulated by exposure to strong donor or acceptor type VOCs to regenerate the respective fluorescence of the individual molecular stacks. Thus, strong donors could regenerate the green fluorescence of C3OPV stacks and strong acceptors could reactivate the red fluorescence of C3PBI stacks. These supercoiled supramolecular ropes of self-sorted donor–acceptor stacks provide a simple tool for the detection of donor- or acceptor-type VOCs of biological relevance, using a “turn-off/turn-on” fluorescence mechanism as demonstrated with o-toluidine, which has been reported as a lung cancer marker.
Introduction
Early detection of deadly diseases such as cancer can save the lives of millions of people across the globe and hence is a prime concern of scientists and clinicians. At the onset of certain diseases, the metabolism of the human body changes to produce several volatile organic compounds (VOCs) in small quantities, some of which can be designated as disease markers.1 Detection of cancer markers and carcinogenic VOCs such as o-toluidine, aromatic amines, nitroaromatics etc. is important since tobacco smoke contains a large number of them, which are known to cause bladder cancer.2ao-Toluidine has also been detected in exhaled air from lung cancer patients.2b Similarly, detection of electron deficient molecules such as nitroaromatics is important since they are not only considered as explosives but are also toxic to living organisms through contamination of air and water.3Considering the social relevance of the detection of carcinogenic VOCs, intense research is needed for further development in this area. These considerations prompted us to explore the potential of fluorescent donor–acceptor assemblies designed based on the principles of nanoarchitectonics4 for the sensing of volatile analytes. A number of reports are available on the sensing of VOCs such as aromatic amines5 and nitroaromatics3,6,7 that generally cause fluorescence quenching of a probe. In this context, self-sorted supramolecular assemblies8–10 are an ideal platform for the sensing of VOCs. We have earlier shown that fluorescent π-gelators are powerful tools for attogram level sensing of trinitrotoluene (TNT) through a contact mode7a and thought that there could be immense scope for expanding this idea to the sensing of VOCs of metabolic origin, if the principles of molecular self-assembly and self-sorting are combined.
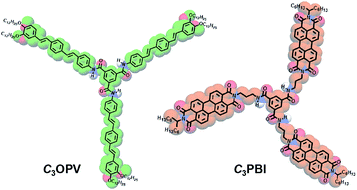
Usually, when donor and acceptor monomers are mixed, CT induced supramolecular polymers are formed.11 Supramolecular control of the polymerization is difficult in such cases.12 However, suitably functionalized π-systems10 such as oligo(thiophenes) (OTs), oligo(p-phenylenevinylenes) (OPVs) and perylene bisimides (PBIs) are known to form self-sorted supramolecular polymeric stacks when mixed, in which the emission is quenched due to photoinduced electron transfer (PET) from the electron rich OTs or OPVs to the electron deficient PBIs.10a,b Recently, we reported the formation of self-sorted supramolecular assemblies of thienylenevinylenes and PBIs that form coaxial fibres10d through weak interfacial charge transfer interactions.13 Based on these findings, we hypothesized that suitably designed C3-symmetrical systems of OPVs and PBIs may form supramolecular polymers of self-sorted donor and acceptor fibres with quenched fluorescence. In such a case, the weak interfacial donor–acceptor interactions in the supercoiled fibres at supramolecular level can be perturbed by exposure to strong donor or acceptor molecular vapours, which may result in a “turn-on” fluorescence with distinct colour variation. As a proof-of-concept for this hypothesis, we illustrate that a combination of a C3-symmetrical OPV, C3OPV, and a C3-symmetrical PBI, C3PBI, (Fig. 1) forms supercoiled fibres of self-sorted donor–acceptor stacks, which results in a “turn-off/turn-on” fluorescence sensor for the detection of different aromatic VOCs.
Results and discussion
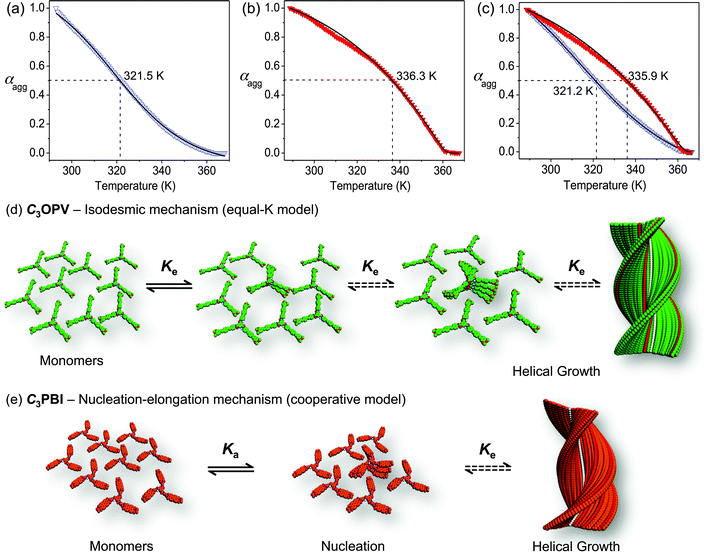
Synthesis of C3OPV and C3PBI was accomplished as shown in Schemes S1 and S2,† respectively, and they were characterised using FT-IR, 1H and 13C NMR spectroscopy, and MALDI-TOF mass spectrometry. Having obtained these molecules in a pure form, our first objective was to get a clear idea of the mechanistic pathway for the individual assembly of C3OPV and C3PBI. Detailed UV/Vis absorption studies revealed that these molecules self-assemble in toluene at a concentration range of 10−4 to 10−5 M (Fig. S1†). Further understanding of the self-assembly mechanism was possible from temperature-dependent absorption studies. For this purpose, the change in the absorption shoulder band at 425 nm of a hot toluene solution of (1 × 10⁻⁴ M) C3OPV was monitored as a function of temperature with a cooling rate of 1 K min−1 (Fig. S1b†). No hysteresis was observed when the solution was heated again to the monomeric state, indicating that the self-assembly process is reversible. It was clear from the plot of the fraction of aggregates (αagg) versus temperature that the molecule forms assemblies through an isodesmic pathway (equal-K model) as indicated by the broad melting curve, which could be fitted to a standard isodesmic model (Fig. 2a).14 This observation is quite surprising, especially considering the fact that most of the C3-symmetrical benzene trisamide derivatives are known to self-assemble through a cooperative nucleation–elongation mechanism.15 Based on this observation, we concluded that the isodesmic self-assembly of C3OPV (Fig. 2d) presumably is governed by π–π stacking of the OPV moieties and that the contribution from directional intermolecular H-bonding may be weak due to the presence of a sterically demanding aromatic core and six alkyl chains at the periphery.15,16 The thermodynamic parameters were calculated by applying the isodesmic model and are summarized in Table 1. The melting transition temperature (Tm, temperature at which αagg = 0.50) of the assembly was found to be 321.5 K (Fig. 2a) with an enthalpy value of −85.1 kJ mol−1 and an association constant of 4.7 × 10⁴ M−1.| C 3OPV | C (mM) | ΔH (kJ mol−1) | ΔS (J mol−1 K−1) | T m (K) | K e (104 M−1) | DPN |
|---|---|---|---|---|---|---|
| a C is the concentration, ΔH is the change in enthalpy, ΔS is the change in entropy, Tm is the melting transition temperature, Ke is the association constant and DPN is the degree of polymerization. | ||||||
| Alone | 0.1 | −85.1 | −194.5 | 321.5 | 4.7 | 2.7 |
| In the mixture | 0.1 | −73.6 | −158.0 | 321.2 | 3.7 | 2.5 |
To probe the self-assembly pathway of C3PBI, the absorption changes at 527 nm were monitored as a function of temperature with a cooling rate of 1 K min−1 (Fig. S1d†). The plot of αagg with temperature showed a non-sigmoidal transition, characteristic of a cooperative pathway, which could be fitted to a nucleation–elongation model (Fig. 2b and e).14c,15a,17–19 By applying this model, the elongation temperature (Te) was determined as 360.5 K and the enthalpy release upon elongation (He) was calculated as −27.4 kJ mol−1. A high degree of cooperativity (Ka) was inferred from the small value of the equilibrium constant (10−6) for the nucleation step.
After obtaining an idea of the individual assembly mechanisms of C3OPV and C3PBI in toluene, we studied the effect of mixing these molecules at a 1![[thin space (1/6-em)]](https://www.rsc.org/images/entities/char_2009.gif) :
:![[thin space (1/6-em)]](https://www.rsc.org/images/entities/char_2009.gif) 1 ratio by monitoring the changes in the absorption spectra under identical experimental conditions. The resultant spectrum of the mixture in toluene (1 × 10⁻⁴ M) was found to be a sum of the absorption spectra of the individual constituents (Fig. S2†). Furthermore, the absence of a CT band in the absorption spectrum excludes the possibility of a molecular level donor–acceptor interaction. The mixture was cooled down slowly at a rate of 1 K min−1. The variable temperature absorption spectral changes of the mixture monitored at 425 and 527 nm exhibited that melting of the individual aggregates occurred without much variation from their respective melting transition curves as observed for the individual assemblies (Fig. 2c and S3†). The transition curves obtained from a plot of αaggversus temperature could be fitted to an isodesmic model and nucleation–elongation model for C3OPV and C3PBI, respectively (Fig. 2c). The thermodynamic parameters calculated for the mixture from the curve fitting are in good agreement with that of the individual assemblies. The melting transition temperature, Tm, of C3OPV in the mixture is 321.2 K, which is close to that of C3OPV alone (321.5 K). Similarly, Tm of the C3PBI assemblies in the mixture is 335.9 K, which matches to that observed for the individual assembly of C3PBI (336.3 K) (Fig. 2). The other thermodynamic parameters such as enthalpy and entropy changes of the molecules in the mixture also match with those of the individual molecular assemblies (Tables 1 and 2). These results imply that both C3OPV and C3PBI form self-sorted stacks when they are mixed.
1 ratio by monitoring the changes in the absorption spectra under identical experimental conditions. The resultant spectrum of the mixture in toluene (1 × 10⁻⁴ M) was found to be a sum of the absorption spectra of the individual constituents (Fig. S2†). Furthermore, the absence of a CT band in the absorption spectrum excludes the possibility of a molecular level donor–acceptor interaction. The mixture was cooled down slowly at a rate of 1 K min−1. The variable temperature absorption spectral changes of the mixture monitored at 425 and 527 nm exhibited that melting of the individual aggregates occurred without much variation from their respective melting transition curves as observed for the individual assemblies (Fig. 2c and S3†). The transition curves obtained from a plot of αaggversus temperature could be fitted to an isodesmic model and nucleation–elongation model for C3OPV and C3PBI, respectively (Fig. 2c). The thermodynamic parameters calculated for the mixture from the curve fitting are in good agreement with that of the individual assemblies. The melting transition temperature, Tm, of C3OPV in the mixture is 321.2 K, which is close to that of C3OPV alone (321.5 K). Similarly, Tm of the C3PBI assemblies in the mixture is 335.9 K, which matches to that observed for the individual assembly of C3PBI (336.3 K) (Fig. 2). The other thermodynamic parameters such as enthalpy and entropy changes of the molecules in the mixture also match with those of the individual molecular assemblies (Tables 1 and 2). These results imply that both C3OPV and C3PBI form self-sorted stacks when they are mixed.
| C 3PBI | C (mM) | ΔHe (kJ mol−1) | ΔSe (J mol−1 K−1) | T m (K) | T e (K) | K a |
|---|---|---|---|---|---|---|
| a C is the concentration, ΔHe and ΔSe, respectively, are the change in enthalpy and entropy during the elongation process, Tm is the melting transition temperature, Te is the elongation temperature and Ka is the degree of cooperativity. | ||||||
| Alone | 0.1 | −27.4 | −140.9 | 336.3 | 360.5 | 10−6 |
| In the mixture | 0.1 | −27.5 | −132.6 | 335.9 | 362.4 | 10−6 |
Other important parameters for supporting the formation of a self-sorted assembly are the association constant (Ke) in the case of C3OPV and the degree of cooperativity (Ka) in the case of C3PBI (Tables 1 and 2). The association constant for the addition of individual monomers to the growing assembly of C3OPV in the mixture is 3.7 × 10⁴ M−1, which almost matches with the value for the individual assembly of C3OPV (4.7 × 10⁴ M−1). For the cooperative self-assembly of C3PBI, the degree of cooperativity is in the range of 10−6, similar to that of the individual assembly.
Atomic force microscopy (AFM) images of C3OPV drop cast from a 1 × 10⁻⁴ M toluene solution on a freshly cleaved mica surface revealed the formation of micrometer long helical fibres of a diameter of 200–250 nm (Fig. 3a). C3PBI also displayed the formation of helical fibres with the diameter varying from 100–150 nm and the length extended to several micrometres (Fig. 3b). For the 1![[thin space (1/6-em)]](https://www.rsc.org/images/entities/char_2009.gif) :
:![[thin space (1/6-em)]](https://www.rsc.org/images/entities/char_2009.gif) 1 mixture assembly, the fibre-like morphology was retained, however, the formation of supercoiled helical ropes with an increased diameter (400–500 nm) was observed (Fig. 3c). The scanning electron microscopy (SEM) images also support the formation of helical fibres and supercoiled ropes (Fig. 3d–f). These observations are in analogy with previous reports on the self-assembly of C3-symmetrical N,N′,N′′-trialkyl benzene-1,3,5-tricarboxamide in which the amide functionality is involved in a three-fold helical array of intermolecular hydrogen bonding.20 From the mechanistic studies and the morphological features, it was inferred that self-sorted donor and acceptor fibres are formed initially, which enter into weak interfacial charge transfer interactions at the supramolecular level resulting in supercoiled ropes.10d,13 The absorption spectra of a 1
1 mixture assembly, the fibre-like morphology was retained, however, the formation of supercoiled helical ropes with an increased diameter (400–500 nm) was observed (Fig. 3c). The scanning electron microscopy (SEM) images also support the formation of helical fibres and supercoiled ropes (Fig. 3d–f). These observations are in analogy with previous reports on the self-assembly of C3-symmetrical N,N′,N′′-trialkyl benzene-1,3,5-tricarboxamide in which the amide functionality is involved in a three-fold helical array of intermolecular hydrogen bonding.20 From the mechanistic studies and the morphological features, it was inferred that self-sorted donor and acceptor fibres are formed initially, which enter into weak interfacial charge transfer interactions at the supramolecular level resulting in supercoiled ropes.10d,13 The absorption spectra of a 1![[thin space (1/6-em)]](https://www.rsc.org/images/entities/char_2009.gif) :
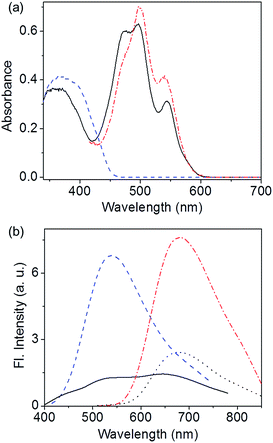
:![[thin space (1/6-em)]](https://www.rsc.org/images/entities/char_2009.gif) 1 mixture of C3OPV and C3PBI in solution (toluene, 1 × 10⁻⁴ M, Fig. S2†) and film states (Fig. 4a) did not show any CT bands, indicating the absence of a molecular level donor–acceptor interaction. However, significant quenching of the individual emissions of C3OPV and C3PBI was observed in the solution and the film states (Fig. S4† and 4b). These observations could be ascribed to a possible PET from the donor OPV to the acceptor PBI.
1 mixture of C3OPV and C3PBI in solution (toluene, 1 × 10⁻⁴ M, Fig. S2†) and film states (Fig. 4a) did not show any CT bands, indicating the absence of a molecular level donor–acceptor interaction. However, significant quenching of the individual emissions of C3OPV and C3PBI was observed in the solution and the film states (Fig. S4† and 4b). These observations could be ascribed to a possible PET from the donor OPV to the acceptor PBI.
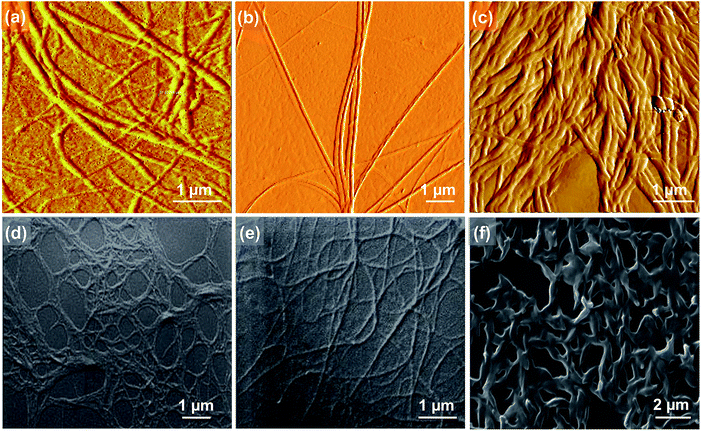 | ||
Fig. 3 AFM (a), (b) and (c), and SEM (d), (e) and (f) images of C3OPV, C3PBI, and the 1![[thin space (1/6-em)]](https://www.rsc.org/images/entities/char_2009.gif) : :![[thin space (1/6-em)]](https://www.rsc.org/images/entities/char_2009.gif) 1 mixture, respectively. 1 mixture, respectively. | ||
The PET process between C3OPV and C3PBI was investigated using femtosecond pump-probe spectroscopy. When a solution containing a 1![[thin space (1/6-em)]](https://www.rsc.org/images/entities/char_2009.gif) :
:![[thin space (1/6-em)]](https://www.rsc.org/images/entities/char_2009.gif) 1 mixture of C3OPV and C3PBI was excited at 380 nm, where mainly C3OPV absorbs, the transient absorption spectra showed the formation of a radical anion of C3PBI absorbing broadly around 630 nm with a decay time of around 728 ps (Fig. 5a), which indicated PET from the OPV to the PBI.21 The feasibility of PET between these molecules was further established using photoelectron yield spectroscopic studies (Fig. S5†). From the value for the HOMO and the optical band gap (Eg) obtained from the film state absorption spectrum (Fig. S6†), the LUMO values of both C3OPV and C3PBI were calculated. C3PBI showed a slightly lower LUMO (−4.20 eV) when compared to that of C3OPV (−3.50 eV) (Fig. 5b). Since C3PBI is an electron accepting molecule compared to C3OPV, the HOMO level of the former is lower than that of C3OPV (Fig. 5b). Therefore, upon photoexcitation, electrons are transferred from C3OPV to C3PBI leading to quenching of the emission.
1 mixture of C3OPV and C3PBI was excited at 380 nm, where mainly C3OPV absorbs, the transient absorption spectra showed the formation of a radical anion of C3PBI absorbing broadly around 630 nm with a decay time of around 728 ps (Fig. 5a), which indicated PET from the OPV to the PBI.21 The feasibility of PET between these molecules was further established using photoelectron yield spectroscopic studies (Fig. S5†). From the value for the HOMO and the optical band gap (Eg) obtained from the film state absorption spectrum (Fig. S6†), the LUMO values of both C3OPV and C3PBI were calculated. C3PBI showed a slightly lower LUMO (−4.20 eV) when compared to that of C3OPV (−3.50 eV) (Fig. 5b). Since C3PBI is an electron accepting molecule compared to C3OPV, the HOMO level of the former is lower than that of C3OPV (Fig. 5b). Therefore, upon photoexcitation, electrons are transferred from C3OPV to C3PBI leading to quenching of the emission.
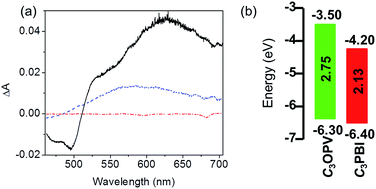 | ||
Fig. 5 (a) Transient absorption spectra of C3OPV ( ), C3PBI ( ), C3PBI ( ) and a 1 ) and a 1![[thin space (1/6-em)]](https://www.rsc.org/images/entities/char_2009.gif) : :![[thin space (1/6-em)]](https://www.rsc.org/images/entities/char_2009.gif) 1 mixture ( 1 mixture ( ) in toluene (1 × 10⁻⁴ M) recorded at 1.9 ps, λex = 380 nm. (b) An energy level diagram for C3OPV and C3PBI. ) in toluene (1 × 10⁻⁴ M) recorded at 1.9 ps, λex = 380 nm. (b) An energy level diagram for C3OPV and C3PBI. | ||
Since OPVs are known to interact with electron deficient aromatic nitro compounds3e,7a and PBIs with electron rich aromatic amines,5a–c,22 we thought that the quenched emission of the supercoiled C3OPV and C3PBI fibres could be “turned on” when they come into contact with a better donor or an acceptor molecule. In order to prove this hypothesis, a toluene solution of a 1![[thin space (1/6-em)]](https://www.rsc.org/images/entities/char_2009.gif) :
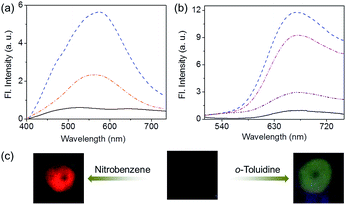
:![[thin space (1/6-em)]](https://www.rsc.org/images/entities/char_2009.gif) 1 mixture of C3OPV and C3PBI (20 μL of a 10−3 M solution) was drop cast on glass substrates and exposed to various analytes. The film that was exposed to aromatic amines such as o-toluidine displayed a greenish-yellow emission (Fig. 6a and c). Comparison of the absorption spectrum of C3OPV and the excitation spectrum obtained upon monitoring the emission at 540 nm for the 1
1 mixture of C3OPV and C3PBI (20 μL of a 10−3 M solution) was drop cast on glass substrates and exposed to various analytes. The film that was exposed to aromatic amines such as o-toluidine displayed a greenish-yellow emission (Fig. 6a and c). Comparison of the absorption spectrum of C3OPV and the excitation spectrum obtained upon monitoring the emission at 540 nm for the 1![[thin space (1/6-em)]](https://www.rsc.org/images/entities/char_2009.gif) :
:![[thin space (1/6-em)]](https://www.rsc.org/images/entities/char_2009.gif) 1 mixture of C3OPV and C3PBI revealed that the emission originates from C3OPV molecules in the mixture (Fig. S7†). On the other hand, a red emission was obtained when the film was exposed to nitrobenzene vapours (Fig. 6b and c). An excitation spectrum of the 1
1 mixture of C3OPV and C3PBI revealed that the emission originates from C3OPV molecules in the mixture (Fig. S7†). On the other hand, a red emission was obtained when the film was exposed to nitrobenzene vapours (Fig. 6b and c). An excitation spectrum of the 1![[thin space (1/6-em)]](https://www.rsc.org/images/entities/char_2009.gif) :
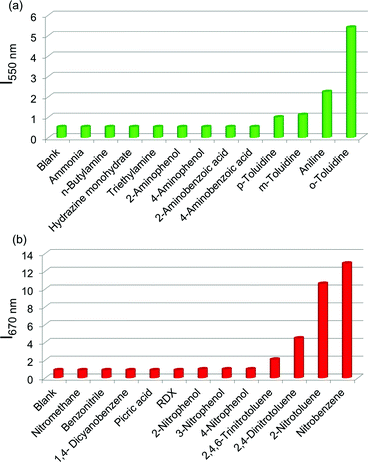
:![[thin space (1/6-em)]](https://www.rsc.org/images/entities/char_2009.gif) 1 mixture monitored at 650 nm showed a resemblance to the absorption spectrum of C3PBI individual assembly (Fig. S8†), which proves that the red emission is from the self-assembled C3PBI molecules. Similar experiments were conducted for other aromatic amines such as 2-aminophenol, aniline, m-toluidine, etc. and nitroaromatics such as TNT, dinitrotoluene (DNT), o-nitrotoluene, etc., and the results are summarized in Fig. 7.
1 mixture monitored at 650 nm showed a resemblance to the absorption spectrum of C3PBI individual assembly (Fig. S8†), which proves that the red emission is from the self-assembled C3PBI molecules. Similar experiments were conducted for other aromatic amines such as 2-aminophenol, aniline, m-toluidine, etc. and nitroaromatics such as TNT, dinitrotoluene (DNT), o-nitrotoluene, etc., and the results are summarized in Fig. 7.
The observed “turn-on” emission for the 1![[thin space (1/6-em)]](https://www.rsc.org/images/entities/char_2009.gif) :
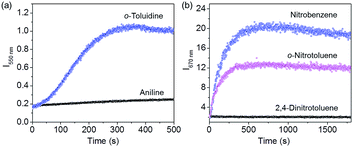
:![[thin space (1/6-em)]](https://www.rsc.org/images/entities/char_2009.gif) 1 mixed C3OPV and C3PBI films in the presence of the analytes is explained as follows. Electron rich aromatic amines facilitate a strong CT interaction with the electron deficient C3PBI fibres, which in turn prevents the weak interfacial PET from the C3OPV fibres to the C3PBI fibres, thus activating the C3OPV emission upon excitation at 375 nm. The emission intensity revival monitored at 550 nm with time was found to depend upon the electron donating ability of the amines used (Fig. 8a). For the first 120 seconds of exposure, around a 5-fold increase in the emission intensity for o-toluidine was observed, while only a 2-fold increase was noticed for aniline. The inductive effect of the electron donating methyl group in o-toluidine makes it a better donor than aniline. The inductive effect decreases in the case of m-toluidine as the methyl group is far from the amino group. Not only the electron donating ability of the different amines but also the vapour pressure of the different amines play an important role in the selective detection of o-toluidine. The vapour pressure of o-toluidine at 25 °C is around 200 Pa and that of aniline and m-toluidine is around 89 and 17 Pa, respectively. This high value of the vapour pressure for o-toluidine and the electron donating positive inductive effect of the methyl group result in a fast response upon interaction with a film of the mixed assembly.
1 mixed C3OPV and C3PBI films in the presence of the analytes is explained as follows. Electron rich aromatic amines facilitate a strong CT interaction with the electron deficient C3PBI fibres, which in turn prevents the weak interfacial PET from the C3OPV fibres to the C3PBI fibres, thus activating the C3OPV emission upon excitation at 375 nm. The emission intensity revival monitored at 550 nm with time was found to depend upon the electron donating ability of the amines used (Fig. 8a). For the first 120 seconds of exposure, around a 5-fold increase in the emission intensity for o-toluidine was observed, while only a 2-fold increase was noticed for aniline. The inductive effect of the electron donating methyl group in o-toluidine makes it a better donor than aniline. The inductive effect decreases in the case of m-toluidine as the methyl group is far from the amino group. Not only the electron donating ability of the different amines but also the vapour pressure of the different amines play an important role in the selective detection of o-toluidine. The vapour pressure of o-toluidine at 25 °C is around 200 Pa and that of aniline and m-toluidine is around 89 and 17 Pa, respectively. This high value of the vapour pressure for o-toluidine and the electron donating positive inductive effect of the methyl group result in a fast response upon interaction with a film of the mixed assembly.
When vapours of nitroaromatic compounds such as nitrobenzene and nitrotoluene are exposed to the supercoiled fibres of C3OPV and C3PBI, a red emission was observed. Electron deficient nitroaromatics can have a strong CT interaction with the electron rich C3OPV fibres thereby inhibiting the weak interfacial PET from the C3OPV fibres to the C3PBI fibres upon excitation of the later at 500 nm. Hence the interaction between the C3OPV and C3PBI stacks becomes weaker, thereby the C3PBI emission is activated by a favouring of the more energetically feasible PET from C3OPV to the electron accepting nitroaromatic compounds. In this case also, the sensitivity depends upon both the electron accepting ability and the vapour pressure of the nitro compounds. This is evident from a plot of the emission intensity monitored at 670 nm with the time of exposure (Fig. 8b). It was observed that for the first minute of the exposure, nitrobenzene and 2-nitrotoluene showed an almost equal amount of emission recovery. However, upon extended exposure, nitrobenzene provided more emission revival than the nitrotoluene because of its high vapour pressure (20 Pa) and electron accepting ability. Compared to nitrobenzene, the presence of an electron donating methyl group reduces the electron accepting ability of o-nitrotoluene. At the same time, molecules such as DNT and TNT, which are more electron deficient than nitrobenzene, showed less response with the film. This observation is explained on the basis of the difference in the vapour pressure of these nitroaromatics. The vapour pressure of TNT and DNT is 0.0165 and 0.0079 Pa, respectively, which is much less than the vapour pressures of nitrobenzene (20 Pa) and 2-nitrotoluene (38 Pa).
The overall process for the sensing of VOCs by supercoiled self-stacks of C3OPV and C3PBI is schematically shown in Fig. 9. The C3 symmetrical OPV and PBI prefer to form columnar helical assemblies of self-sorted stacks. The C3OPV stacks (green) and the C3PBI stacks (red), due to weak interfacial CT interactions, bundle together to form supercoiled fibres (black) in which the fluorescence is quenched by PET between the donor–acceptor self-sorted fibres. The PET process is subsequently perturbed by exposing the fibres to strong donor or acceptor molecules, resulting in respective fluorescence signals from C3OPV or C3PBI.
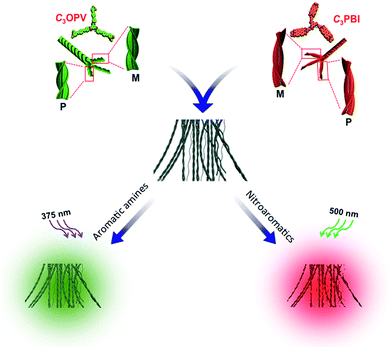 | ||
Fig. 9 Schematic illustration of the fluorescence ‘turn-off/turn-on’ mechanism of the self-sorted fibres of a 1![[thin space (1/6-em)]](https://www.rsc.org/images/entities/char_2009.gif) : :![[thin space (1/6-em)]](https://www.rsc.org/images/entities/char_2009.gif) 1 mixture of C3OPV and C3PBI on exposure to different VOCs. 1 mixture of C3OPV and C3PBI on exposure to different VOCs. | ||
Conclusions
By taking advantage of self-sorting at the molecular level and electronic interactions at the macroscopic level, we could design nonfluorescent supercoiled fibres of C3OPV and C3PBI molecules. The self-sorting is facilitated by differences in the self-assembly pathways of the individual molecules wherein C3OPV followed an isodesmic model and C3PBI preferred a cooperative mechanism. Interfacial PET between the self-sorted fibres resulted in the quenching of the initial fluorescence of the molecules, which could be perturbed by exposure to VOCs, especially electron rich compounds such as aromatic amines and electron deficient compounds such as nitroaromatics. Thus, the green emission of C3OPV appeared when the film was exposed to o-toluidine and the red emission of C3PBI was obtained by exposing the film to nitroaromatic vapours. The extent of the emission revival depends on the electron donating ability of the aromatic amines and the electron withdrawing ability of the nitroaromatics, in addition to the vapour pressure of the molecules. The fluorescence “turn-off/turn-on” features of the supercoiled supramolecular fibres of the self-sorted donor–acceptor system described here provide the ability to detect o-toluidine of metabolic origin, which is a known lung cancer marker.Acknowledgements
We thank the Council of Scientific and Industrial Research (CSIR 12 FYP M2D-CSC-0134), Government of India for financial support. A.A. is grateful for a J. C. Bose Fellowship from the Department of Science and Technology (DST), Government of India. A.S. and K.K. are thankful for research fellowships from the CSIR, Government of India. V.K.P. thanks DST, Government of India for a Young Scientist Fellowship. The authors gratefully acknowledge Dr S. Seki and Dr A. Gopal, Osaka University, Japan for photoelectron yield spectroscopy analyses and Ms. M. V. Chinju Govind and Mr J. S. Kiran CSIR-NIIST for the femtosecond pump-probe spectroscopy measurements and the artwork, respectively.Notes and references
- (a) B. Buszewski, M. Kęsy, T. Ligor and A. Amann, Biomed. Chromatogr., 2007, 21, 553–566 CrossRef CAS PubMed; (b) A. W. Boots, J. J. B. N. van Berkel, J. W. Dallinga, A. Smolinska, E. F. Wouters and F. J. van Schooten, J. Breath Res., 2012, 6, 027108 CrossRef PubMed; (c) Y. Y. Broza and H. Haick, Nanomedicine, 2013, 8, 785–806 CrossRef CAS PubMed.
- (a) K. Riedel, G. Scherer, J. Engl, H.-W. Hagedorn and A. R. Tricker, J. Anal. Toxicol., 2006, 30, 187–195 CrossRef CAS PubMed; (b) G. Preti, J. N. Labows, J. G. Kostelc, S. Aldinger and R. Daniele, J. Chromatogr. B: Biomed. Sci. Appl., 1988, 432, 1–11 CrossRef CAS.
- (a) T. M. Swager and J. H. Wosnick, MRS Bull., 2002, 27, 446–450 CrossRef CAS; (b) S. J. Toal and W. C. Trogler, J. Mater. Chem., 2006, 16, 2871–2883 RSC; (c) K. Sakakibara, J. P. Hill and K. Ariga, Small, 2011, 7, 1288–1308 CrossRef CAS PubMed; (d) Z. Hu, B. J. Deibert and J. Li, Chem. Soc. Rev., 2014, 43, 5815–5840 RSC; (e) K. K. Kartha, A. Sandeep, V. K. Praveen and A. Ajayaghosh, Chem. Rec., 2015, 15, 252–265 CrossRef CAS PubMed; (f) S. Shanmugaraju and P. S. Mukherjee, Chem.–Eur. J., 2015, 21, 6656–6666 CrossRef CAS PubMed.
- Nanoarchitectonics deal with interaction and organisation of nanoscale structures that cause emergence of new functionality, for details see: (a) S. Ishihara, J. Labuta, W. Van Rossom, D. Ishikawa, K. Minami, J. P. Hill and K. Ariga, Phys. Chem. Chem. Phys., 2014, 16, 9713–9746 RSC; (b) K. Ariga, Q. Ji, W. Nakanishi, J. P. Hill and M. Aono, Mater. Horiz., 2015, 2, 406–413 RSC; (c) M. Aono and K. Ariga, Adv. Mater., 2016, 28, 989–992 CrossRef CAS PubMed; (d) K. Ariga, J. Li, J. Fei, Q. Ji and J. P. Hill, Adv. Mater., 2016, 28, 1251–1286 CrossRef CAS PubMed.
- (a) Y. Che, X. Yang, S. Loser and L. Zang, Nano Lett., 2008, 8, 2219–2223 CrossRef CAS PubMed; (b) Y. Liu, K.-R. Wang, D.-S. Guo and B.-P. Jiang, Adv. Funct. Mater., 2009, 19, 2230–2235 CrossRef CAS; (c) H. Peng, L. Ding, T. Liu, X. Chen, L. Li, S. Yin and Y. Fang, Chem.–Asian J., 2012, 7, 1576–1582 CrossRef CAS PubMed; (d) J. Kumpf, J. Freudenberg, S. T. Schwaebel and U. H. F. Bunz, Macromolecules, 2014, 47, 2569–2573 CrossRef CAS; (e) S. Rochat and T. M. Swager, Angew. Chem., Int. Ed., 2014, 53, 9792–9796 CrossRef CAS PubMed; (f) A. Mallick, B. Garai, M. A. Addicoat, P. S. Petkov, T. Heine and R. Banerjee, Chem. Sci., 2015, 6, 1420–1425 RSC.
- (a) A. Rose, Z. Zhu, C. F. Madigan, T. M. Swager and V. Bulović, Nature, 2005, 434, 876–879 CrossRef CAS PubMed; (b) Y. Che, D. E. Gross, H. Huang, D. Yang, X. Yang, E. Discekici, Z. Xue, H. Zhao, J. S. Moore and L. Zang, J. Am. Chem. Soc., 2012, 134, 4978–4982 CrossRef CAS PubMed; (c) W. Zhu, W. Li, C. Wang, J. Cui, H. Yang, Y. Jiang and G. Li, Chem. Sci., 2013, 4, 3583–3590 RSC; (d) K. K. Kartha, A. Sandeep, V. C. Nair, M. Takeuchi and A. Ajayaghosh, Phys. Chem. Chem. Phys., 2014, 16, 18896–18901 RSC.
- (a) K. K. Kartha, S. S. Babu, S. Srinivasan and A. Ajayaghosh, J. Am. Chem. Soc., 2012, 134, 4834–4841 CrossRef CAS PubMed; (b) V. Bhalla, H. Arora, H. Singh and M. Kumar, Dalton Trans., 2013, 42, 969–997 RSC; (c) G. Hong, J. Sun, C. Qian, P. Xue, P. Gong, Z. Zhang and R. Lu, J. Mater. Chem. C, 2015, 3, 2371–2379 RSC.
- (a) M. M. Safont-Sempere, G. Fernández and F. Würthner, Chem. Rev., 2011, 111, 5784–5814 CrossRef CAS PubMed; (b) K. Osowska and O. Miljanić, Synlett, 2011, 1643–1648 CAS; (c) C. Rest, M. Mayoral and G. Fernández, Int. J. Mol. Sci., 2013, 14, 1541–1565 CrossRef CAS PubMed.
- (a) J. R. Moffat and D. K. Smith, Chem. Commun., 2009, 316–318 RSC; (b) A. Pal, P. Besenius and R. P. Sijbesma, J. Am. Chem. Soc., 2011, 133, 12987–12989 CrossRef CAS PubMed; (c) K. L. Morris, L. Chen, J. Raeburn, O. R. Sellick, P. Cotanda, A. Paul, P. C. Griffiths, S. M. King, R. K. O. R. Reilly, L. C. Serpell and D. J. Adams, Nat. Commun., 2013, 4, 1480 CrossRef PubMed; (d) K. Sato, Y. Itoh and T. Aida, Chem. Sci., 2014, 5, 136–140 RSC.
- (a) J. van Herrikhuyzen, A. Syamakumari, A. P. H. J. Schenning and E. W. Meijer, J. Am. Chem. Soc., 2004, 126, 10021–10027 CrossRef CAS PubMed; (b) K. Sugiyasu, S. Kawano, N. Fujita and S. Shinkai, Chem. Mater., 2008, 20, 2863–2865 CrossRef CAS; (c) A. Das and S. Ghosh, Chem. Commun., 2011, 47, 8922–8924 RSC; (d) S. Prasanthkumar, S. Ghosh, V. C. Nair, A. Saeki, S. Seki and A. Ajayaghosh, Angew. Chem., Int. Ed., 2015, 54, 946–950 CrossRef CAS PubMed; (e) B. Narayan, K. K. Bejagam, S. Balasubramanian and S. J. George, Angew. Chem., Int. Ed., 2015, 13245–13249 CrossRef.
- (a) M. Kumar, K. Venkata Rao and S. J. George, Phys. Chem. Chem. Phys., 2014, 16, 1300–1313 RSC; (b) A. Das and S. Ghosh, Angew. Chem., Int. Ed., 2014, 53, 2038–2054 CrossRef CAS PubMed.
- (a) T. Aida, E. W. Meijer and S. I. Stupp, Science, 2012, 335, 813–817 CrossRef CAS PubMed; (b) L. Maggini and D. Bonifazi, Chem. Soc. Rev., 2012, 41, 211–241 RSC; (c) C. Kulkarni, S. Balasubramanian and S. J. George, ChemPhysChem, 2013, 14, 661–673 CrossRef CAS PubMed; (d) R. D. Mukhopadhyay and A. Ajayaghosh, Science, 2015, 349, 241–242 CrossRef CAS PubMed.
- For interfacial charge transfer in co-assembly, see: (a) L. Zang, Acc. Chem. Res., 2015, 48, 2705–2714 CrossRef CAS PubMed; (b) J. López-Andarias, M. J. Rodriguez, C. Atienza, J. L. López, T. Mikie, S. Casado, S. Seki, J. L. Carrascosa and N. Martín, J. Am. Chem. Soc., 2015, 137, 893–897 CrossRef PubMed.
- (a) Z. Chen, A. Lohr, C. R. Saha-Möller and F. Würthner, Chem. Soc. Rev., 2009, 38, 564–584 RSC; (b) T. F. A. de Greef, M. M. J. Smulders, M. Wolffs, A. P. H. J. Schenning, R. P. Sijbesma and E. W. Meijer, Chem. Sci., 2009, 109, 5687–5754 CAS; (c) M. M. J. Smulders, M. M. L. Nieuwenhuizen, T. F. A. de Greef, P. van der Schoot, A. P. H. J. Schenning and E. W. Meijer, Chem.–Eur. J., 2010, 16, 362–367 CrossRef CAS PubMed.
- (a) M. M. J. Smulders, A. P. H. J. Schenning and E. W. Meijer, J. Am. Chem. Soc., 2008, 130, 606–611 CrossRef CAS PubMed; (b) S. Cantekin, T. F. A. de Greef and A. R. A. Palmans, Chem. Soc. Rev., 2012, 41, 6125–6137 RSC; (c) B. Narayan, C. Kulkarni and S. J. George, J. Mater. Chem. C, 2013, 1, 626–629 RSC.
- (a) J. van Herrikhuyzen, P. Jonkheijm, A. P. H. J. Schenning and E. W. Meijer, Org. Biomol. Chem., 2006, 4, 1539–1545 RSC; (b) I. A. W. Filot, A. R. A. Palmans, P. A. J. Hilbers, R. A. van Santen, E. A. Pidko and T. F. A. de Greef, J. Phys. Chem. B, 2010, 114, 13667–13674 CrossRef CAS PubMed.
- (a) P. A. Korevaar, T. F. A. de Greef and E. W. Meijer, Chem. Mater., 2014, 26, 576–586 CrossRef CAS; (b) C. Rest, R. Kandanelli and G. Fernández, Chem. Soc. Rev., 2015, 44, 2543–2572 RSC.
- (a) F. García and L. Sánchez, J. Am. Chem. Soc., 2012, 134, 734–742 CrossRef PubMed; (b) U. Mayerhöffer and F. Würthner, Chem. Sci., 2012, 3, 1215–1220 RSC; (c) J. M. Malicka, A. Sandeep, F. Monti, E. Bandini, M. Gazzano, C. Ranjith, V. K. Praveen, A. Ajayaghosh and N. Armaroli, Chem.–Eur. J., 2013, 19, 12991–13001 CrossRef CAS PubMed; (d) C. Kulkarni, K. K. Bejagam, S. P. Senanayak, K. S. Narayan, S. Balasubramanian and S. J. George, J. Am. Chem. Soc., 2015, 137, 3924–3932 CrossRef CAS PubMed.
- A nucleation–elongation model was proposed for PBI dyes linked to tris(dodecyloxy)benzamide with ethyl, propyl and pentyl spacer groups. This study demonstrates the importance of the alkyl spacer length on determining the self-assembly pathways of H-bonded PBI dyes. For details, see: (a) S. Ogi, V. Stepanenko, K. Sugiyasu, M. Takeuchi and F. Würthner, J. Am. Chem. Soc., 2015, 137, 3300–3307 CrossRef CAS PubMed; (b) S. Ogi, V. Stepanenko, J. Thein and F. Würthner, J. Am. Chem. Soc., 2016, 138, 670–678 CrossRef CAS PubMed.
- (a) M. P. Lightfoot, F. S. Mair, R. G. Pritchard and J. E. Warren, Chem. Commun., 1999, 1945–1946 RSC; (b) Y. Yasuda, E. Iishi, H. Inada and Y. Shirota, Chem. Lett., 1996, 575–576 CrossRef CAS; (c) P. J. M. Stals, J. C. Everts, R. de Bruijn, I. A. W. Filot, M. M. J. Smulders, R. Martín-Rapún, E. A. Pidko, T. F. A. de Greef, A. R. A. Palmans and E. W. Meijer, Chem.–Eur. J., 2010, 16, 810–821 CrossRef CAS PubMed.
- B. Rybtchinski, L. E. Sinks and M. R. Wasielewski, J. Phys. Chem. A, 2004, 108, 7497–7505 CrossRef CAS.
- (a) Y. Che and L. Zang, Chem. Commun., 2009, 5106–5108 RSC; (b) B.-P. Jiang, D.-S. Guo and Y. Liu, J. Org. Chem., 2010, 75, 7258–7264 CrossRef CAS PubMed.
Footnote |
| † Electronic supplementary information (ESI) available: Materials and methods, synthesis procedures and characterization data of the compounds, details of the isodesmic and nucleation–elongation models, and additional figures. See DOI: 10.1039/c6sc00629a |
| This journal is © The Royal Society of Chemistry 2016 |

