
 Open Access Article
 This Open Access Article is licensed under a
 Creative Commons Attribution 3.0 Unported Licence
Highly efficient electrochemical reduction of CO2 to CH4 in an ionic liquid using a metal–organic framework cathode†
Xinchen
Kang
,
Qinggong
Zhu
*,
Xiaofu
Sun
,
Jiayin
Hu
,
Jianling
Zhang
,
Zhimin
Liu
and
Buxing
Han
*
Beijing National Laboratory for Molecular Sciences, Key Laboratory of Colloid and Interface and Thermodynamics, Institute of Chemistry, Chinese Academy of Sciences, Beijing 100190, China. E-mail: qgzhu@iccas.ac.cn; hanbx@iccas.ac.cn
First published on 2nd October 2015
Abstract
Highly efficient electrochemical reduction of CO2 to CH4 is of great importance, but is challenging. Herein, Zn–1,3,5-benzenetricarboxylic acid metal–organic frameworks (Zn–BTC MOFs) deposited on carbon paper (CP) were used as cathodes in electrochemical reduction of CO2 using ionic liquids (ILs) as the electrolytes, which was the first work on combination of a MOF electrode and an pure IL electrolyte in the electrochemical reduction of CO2. It was found that the efficiency of the reaction depended strongly on the morphology of the Zn-MOFs. Compared with the commonly used metal electrodes, the electrochemical reaction showed much higher selectivity to CH4 and current density, and the overpotentials for CH4 is much lower. The excellent combination of the MOF cathodes and ILs opens a way for reduction of CO2 to CH4 effectively.
Introduction
Electrocatalysis combines the advantages of efficient conversion of electrical energy into chemical energy with the convenience and stability of heterogeneous catalysis, which has received much attention.1 Transformation of CO2 into useful chemicals and fuels is very attractive because it is a cheap and renewable carbon source, but is very difficult because CO2 is thermodynamically stable and kinetically inert.2 Electrochemical reduction is a promising method in CO2 transformation.3 It can be transformed into various products, such as CO, acids, alcohols and hydrocarbons.4 Electrochemical reduction of CO2 to CH4 is an alternative route for synthesizing energy-rich and clean fuels, which however currently suffers from low activity and poor selectivity.5Metal–organic frameworks (MOFs) represent a class of hybrid materials comprised of ordered networks formed via combining metal ions with organic ligands.6 MOFs are widely studied for gas storage and capture,7 separation,8 drug delivery9 and catalysis.10 In addition, MOFs have been used as efficient electrodes in fuel cell systems11 and reduction of CO2 in aqueous or organic electrolytes.12
Ionic liquids (ILs) have attracted considerable attention owing to their unique properties, such as low melting point, negligible vapor pressure, high ionic conductivity, high chemical stability, and adjustable physical and chemical properties.13 Applications of ILs in different fields have been studied extensively,14 including those in material synthesis15 and electrochemistry as electrolytes.16
The electrodes and electrolytes are crucial in electrocatalysis, and different electrodes and electrolytes can induce different products. Exploring innovative combination of catalysts and electrolytes is a very interesting topic of great importance. Herein, we conducted the first work on the electrochemical reduction of CO2 in MOF electrode/IL electrolyte system. It was found that the combination of MOF electrodes and ILs was very effective for the electrochemical reduction of CO2 to CH4, and the morphology of MOFs and the properties of the ILs affected the current density and selectivity to CH4 significantly.
Results and discussion
Zn-MOFs can be synthesized easily by coordination of Zn2+ and 1,3,5-benzenetricarboxylic acid (H3BTC) in solution.17 In this work, we prepared the Zn-MOFs in the mixed solvent consisting of 75 wt% 1-dodecyl-3-methylimidazolium chloride (C12mimCl) and 25 wt% glycerol. The mass fractions of ZnCl2 (x) in the C12mimCl + glycerol + ZnCl2 system were 0.17, 0.29, 0.38, 0.44, 0.50, respectively. The powder X-ray diffraction (XRD) patterns of the Zn-MOFs are illustrated in Fig. 1. The results indicate that the XRD patterns of the MOFs synthesized at x = 0.17, 0.29, 0.38 are similar to that of the reported Zn-MOF.18 However, at the larger x values, the Zn-MOFs showed lower crystallinity (Fig. 1). The scanning electron microscopy (SEM) images of the Zn-MOFs are shown in Fig. S1.† The Zn-MOFs had the rod-like morphology at smaller x value, and became shorter and thicker with increasing ZnCl2 mass fraction. When the mass fraction of ZnCl2 reached 0.38, the Zn-MOFs had sheet-like morphology. The Zn-MOFs were spherical with further increasing the mass fraction of ZnCl2. It is well known that there existed ordered aggregates in ILs systems.15 In this work, small angle X-ray scattering (SAXS) technique was used to study the microstructures of the synthetic media.15c The results indicated that the domains in the solution varied from rod-like to sheet-like and to spherical with the increase of x values (Fig. S1†). This demonstrates that the morphologies of the Zn-MOFs are similar to that of the domains in the solutions in which they were formed. The detailed discussion on the Zn-MOF formation and shape control are given in the ESI† in combination with SAXS study (Fig. S1–S3† and the related discussion). | ||
| Fig. 1 XRD patterns of the Zn-MOFs synthesized at x = 0.17 (a), 0.29 (b), 0.38 (c), 0.44 (d) and 0.50 (e). | ||
We prepared the Zn-MOF/CP cathodes by depositing Zn-MOFs on the CP using the electrophoretic deposition (EPD) method.19 The principle of the EPD method is shown schematically in Fig. 2a and the procedures are discussed in detail in the ESI.† The Zn-MOFs synthesized can be easily deposited on CP cathode with lower voltage and short time using the electrophoretic deposition (EPD) method, the main reason is that the Zn-MOFs have partial charge on the surface due to the synthetic media.19 From the SEM images (Fig. 2b–d), it can be clearly seen that the Zn-MOF/CP cathode prepared using the Zn-MOF synthesized at x = 0.38 had smooth surface with a thickness of about 10 μm. The Zn-MOF before and after EPD were characterized by X-ray photoelectron spectroscopy (XPS) (Fig. S4†). The two peaks at 1021.9 eV and 1045.1 eV, which are assigned to the 2p3/2 and 2p1/2 components, respectively, were not changed in the EPD process, indicating that the Zn-MOF was stable in the process. The SEM images of the surface and thickness of Zn-MOF/CP cathodes prepared using the Zn-MOFs synthesized at different x values are shown in Fig. 3. The thicknesses of the Zn-MOFs on cathodes were also about 10 μm, however the cathodes prepared using Zn-MOFs synthesized at x = 0.44 and 0.5 had irregular surface. The morphologies of Zn-MOF/CP cathodes after EPD process (Fig. 2 and 3) were similar with the as-synthesized Zn-MOFs (Fig. S1†), indicating the EPD process can not destroy the morphology of Zn-MOFs. The electrochemical surface areas of the Zn-MOF/CP cathodes prepared using Zn-MOFs synthesized at x = 0.17, 0.29, 0.38, 0.44 and 0.50 were examined by studying the redox reactions using cyclic voltammetry (CV) shown in Fig. S5,† which were 0.40 cm2, 0.47 cm2, 1.34 cm2, 1.05 cm2 and 0.67 cm2, respectively. The Zn-MOF/CP cathode prepared using the Zn-MOF synthesized at x = 0.38 had largest electrochemical surface area because mainly of its sheet-like structure.
 | ||
| Fig. 2 The schematic diagram of fabrication procedure and SEM images of Zn-MOF/CP cathode using the Zn-MOF synthesized at x = 0.38. (a) Schematic diagram of fabrication procedure. (b) SEM image to show the thickness Zn-MOF on the CP. (c) SEM image of the surface. (d) Amplified SEM image of the surface. | ||
 | ||
| Fig. 3 The SEM images of the morphologies of Zn-MOF/CP cathodes (a–d) and the thickness of the Zn-MOF (e–h) fabricated by EPD method. The Zn-MOF/CP cathodes were prepared using Zn-MOFs synthesized at x = 0.17 (a and e), 0.29 (b and f), 0.44 (c and g) and 0.5 (d and h). | ||
CO2 reduction activities of different Zn-MOF/CP cathodes were investigated in CO2-saturated and N2-saturated IL 1-butyl-3-methylimidazolium tetrafluoroborate (BmimBF4), and the CV curves are shown in Fig. 4a. The reduction peak at about −2.2 V vs. Ag/Ag+ can be observed for the CO2-saturated system, while current density of the N2-saturated system was negligible, indicating the reduction of CO2. The results in Fig. 4a also demonstrate that the morphology of the Zn-MOFs affected the current density significantly. The sheet-like Zn-MOF synthesized at x = 0.38 showed highest current density. To explore the kinetic effect of Zn-MOFs, the electrochemical impedance spectroscopy (EIS) was conducted to study the features of the Zn-MOF/CP electrodes in BmimBF4, and the detailed discussion are provided in the ESI (Fig. S6–S8 and Tables S1 and S2†). The EIS result confirms that charge transfer can easily occur on the Zn-MOFs surface. The Zn-MOF/CP cathode prepared using Zn-MOF synthesized at x = 0.38 had the lowest charge transfer resistance (Rct) value due to the sheet-like structure with highest electrochemical surface area as discussed above.
 | ||
| Fig. 4 CO2 reduction performance of Zn-MOF/CP cathodes. (a) CV traces. (b) Current density profiles. (c) Tafel plot for CH4 of the Zn-MOF/CP cathode using Zn-MOF synthesized at x = 0.38. | ||
In order to confirm the electrocatalytic response shown in Fig. 4a, the controlled potential electrolysis (CPE) experiments were carried out. The electrolysis device is shown schematically in Fig. S9.† The current densities using different Zn-MOF/CP cathodes are exhibited in Fig. 4b, which shows that the current densities did not decrease with time in the electrolysis, suggesting that the Zn-MOF electrode and the IL were stable. The CV and CPE using CP as cathode were also studied (Fig. S10†). The CP cathode produced much lower current density than Zn-MOF/CP cathode. The Zn-MOF/CP cathodes prepared from the sheet-like Zn-MOF synthesized at x = 0.38 generated highest current density due to its largest electroactive surface area. Therefore, CO2 reduction using this cathode was further studied, and the results are discussed in the following.
After electrolysis of 2 h at −2.2 V vs. Ag/Ag+, the gaseous product in the headspace was collected and analyzed by gas chromatography (GC), and the liquid mixture was analyzed by 1H-NMR to quantify liquid products (Fig. S11†). There was no product found in the liquid phase. CH4 was the dominate product in the gas phase with small amount of CO and H2. High selectivity to CH4 is very difficult to realize using conventional electrolysis systems. We also conducted the electrolysis under different potentials, and the amount of CH4 (ACH4) is shown in Fig. 5a. It can be clearly seen that CH4 production rate increased dramatically at the potentials less negative than −2.2 V vs. Ag/Ag+, and rose very slowly at the potentials more negative than −2.2 V vs. Ag/Ag+. Therefore, electrolysis under −2.2 V vs. Ag/Ag+ was most suitable for CH4 production. CH4 began to generate at −1.95 V from extrapolation method using the current densities for CH4 under different potentials (Fig. 5b). The distinct pre-feature (Fig. 4a) at the potential less negative than −1.95 V vs. Ag/Ag+ was originated mainly from the generation of CO. The overpotential for CH4 was 0.25 V for this process at −2.2 V vs. Ag/Ag+ with the current density of 3.1 mA cm−2. Moreover, the data from Tafel plot (Fig. 4c), which was obtained by electrolysis voltage, was linear in the range of η = 0.19–0.37 V with the Tafel slope of 146 mV decade−1, indicating a rate-determining initial electron transfer to CO2 to form an adsorbed CO2˙− intermediate.20 XPS spectra of the Zn-MOF were given before and after the electrolysis in Fig. S4.† The results demonstrated that the spectra did not change notably, further indicating the excellent stability of the Zn-MOF/CP cathode. In addition, the electrolyte was also stable according to the 1H-NMR spectra (Fig. S11†).
 | ||
| Fig. 5 (a) Amount of CH4 (ACH4, volume at standard temperature and pressure) generated in 2 h under different potentials. (b) Current densities for CH4 under different potentials and the equilibrium potential can be obtained by extrapolation method. | ||
The property of electrolytes often influences an electrochemical process significantly. It was reported that imidazolium based ILs can interact with CO2 by physical absortption,21 and the ILs can serve as both robust electrolytes and CO2 activation promoters.22 In addition, they have wide electrochemical windows and good conductivity.23 Therefore, in this work, some other typical imidazolium based ILs were also used as the electrolytes in the electrolysis to reduce CO2, including 1-butyl-3-methylimidazolium trifluoromethanesulfonate (BmimOTf), 1-butyl-3-methylimidazolium hexafluorophosphate (BmimPF6) and 1-butyl-3-methylimidazolium perchlorate (BmimClO4). The CV traces and current density profiles are shown in Fig. 6, and the total current densities and faradaic efficiencies for CH4, CO and H2 are listed in Table 1. The ILs containing fluorine such as BmimBF4, BmimPF6 and BmimOTf exhibited much higher jtot than the ILs without fluorine, which is partially because fluorine has strong interaction with CO2.24 The viscosities of the ILs also affected the jtot, as can be known from Table 1. We also conducted the electrolysis using the Zn-MOF electrode combined with other electrolytes, including DMF containing 0.01 M tetrabutylammonium tetrafluoroborate (TBABF4), MeCN containing 0.1 M tetrabutylammonium hexafluorophosphate (TBAPF6), and MeCN containing 0.1 M BmimBF4, and results are listed in Table S3.† The results show that the faradaic efficiency for CH4 was very low when these electrolytes were used, indicating that imidazolium based ILs were crucial for the very high selectivity to CH4.
 | ||
| Fig. 6 CV traces (A) and current density profiles at an applied potential of −2.2 V vs. Ag/Ag+ (B) using different kinds of ILs as electrolytes: (a) BmimBF4; (b) BmimOTf; (c) BmimPF6; (d) BmimClO4. | ||
| Entry | Electrolytes | η [cp] | j tot [mA cm−2] | FECH4 [%] | FECO [%] | FEH2 [%] |
|---|---|---|---|---|---|---|
| a The Zn-MOF/CP cathode was prepared using Zn-MOF synthesized at x = 0.38 for reduction of CO2. b Viscosity of ILs at 25 °C. The data was obtained from the Centre of Green Chemistry and Catalysis, LICP, CAS. | ||||||
| 1 | BmimBF4 | 140 | 3.1 ± 0.5 | 80.1 ± 6.6 | 7.9 ± 2.6 | 12.0 ± 3.3 |
| 2 | BmimOTf | 93 | 2.1 ± 0.3 | 85.4 ± 3.2 | 4.6 ± 1.2 | 10.0 ± 2.5 |
| 3 | BmimPF6 | 366 | 1.6 ± 0.3 | 87.7 ± 5.1 | 5.4 ± 2.0 | 6.9 ± 3.0 |
| 4 | BmimClO4 | 48 | 0.5 ± 0.2 | 88.3 ± 3.8 | 6.8 ± 2.1 | 4.9 ± 1.0 |
Metal electrodes are commonly used to reduce CO2. In this work, we carried out the electrolysis using Au, Ag, Pt, Fe, Zn, and Cu cathodes in BmimBF4 at different voltages as well. The metal electrodes used were polished metal foils with bulk structure, therefore the effect of the surface structure can be ignored. The jtot and partial current densities of CH4 (jCH4), CO (jCO) and H2 (jH2) over the potential range from −1.9 V to −2.5 V vs. Ag/Ag+ are compared with the results obtained from the Zn-MOF cathode in Fig. 7. The CVs of different metal cathodes are shown in Fig. S12,† and the principal product, linear range in Tafel plot and Tafel slope for their main product are provided in Table S4.† Obviously, the jtot and the selectivity to CH4 of the Zn-MOF/CP system were much larger than that of the metal cathode systems at the same voltage, suggesting that the Zn-MOF electrode was also very important for the high efficiency in producing CH4. The potential was less negative using Zn-MOF/CP cathode than metal cathodes to reach the same current density of CH4, indicating that the Zn-MOF/CP cathode was more active for CH4 generation. For comparison, Table S5† lists the CH4 selectivity reported in the literature for the electrochemical reduction of CO2. The data indicate that the selectivity to CH4 in our work was the highest. The product contained 85% CO and 15% H2 when CP was used as the cathode in BmimBF4 at −2.2 V vs. Ag/Ag+, further indicating that the Zn-MOFs played a key role for producing CH4. These results demonstrate that the Zn-MOF/CP cathode and the IL BmimBF4 are excellent combination for producing CH4 from electrochemical reduction of CO2.
 | ||
| Fig. 7 Current densities obtained from of the Zn-MOF/CP cathode prepared using Zn-MOF synthesized at x = 0.38 and various metal cathodes. (a) Total current densities. (b) Partial current densities of CH4. (c) Partial current densities of CO. (d) Partial current densities of H2. | ||
As discussed above, both Zn-MOF cathodes and imidazolium based IL electrolytes are crucial for the high yield of CH4. The Zn-MOF/CP cathodes and imidazolium based IL electrolytes are excellent combination for producing CH4. In addition, the current density reached the highest value using Zn-MOF/CP cathode prepared using Zn-MOF synthesized at x = 0.38 in BmimBF4.
The high electrochemical activity of the Zn-MOFs in BmimBF4 results partially from the facts that the imidazolium based ILs containing fluorine can absorb and activate CO2,24 and the Zn-MOFs are porous materials, which benefits gas adsorption.7 The Zn-MOFs were synthesized in imidazolium based IL mixture, which therefore has very good compatibility with ILs, which helps driving the reaction.16 In addition, it is reported that Zn-MOFs are efficient selective adsorbent for different gases.17 At present, there is no method to determine the gas adsorption amount on solid surface in the presence of a liquid, so we determined the adsorption amounts of the gases in the absence of IL in order to get some indirect evidence to discuss the interactions between the gases and the electrode, and the adsorption properties of the Zn-MOF for CO2, CO, CH4 at 298 K (Fig. 8) were studied. The adsorption amounts of CO2, CO, and CH4 on the Zn-MOF at 1 atm and 298 K are 9.7 cm3 g−1, 3.9 cm3 g−1, and 1.0 cm3 g−1, respectively, indicating that Zn-MOF had much stronger adsorption for CO2 and CO than for CH4. Furthermore, only CO can be detected at the potential less negative than −1.95 V vs. Ag/Ag+, and CH4 began to generate at −1.95 V and became dominate product soon (Fig. 5b), suggesting that CH4 was derived from CO. CO2 was absorbed on the surface of Zn-MOFs and was reduced to CO. Most of the CO molecules generated tended to be further reduced to CH4 because the interaction between Zn-MOF and CO is stronger than that between Zn-MOF and CH4.
 | ||
| Fig. 8 The adsorption curves of CO2 (a), CO (b) and CH4 (c) at 298 K on the Zn-MOF synthesized at x = 0.38. | ||
On the basis of the results of this work and the knowledge in the literature, the possible pathway for electrochemical reduction of CO2 to CH4 using Zn-MOF/CP cathodes in imidazolium based ILs can be discussed briefly, which is shown schematically in Fig. 9. In the electrolysis, some imidazolium cations were adsorbed on the Zn-MOF surface after the Zn-MOF/CP cathode immersed in the IL electrolyte. Thus, CO2 molecules were captured by the IL adsorbed on the Zn-MOF surface. One electron was transferred to a CO2 molecule and forms CO2˙− intermediate, and then the CO2˙− intermediate took another electron and yields a CO molecule. In this step, the conductive Zn-MOF transferred electron to CO2, and imidazolium base ILs helped driving the transformation of CO2 to CO2˙− intermediate. CO could be desorbed from the surface of Zn-MOF or be further reduced by six electrons to generate CH4.4d Due to the larger adsorption capacity of CO than CH4 on the Zn-MOF as discussed above, the CO molecule preferred to be adsorbed on the Zn-MOF surface to be further reduced to CH4. More detailed mechanism is very interesting, but is challenging.
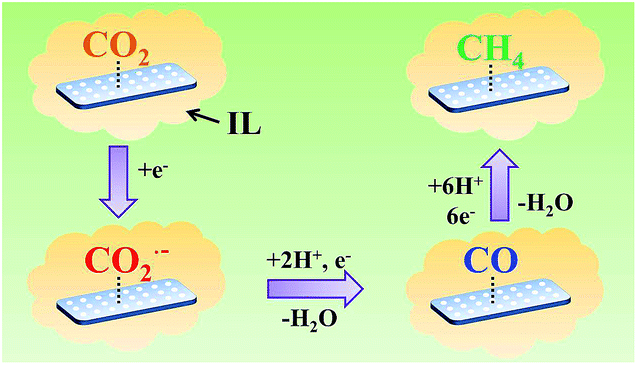 | ||
| Fig. 9 The possible pathway for electrochemical reduction of CO2 to CH4 on Zn-MOF/CP cathode in ILs. | ||
In summary, the Zn-MOF/CP cathodes and IL electrolytes have been combined for electrochemical reduction of CO2 to CH4. The morphology of the Zn-MOFs has significant effect on the electrochemical reaction. The sheet-like Zn-MOF has the highest activity in the CO2 reduction due to its largest electroactive surface areas, and the imidazolium based ILs with fluorine are more effective electrolytes because fluorine has stronger interaction with CO2. The Zn-MOF based cathodes and the ILs are excellent combination for the efficient and selective reduction of CO2 to CH4. The selectivity of CH4 can be higher than 80% at a current density of higher than 3 mA cm−2 with an overpotential of 0.25 V. We believe that integration of MOF-based electrodes and ILs provides many opportunities for exploring efficient electrochemical reactions.
Experimental section
Materials
ILs, C12mimCl (purity > 99%), BmimBF4 (purity > 99%), BmimOTf (purity > 99%), BmimPF6 (purity > 99%) and BmimClO4 (purity > 99%) were purchased from the Centre of Green Chemistry and Catalysis, LICP, CAS. Organic salts TBABF4 (purity > 99%) and TBAPF6 (purity > 99%) were also obtained from this company. ZnCl2 (A. R. grade), KCl (A. R. grade), K3Fe(CN)6 (A. R. grade), glycerol (A. R. grade), acetonitrile (A. R. grade), methanol (A. R. grade), DMF (A. R. grade), metal foils (Au, Ag, Pt, Fe, Zn and Cu, purity > 99.99%) were provided by Sinopharm Chemical Reagent Co., Ltd, P. R. China. 1,3,5-Benzenetricarboxylic acid (H3BTC, purity > 99%) were obtained from J & K Scientific Ltd. Toray Carbon Paper (CP, TGP-H-60, 19 × 19 cm) and Nafion N-117 membrane (0.180 mm thick, ≥0.90 meg g−1 exchange capacity) were purchased from Alfa Aesar China Co., Ltd. Before used, the ILs were dried in vacuum oven at 80 °C for 48 h and the water content was less than 0.1 wt% as determined by Karl-Fischer method.25Zn-MOFs synthesis
The procedures to synthesize the Zn-MOFs were similar to that reported previously.26 In a typical experiment, 15 g C12mimCl, 5 g glycerol, desired amount of ZnCl2 and 0.8 g H3BTC were added into a two-necked round-bottomed flask, and the mixture was stirred vigorously at 80 °C for 72 h. After the reaction, the obtained mixture containing the materials was mixed with 50 mL ethanol and then centrifuged with a speed of 5000 rpm. The obtained Zn-MOFs were washed with ethanol for 10 times and dried in a vacuum oven at 60 °C for 24 h.SAXS study
SAXS experiments were carried out at Beamline 1W2A at the Beijing Synchrotron Radiation Facility. The apparatus and the procedures were similar to that used in previous work.15c The data were collected using a CCD detector (MAR) with maximum resolution of 3450 × 3450 pixels. The wavelength of the X-ray was 1.54 Å, and the distance of the sample to detector was 1.31 m. In a typical experiment, the sample was added into the sample cell, and the X-ray scattering data were recorded. The 2-D SAXS images were obtained from the detector and then transformed into the profiles of intensity (I) vs. wavevector (q) by the software FiT2D. The pair-distance distribution function p(r) was obtained from SAXS data by using Gnom application software.26Materials characterization
XRD analysis of the samples was performed on the X-ray diffractometer (Model D/MAX2500, Rigaka) with Cu-Kα radiation, and the scan speed was 2° min−1. The surface morphologies of the products were characterized by a HITACHI S-4800 SEM. The surface components were characterized by XPS performed on the Thermo Scientific ESCALab 250Xi using 200 W monochromated Al Kα radiation, in which the 500 μm X-ray spot was used. The adsorption isotherms of CO2, CO and CH4 of the degassed Zn-MOFs were determined at 298 K in the pressure range of 0–1 atm on a TriStar II 3020 device.Fabrication of Zn-MOF/CP cathodes and characterization
The EPD procedure was performed on DC power supply LW6020KD (Longwei Instrument (HK) Co. Ltd). Prior to experiments, the carbon paper (CP) substrate was sonicated in acetone for 10 min, followed by washing with water and ethanol, and finally dried in N2 atmosphere. The procedures were similar to that reported.19 For each series of EPD experiments, 1 mg Zn-MOF powder was dispersed in 10 mL methanol/DMF solution (the concentration of DMF was 20 wt%) prior to 10 min sonication. Then two CP substrates of the same size (0.5 cm × 0.5 cm) were used as anode and cathode, respectively. The Zn-MOF was deposited onto anode by applying a suitable constant voltage (10–50 V) of 1 hour, and the distance between electrodes was 2 cm. The as-deposited Zn-MOF films were washed with ethanol for several times and dried in vacuum oven at 80 °C for 24 h. The morphologies of the as-synthesized Zn-MOF/CP cathodes were characterized by SEM.Cyclic voltammetry (CV) study
An electrochemical workstation (CHI 6081E, Shanghai CH Instruments Co., China) was used for all CO2 reduction experiments. CV measurements were carried out in a single compartment cell with three-electrode configuration, which consisted of working electrode (e.g. Zn-MOF/CP), a platinum gauze auxiliary electrode, and Ag/Ag+ (0.01 M AgNO3 in 0.1 M TBAP–MeCN) reference electrode. The reference electrode was stabilized in a glass tube with a Luggin capillary, which was filling with corresponding catholyte. The reference electrode calibration was carried out using the method reported in the literature.16 The potential difference of the Ag/Ag+ electrode in BmimBF4 and standard hydrogen electrode (SHE) is 636 mV at 25 °C. The detailed results and the discussion are given in the ESI (Fig. S13†). Before each set of experiment, the electrolyte was bubbled with CO2 (or N2) for 30 min until CO2-saturated solution (or N2-saturated solution) was formed, which was confirmed by the fact that the CV trace was not changed with gas bubbling time. CV measurements in gas-saturated electrolyte were taken between −1.1 V and −2.5 V vs. Ag/Ag+ at a sweep rate of 20 mV s−1. For better mixing, slight magnetic stirring was applied in the process. Prior to experiments, all the metal electrodes (0.5 cm × 0.5 cm) were polished with fine sand paper and then were sonicated in acetone for 10 min, followed by washing with water and ethanol, and finally dried in N2 atmosphere.Electrochemical surface area measurement
The active surface areas in the IL may be different with that determined in the aqueous solution. However, the acceptable characterization method in ILs has not been reported. Therefore, in this work, we made the characterization using the well-accepted method as follows.11 The electrochemical surface areas of the Zn-MOF/CP electrodes were determined by steady-state cyclic voltammetry (CV) in a solution of 0.01 M [Fe(CN)6]3−/4− with 1 M KCl at a scan rate of 50 mV s−1. The electrochemical surface area was estimated according to the Randles–Sevcik equation.27EIS measurements
The measurement was performed using the Zn-MOF/CP electrodes as the reference.28 The experimental apparatus were the same as for CV measurements. The impedance spectra was recorded in IL BmimBF4 at an open circuit potential (OCP) with an amplitude of 5 mV of 10−2 to 105 Hz. The formal potential of the system was also set at −2.0 V similar to the CO2 reduction potential at the same experimental conditions. The data obtained from the EIS measurements were fitted using the Zview software (Version 3.1, Scribner Associates, USA).CO2 reduction electrolysis and product analysis
Electrolysis was performed under room temperature (25 °C) in a commonly used H-type cell with an Ag/Ag+ (0.01 M AgNO3 in 0.1 M TBAP–MeCN) reference electrode, which was similar to that used by other researchers.3,16 The apparatus was shown schematically in Fig. S9.† The cathode and anode compartments were separated by a proton exchange membrane (Nafion 117). ILs or organic solvents and H2SO4 aqueous solution (0.5 M) were used as cathodic and anodic electrolytes, respectively. The proton source was from the electrolysis of water at the anode. Before electrolysis, CO2 was bubbled through the catholyte (2 mL per min) for 30 min with stirring. Potentiostatic electrochemical reduction of CO2 was carried out with CO2 bubbling (2 mL min−1), and the gaseous product was collected in a gas bag. After a desired electrolysis time, the gaseous product in the gas bag was collected and analyzed by gas chromatography (GC, HP 4890D), which was equipped with TCD and FID detectors using helium as the internal standard, and the liquid mixture was analyzed by 1H-NMR method, which recorded on a Bruker Avance III 400 HD spectrometer in DMSO-d6 with TMS as an internal standard. The amount of CH4 and faradaic efficiency of the products were calculated on the basis of GC analysis.3b,29Multiple electrolysis experiments were run at each potential and the average current density was calculated to give the data. The products of CO2 reduction vs. hydrogen reduction were measured at each potential. The variation in partial current density vs. applied overpotential was obtained via stepped potential electrolysis. Partial current densities for CH4 production were calculated from the GC spectra every 15 minutes and averaged over 1–2 hours. The Tafel plots were constructed from these data.
Acknowledgements
The authors thank the National Natural Science Foundation of China (21133009, U1232203, 21403253, 21321063), Chinese Academy of Sciences (KJCX2.YW.H30). SAXS experiments were carried out at Beijing Synchrotron Radiation Facility.Notes and references
- J. P. Collman, N. K. Devaraj, R. A. Decréau, Y. Yang, Y. L. Yan, W. Ebina, T. A. Eberspacher and C. E. D. Chidsey, Science, 2007, 315, 1565 CrossRef CAS PubMed
.
-
(a) M. Y. He, Y. H. Sun and B. X. Han, Angew. Chem., Int. Ed., 2013, 52, 9620 CrossRef CAS PubMed
-
(a) S. A. Yao, R. E. Ruther, L. H. Zhang, R. A. Franking, R. J. Hamers and J. F. Berry, J. Am. Chem. Soc., 2012, 134, 15632 CrossRef CAS PubMed
-
(a) K. J. P. Schouten, Y. Kwon, C. J. M. van der Ham, Z. Qina and M. T. M. Koper, Chem. Sci., 2011, 2, 1902 RSC
-
Handbook of Fuel Cells: Fundamentals, Technology and Application, ed. Y. Hori, Wiley-VHC, Chichester, 2003 Search PubMed
-
(a) T. R. Cook, Y. R. Zheng and P. J. Stang, Chem. Rev., 2013, 113, 734 CrossRef CAS PubMed
-
(a) S. S. Han and W. Q. Deng, Angew. Chem., Int. Ed., 2007, 119, 6405 CrossRef
-
(a) Z. Y. Gu, C. X. Yang, N. Chang and X. P. Yan, Acc. Chem. Res., 2012, 45, 734 CrossRef CAS PubMed
- Y. Wang, J. Yang, Y. Y. Liu and J. F. Ma, Chem.–Eur. J., 2013, 19, 14591 CrossRef CAS PubMed
-
(a) J. W. Liu, L. F. Chen, H. Cui, J. Y. Zhang, L. Zhang and C. Y. Su, Chem. Soc. Rev., 2014, 43, 6011 RSC
- M. Jahan, Q. L. Bao and K. P. Loh, J. Am. Chem. Soc., 2012, 134, 6707 CrossRef CAS PubMed
-
(a) R. Hinogami, S. Yotsuhashi, M. Deguchi, Y. Zenitani, H. Hashiba and Y. Yamada, ECS Electrochem. Lett., 2012, 1, H17 CrossRef CAS
-
(a) M. Y. Lui, L. Crowhurst, J. P. Hallett, P. A. Hunt, H. Niedermeyera and T. Welton, Chem. Sci., 2011, 2, 1491 RSC
-
(a) Q. H. Zhang, S. G. Zhang and Y. Q. Deng, Green Chem., 2011, 13, 2619 RSC
-
(a) P. S. Wheatley, P. K. Allan, S. J. Teat, S. E. Ashbrooka and R. E. Morris, Chem. Sci., 2010, 1, 483 RSC
- B. A. Rosen, A. Salehi-Khojin, M. R. Thorson, W. Zhu, D. T. Whipple, P. J. A. Kenis and R. I. Masel, Science, 2011, 334, 643 CrossRef CAS PubMed
- L. Peng, J. L. Zhang, J. S. Li, B. X. Han, Z. M. Xue, B. B. Zhang, J. H. Shi and G. Y. Yang, J. Colloid Interface Sci., 2014, 416, 198 CrossRef CAS PubMed
- L. L. Xu, J. G. Cheng, K. F. Yue, Y. L. Liu, C. J. Wang and Y. Y. Wang, Z. Anorg. Allg. Chem., 2012, 638, 366 CrossRef CAS
- I. Hod, W. Bury, D. M. Karlin, P. Deria, C. W. Kung, M. J. So, M. Katz, B. Klahr, D. Jin, Y. W. Chung, T. W. Odom, O. K. Farha and J. T. Hupp, Adv. Mater., 2014, 26, 6295 CrossRef CAS PubMed
- M. Gattrell, N. Gupta and A. Co, J. Electroanal. Chem., 2006, 594, 1 CrossRef CAS
- C. Cadena, J. L. Anthony, J. K. Shah, T. I. Morrow, J. F. Brennecke and E. J. Maginn, J. Am. Chem. Soc., 2004, 126, 5300 CrossRef CAS PubMed
-
(a) D. R. MacFarlane, M. Orsyth, P. C. Howlett, J. M. Pringle, J. Z. Sun, G. Annat, W. Neil and E. I. Izgorodina, Acc. Chem. Res., 2007, 40, 1165 CrossRef CAS PubMed
- M. Galiński, A. Lewandowski and I. Stepniak, Electrochim. Acta, 2006, 51, 5567 CrossRef
-
(a) A. I. Cooper, J. D. Londono, G. Wignall, J. B. McClain, E. T. Samulski, J. S. Lin, A. Dobrynin, M. Rubinstein, A. L. C. Burke, J. M. J. Fréchet and J. M. DeSimone, Nature, 1997, 389, 368 CrossRef CAS
- X. F. Sun, Q. Q. Tian, Z. M. Xue, Y. W. Zhang and T. C. Mu, RSC Adv., 2014, 4, 30282 RSC
- W. T. Shang, X. C. Kang, H. Ning, J. L. Zhang, X. G. Zhang, Z. H. Wu, G. Mo, X. Q. Xing and B. X. Han, Langmuir, 2013, 29, 13168 CrossRef CAS PubMed
- C. X. Guo, Y. Lei and C. M. Li, Electroanalysis, 2011, 23, 885 CrossRef CAS
- D. Quezada, J. Honores, M. Garcia, F. Armijo and M. Isaacs, New J. Chem., 2014, 38, 3606 RSC
- D. Ren, Y. L. Deng, A. D. Handoko, C. S. Chen, S. Malkhandi and B. S. Yeo, ACS Catal., 2015, 5, 2814 CrossRef CAS
Footnote |
| † Electronic supplementary information (ESI) available: Fig. S1–S13 contain XRD, XPS, SEM, CVs, EIS, 1H-NMR, mechanism diagram and device diagram; Tables S1–S5 contain EIS data, electrolysis results in this work and in literatures and Tafel data. See DOI: 10.1039/c5sc03291a |
| This journal is © The Royal Society of Chemistry 2016 |