 Open Access Article
Excited-state intramolecular proton-transfer reaction demonstrating anti-Kasha behavior†
Huan-Wei
Tseng‡
a,
Jiun-Yi
Shen‡
a,
Ting-Yi
Kuo
a,
Ting-Syun
Tu
a,
Yi-An
Chen
a,
Alexander P.
Demchenko
*b and
Pi-Tai
Chou
*a
aDepartment of Chemistry, National Taiwan University, Taipei, 10617 Taiwan, Republic of China. E-mail: chop@ntu.edu.tw; alexdem@ukr.net
bPalladin Institute of Biochemistry, National Academy of Sciences of Ukraine, Kiev 01030, Ukraine
First published on 12th October 2015
Abstract
We report unusual photophysical properties observed on two newly designed 3-hydroxychromone derivatives exhibiting the excited-state intramolecular proton transfer (ESIPT) reaction. The efficiency of ESIPT reaction is greatly enhanced upon excitation with high energy quanta to Sn (n > 1) levels in low-polarity solvents. Based on detailed analyses of excitation and emission spectra as well as time-resolved emission kinetics we derive that conditions, in which this phenomenon contradicting Kasha's rule is observed, are quite different from that for observation of anti-Kasha emission.
Introduction
Kasha's rule is an ubiquitously accepted fundamental principle in photophysics and photochemistry.1 Any validation and demonstrations of its characteristic exceptions are important tools in understanding the mechanisms of excited-state reactions. This rule states that condensed-phase photoluminescence (fluorescence or phosphorescence) occurs with appreciable yield only from the lowest excited state of a given multiplicity (singlet S1 or triplet T1).2 Depending on the energy of the photon absorbed, a molecule residing in its electronic ground singlet state (S0) may be excited to any set of higher energy electronic states (denoted Sn where n > 1) and the corresponding photoluminescence should proceed only from the lowest lying excited state (S1) of the vibrationally relaxed molecules. A similar result should be observed for the triplet manifold (Tn) when emitting phosphorescence is from the T1 state. Thus, in a steady-state manner, any appreciable emission proceeds from the lowest excited energy states, being independent of the excitation energy/wavelength. The physical background behind this rule is the very rapid internal conversion (IC) and environment (such as solvent) coupled vibrational relaxation from the higher-energy states Sn or Tn to S1 or T1, which are much faster than the rates of radiative or other, non-radiative depopulation of these states.The validity of Kasha's rule has been proven in tens of thousands of fluorescence spectroscopic experiments on different fluorophore systems.3,4 Meantime, though obscure, a few exceptions to Kasha's rule became known. They are mostly referred to the observations on the appearance of characteristic short-wavelength bands in fluorescence (or phosphorescence) emission spectra at excitations to high-energy electronic states.4–6 Note that we here mainly focus on the application of Kasha's rule in the steady-state approach and eliminate the very short lived Sn (n > 1) → S0 emission occasionally reported in the femto–picosecond time-resolved spectroscopy.7–9 The latter is not resolvable in the steady-state approach mainly due to its negligible emission yield. However, the rates of emission decays are in some cases able to compete with internal conversion to the S1 state, among which prototypical examples are azulene10 and aromatic thioketones11 (see ref. 5 for a relevant review).
Importantly, Kasha's rule has been extended to a broader range of excited-state events, such as in the field of photochemical reactions. In general, since the relaxation processes leading to the S1 state population are much faster than the photochemical transformations, the extended formulation of this rule can be written as follows: “In condensed phase, polyatomic molecular entities react with appreciable yield only from the lowest excited state of a given multiplicity”.12 Meanwhile, anti-Kasha effects were reported for several photochemical reactions.13–22 These observations are fragmentary, and the regularities of the basic anti-Kasha phenomenon are still neither well understood nor predictable.6
Recently, exploring Os(II) and Au(I) complexes,13,23 we observed a new type of anti-Kasha behaviour. For these transition metal complexes the lowest lying singlet state is mainly in the π–π* configuration such that the S1 → Tn (n ≥ 1) intersystem crossing (ISC) is slow and the ratio to T1 population is low. Conversely, the higher electronically excited state in singlet manifold (Sn, n > 1) contains substantial metal-to-ligand charge transfer (MLCT) character, such that the rate of ISC is fast and is able to compete with the rate of internal conversion and/or vibrational relaxation. As a result, upon tuning the electronic excitation energy from the lowest to higher lying transitions, the phosphorescence to fluorescence intensity ratio can be dramatically increased. In other words, one could harvest more phosphorescence upon higher-lying electronic excitation, demonstrating a type of photophysical process violating Kasha rule.
With this experience, we were mulling deeply about the possibility of observing anti-Kasha phenomenon in other fundamental reactions. It can be expected that an excess electronic and vibrational energy in the excited-state molecule results not only in a local heating but can also be utilized directly in photochemical reaction. Its rate may depend on the interplay among vibrational relaxation, internal conversion and radiative or nonradiative relaxation to the ground state. Therefore, investigations by both steady-state and ultrafast time-resolved spectroscopy become feasible only if both reactant and product states are spectrally separated and highly emissive.
To fit the above criteria it is conceivable that the system exhibiting excited-state intramolecular proton transfer (ESIPT) may provide a case in point. ESIPT molecules possess an intramolecular hydrogen bond (H-bond) between the proton donor and proton acceptor, from which the proton transfer takes place upon photoexcitation, resulting in an isomer dubbed as a proton-transfer tautomer (see Fig. 1).24 This fundamental reaction has received enormous attention during the past half century and was revitalized recently due to its potential applications in optoelectronics,25 bio-imaging and sensing.26,27
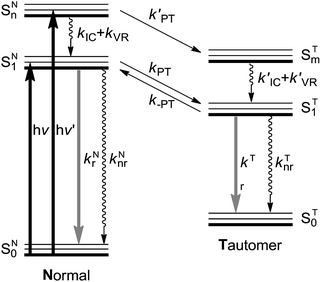 | ||
| Fig. 1 A schematic representation of the energy levels describing the formation of the tautomer (T) in the ST1 excited state caused by excitations into the SN1 and SNn states of the normal (N) form.24kr and knr: radiative and nonradiative (proton-transfer rate excluded) decay rates, respectively. kIC: the internal conversion rate, kVR: vibrational relaxation rate (solvent relaxation implicitly included in this scheme), kPT and k′PT: forward proton transfer rate, k-PT: reverse proton transfer rate. Note that for the cases of 3-HTCA and 3-HTC-DiCNk-PT is virtually zero. Please see text for detailed explanations. | ||
The testing of anti-Kasha behaviour in the ESIPT reaction can be based on the reaction scheme depicted in Fig. 1. When the molecule in its normal (N) form is photo-excited with a high energy photon, the higher electronic excited state (SNn) is populated. The molecule may either (1) relax through internal conversion (IC) and vibrational relaxation (VR) with a rate constant kIC and kVR and then undergo proton transfer (kPT) to give the tautomer (T) form (normal pathway) or (2) undergo proton transfer directly with a rate constant of k′PT (anti-Kasha pathway). The two pathways, SNn → SN1 → ST1 and SNn → STm → ST1 (note that n and m are not necessarily the same number) may compete and the interplay of kinetic factors should control the outcome of the photochemical process.
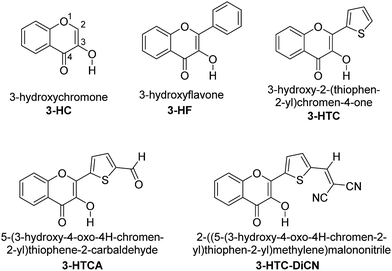
Our long-standing investigation and experiences in ESIPT lead us to propose that the derivatives of 3-hydroxychromone (3-HC, Chart 1) might satisfy the requirements for systems to be studied. During the past two decades, extensive substituent modulation has been carried out for 3-HCs to probe ESIPT coupled charge-transfer reaction. The intrinsic ESIPT event for 3-HC proceeds with ultrafast (<150 fs) dynamics that is coherent with low frequency vibrational motion along the pathway of ESIPT reaction.28,29 The overall ESIPT rate, however, can be retarded due to formation of reaction barriers that can be both intramolecular and intermolecular, involving solvation dynamics and formation of excited-state intramolecular charge transfer (ESICT) states.27,30 These results, in combination with the support from ab initio calculations,31 demonstrate the importance of the relationship between the dipolar vectors of various states and the involvement of solvation energetics that can modulate the overall ESIPT reaction by forming solvent-induced barriers. Also, via the variations in 3-HC heterocyclic structure and the addition of electron-donor and electron-acceptor substitutions in the fluorophore, the switching between irreversible and reversible kinetic regimes can be achieved.27,30–32 The net results of the substituent modification is thus to fine-tune the associated kinetics and thermodynamics of the reaction, allowing the two well separated fluorescence emission bands from the reactant normal (N*) and product tautomer (T*) states to be observed. They demonstrate colour-changing properties depending on the nature and location of substituent.
In this regard, the possibility of ESIPT from Sn states in 3-HC analogue 3-hydroxyflavone (3-HF, see Chart 1) has been the subject of active discussion.24,33,34 However, for different reasons, 3-HF is not a suitable molecule to demonstrate such anti-Kasha effect. It exhibits strong intermolecular hydrogen bond perturbation effects in polar media and ultrafast ESIPT rate in low polar environments that does not allow observing of emission from the reactant state. Possessing the means to modulate the proton-donating and proton-accepting power of the reactive groups27,29,30 and the distribution of electron density within the molecule35 by targeted manipulation of substituents in the 3-HC core, we should benefit from this possibility.
In this report, we strategically design a system exhibiting ESIPT that is completely different from numerous 3-HC dyes synthesized previously. Instead of anchoring an electron donating group to increase the proton accepting power of the hydrogen bonding base site (the carbonyl group), we tailor the electron-withdrawing substituent in such a way that the proton donating site decreases its electron density and increases its proton-donating ability. With this modification, one would perceive three new characteristics: (1) the charge-transfer (CT) character in the normal form is partially reduced, which should make the ESIPT reaction highly exergonic, and (2) the electron-withdrawing action increases the acidity of hydroxyl group, which must facilitate ESIPT and is expected to be a preferential relaxation route in the higher-energy excited states (vide infra). (3) Still, the weak charge transfer should couple with proton transfer. This may lead to the solvent polarization/reorganization induced barrier along the reaction,30 so that ESIPT kinetics may be slow enough to observe both normal N* and tautomer T* bands in steady-state and kinetic experiments. Note that the criterion (1) is the necessary condition for probing the anti-Kasha's effects. In other words, k-PT is virtually zero in Fig. 1 so that ESIPT is an irreversible process. Otherwise, due to the fast kPT/k-PT equilibrium, the ratiometric N* versus T* emission is always excitation wavelength independent.
On the above basis, we designed the 3-HC derivatives 5-(3-hydroxy-4-oxo-4H-chromen-2-yl)thiophene-2-carbaldehyde (3-HTCA) and 2-((5-(3-hydroxy-4-oxo-4H-chromen-2-yl)thiophen-2-yl)methylene)malononitrile (3-HTC-DiCN) (Chart 1), studied ESIPT in the higher-energy excited states, and report herein their unusual anti-Kasha photophysical behaviour.
Experimental section
Detailed synthesis and characterizations of studied compounds 3-HTCA and 3-HTC-DiCN are elaborated in the ESI.†Steady-state absorption and emission measurements in solution were recorded with a Hitachi (U-3310) spectrophotometer and an Edinburgh (FS920) fluorometer, respectively. Both wavelength-dependent excitation and emission responses of the fluorometer were calibrated. To determine the photoluminescence quantum yield in solution, 4-(dicyanomethylene)-2-methyl-6-(4-dimethylaminostyryl)-4H-pyran (DCM) or coumarin 480 in methanol, with a quantum yield of 0.44 and 0.87, respectively, served as the standards. Nanosecond lifetime studies were performed with an Edinburgh FL 900 time-correlated single photon counting system using a hydrogen-filled lamp as the excitation source. The emission kinetic traces were fitted by the sum of exponential functions with a temporal resolution of ∼300 ps via the deconvolution of instrument response function.
Ultrafast spectroscopic studies were performed by a femtosecond fluorescence up-conversion system (FOG100, CDP) pumped by a femtosecond oscillator (Tsunami, Spectra-Physics). Following the excitation by the SHG of a femtosecond pulse, fluorescence from a rotating sample cell, was collected, focused, and frequency summed in a BBO crystal, along with an interrogation gate pulse at designated delay time with respect to the pump pulse. A λ/2 waveplate was used to set the polarization between the pump and gate pulses at the magic angle (54.7°) to prevent fluorescence anisotropy contributed by solute reorientation. The instrument response function was determined by measuring the Raman scattering signal.
Results and discussion
Synthesis
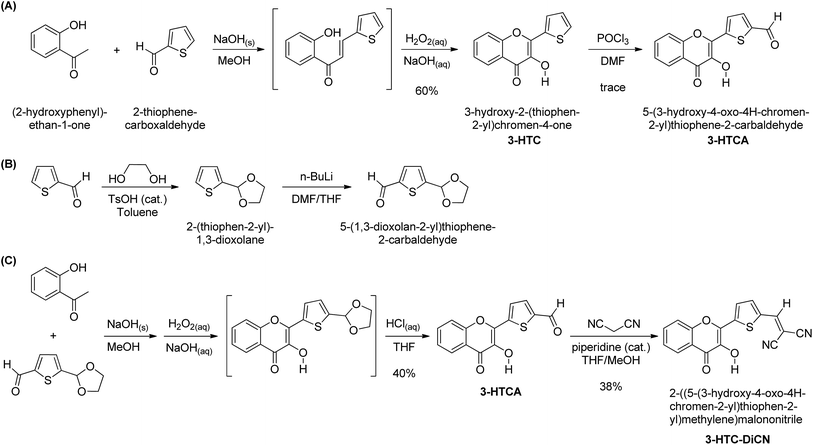
The synthetic routes for 3-HTC, 3-HTCA and 3-HTC-DiCN are shown in Scheme 1. The intermediate 3-HTC can be prepared following literature procedures (Scheme 1A).36 We attempted to synthesize 3-HTCA from 3-HTCvia the Vilsmeier–Haack reaction, but only obtained a trace amount of 3-HTCA. We then modified the synthetic route for 3-HTCA by using 5-(1,3-dioxolan-2-yl)thiophene-2-carbaldehyde.37 This molecule with a mono-protected aldehyde group can be synthesized from 2-thiophenecarbaldehyde and ethylene glycol under TsOH catalysis, followed by treating with n-BuLi and then DMF (Scheme 1B). The mono-protected aldehyde precursor (5-(1,3-dioxolan-2-yl)thiophene-2-carbaldehyde) then reacted with 2′-hydroxyacetophenone to give 3-HTCA in the aldehyde form after the deprotection of acetal. Finally, 3-HTC-DiCN was synthesized from 3-HTCAvia a condensation reaction with malononitrile catalysed by piperidine. The orange–red crystals of 3-HTC-DiCN were grown in a THF solution. The single-crystal structure (Fig. 2 and S1†) and crystallographic data (bond lengths and angles, Tables S1 and S2†) show the formation of doubly hydrogen-bonded dimers in the crystalline state. Differently, in the low polarity solution environment, the 1H NMR spectrum of 3-HTC-DiCN revealed a significantly down-field shifted signal at 10.2 ppm for the hydroxyl proton (in THF-d8, see Fig. S2†). Because 3-HTC-DiCN showed no concentration dependent 1H NMR peaks, the result supports the intramolecular H-bond formation in solution.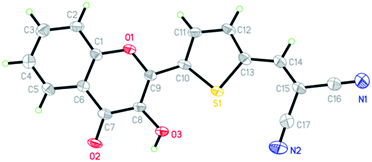 | ||
| Fig. 2 The X-ray crystal structure of 3-HTC-DiCN; thermal ellipsoids drawn at the 50% probability level. | ||
Steady-state absorption, emission and excitation spectra
The absorption, emission and excitation spectra for 3-HTCA and 3-HTC-DiCN were studied in acetonitrile and in relatively low polar solvents CH2Cl2 and benzene, in order to decrease any possible dielectric stabilization of N* state and to avoid the existence of a possible anionic form of the molecule that can appear in highly polar media.38 The two compounds show almost identical features in benzene, CH2Cl2 and acetonitrile (Fig. S3 and S4†). Instead of benzene and acetonitrile, CH2Cl2 was chosen as the solvent for the spectroscopy measurements because of its larger transparent window down to 250 nm, suitable to probe higher energy excitation.The spectra obtained at room temperature are shown in Fig. 3 and 4 and pertinent data are listed in Table 1. The S1 π–π* absorption band is observed in the near-UV–blue region and is presented by two peaks at 375 and 396 nm for 3-HTCA and at 421 and 448 nm for 3-HTC-DiCN. Their assignments are in line with published data and their red-shifted position is in line with the results on other 3-HC derivatives (e.g.3-HF34,39). The observed red shift is typical for chromophores extended and substituted at site 2 (see Chart 1).27,30 According to the band assignment presented in ref. 39, the S1 and S2 bands in 3-HF are separated by 3300 cm−1. Such ∼30 nm shifted S2 absorption band from S1 absorption origin is not resolved in studied compounds and is probably presented as a shoulder. The bands at 275 nm for 3-HTCA and 290 nm for 3-HTC-DiCN probably belong to S3 and even higher transitions. Since resolution between these bands is not ideal and the origins of higher electronic transitions may overlap with vibrational contributions to the transitions lower in energy, in our further discussion we will refer to Sn bands, meaning that n > 1.
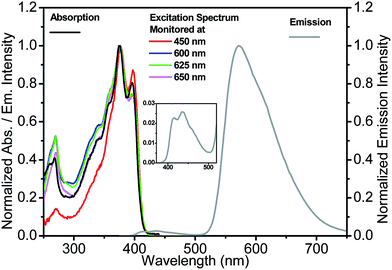 | ||
| Fig. 3 Absorption, emission (excited at 350 nm) and excitation spectra (monitored at indicated emission wavelengths) for 3-HTCA in CH2Cl2. Inset: the enlargement of normal emission for clarity. | ||
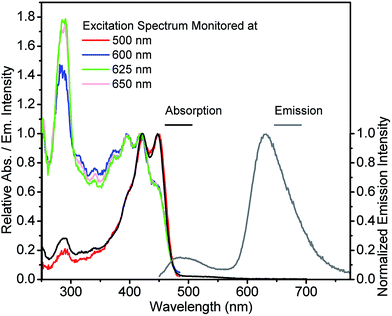 | ||
| Fig. 4 Absorption, emission (excited at 440 nm) and excitation spectra (monitored at indicated emission wavelengths) for 3-HTC-DiCN in CH2Cl2. | ||
| Compound | λ abs/nm | λ em/nm | λ ex/nm | Φ em |
|---|---|---|---|---|
| 3-HTC | 357 | 539 (T*) | 350 | 0.33 |
| 3-HTCA | 375, 396 | 435 (N*) | 300 | 0.0032 |
| 350 | 0.0064 | |||
| 375 | 0.0076 | |||
| 571 (T*) | 300 | 0.32 | ||
| 350 | 0.31 | |||
| 375 | 0.30 | |||
| 3-HTC-DiCN | 421, 448 | 490 (N*) | 300 | 0.005 |
| 350 | 0.006 | |||
| 420 | 0.007 | |||
| 636 (T*) | 300 | 0.060 | ||
| 350 | 0.030 | |||
| 420 | 0.010 | |||
The studied compounds demonstrate the expected behaviour with respect to the presence of emissions from both N* and T* bands. The major emission band located in the yellow–orange region (550–650 nm) with a strong Stokes shift is attributed to the T* band, and the weak emission band in the blue region (450–500 nm) is the N* band. The π-conjugation of thiophenyl instead of phenyl group (as in 3-HF) induces a red-shifting of both emission bands, which has been observed in previous studies.40
Commonly, the excitation spectra correspond to absorption spectra and they are independent of whether the emission is collected at the N* or T* band. This is just the indication that the ground-state origin of both emissions is the same. However, the behaviour shown in the excitation spectra of 3-HTCA (Fig. 3) and 3-HTC-DiCN (Fig. 4) is anomalous. These spectra roughly match their absorption spectra only on the longer-wavelength side. In the short wavelength region, when monitoring the N* emission band the lower intensity is unambiguously seen. This indicates that when exciting the molecules with higher energy of photons (i.e. populating the SNn state as in Fig. 1), there may exist an extra deactivation pathway, likely the proton-transfer process from SNn to STm, which competes with the SNn → SN1 internal conversion process and consequently lowers the N* emission intensity.
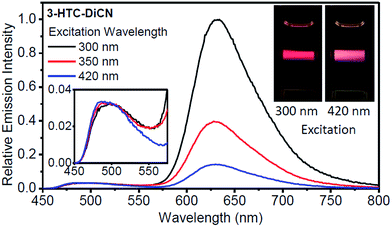
If such explanation is valid, then monitoring the T* emission band we should observe an opposite picture – a significantly increased intensity in the shorter wavelength excitation range. Indeed, as shown in Fig. 3 and 4, such an increase is obviously detected for 3-HTCA at λ < 350 nm, and becomes dramatic for 3-HTC-DiCN at λ < 400 nm. Such distribution of intensities demonstrates the increased ESIPT efficiency with the excitation of higher energy quanta. Accordingly, when we measure emission spectra as a function of excitation wavelength, we observe re-distribution of intensities, i.e. the ratiometric emission changes for N* versus T* emission bands (Fig. 5 and S5†).
Researchers have to be extremely careful in reporting such facts. Usually, a difference between the excitation and the absorption spectrum indicates the presence of more than one coexisting ground-state species, so the presence of such species as impurities may result in their contribution to emission. In our case the observed phenomenon cannot originate from any impurity due to several reasons: (1) all characterization methods (NMR, MS) indicate the purity of our samples. Also, we have purified the compounds several times and obtained the same results. (2) It is almost impossible to achieve a so dramatic Stokes shift, with UV–blue absorption and emission in orange–red range, unless it is a tautomer emission. (3) The difference in excitation spectra from absorption spectra is most clearly observed for 3-HTC-DiCN at short wavelengths (∼290–325 nm) when the emission is recorded at 625 nm (<300 nm difference). This renders a strong indication of involvement of high-energy excited states. (4) A controlled experiment is done using 3-HTC-DiCN-OMe in which the proton is replaced by a methyl group and proton transfer is prohibited. The emission and excitation spectra of 3-HTC-DiCN-OMe all look normal and are nearly identical to the absorption spectrum (Fig. S6†). (5) Occasionally, one might observe the spectral profile of the excitation spectrum being different from that of the absorption, particularly in the higher lying excited states. When no other photochemistry involved, this discrepancy can be due to the fast nonradiative decay process to the ground state, which competes with its relaxation to the emitting S1 state. The net result should be the decrease of the short wavelength intensity (contribution) to the emission. In sharp contrast, 3-HTCA and 3-HTC-DiCN show exactly opposite effect, with increased intensities at the short wavelength region. Lastly, similar to the 2-phenyl ring in 3-hydroxyflavone and its derivatives (see Chart 1), the rotation of two single bonds around the 2-thiophene ring for 3-HTCA and 3-HTC-DiCN is possible, forming different rotamers with small energy differences (populated under thermal energy). However, such rotations do not change the geometry of the rigid 3-hydroxychromone site that has been well established to be the core chromophore responsible for ESIPT. This, together with the precursor and successor types of kinetic relationship between normal and tautomer emissions (vide infra), rules out the origin of the excitation energy dependent ratiometric emission from the rotamers.
According to the above viewpoints 3-HTCA and 3-HTC-DiCN clearly demonstrate the excitation wavelength dependence in emission and the misbalance between the N* and T* species at high energy excitation, which can be considered as strong indications of anti-Kasha behaviour. It is also of note that the modulation of fluorophore electronic structure is extremely important for observing these effects. We found that prototype compound 3-hydroxy-2-(thiophen-2-yl)chromen-4-one (3-HTC, Chart 1), with the thiophene bridge but not the electron-withdrawing group, showed virtually negligible deviation from Kasha's rule (see Fig. S7†).
Emission quantum yields
If the emission quantum yields exhibit variation as a function of excitation wavelength, this could also indicate the anti-Kasha behaviour. The commonly observed independence (often stated as Kasha–Vavilov rule)12 should be observed only when there is a rapid and efficient conversion from the initially excited states to the lowest S1 or T1 state irrespective of the excitation wavelength. The relative efficiencies of excitation at different wavelengths should play no role as the quantum yield measurements simply count photons emitted as a function of photons absorbed. If the Sn (n > 1) states can emit detectable light in the steady-state measurement or participate in photochemical transformations, they become kinetically decoupled with the S1 state and are essentially ascribed to the anti-Kasha systems.5 In our case, they may display different probabilities of emission from N* and T* states depending on the excitation energy.The observed effects are illustrated in Table 1, Fig. 5 and S5.† For 3-HTC-DiCN, the T* emission quantum yield rises (from 0.010 to 0.030 then to 0.060) with the increase of excitation photon energy (decrease of wavelength from 420 to 350 then to 300 nm). At the same time, the N* emission quantum yield descends from 0.007 to 0.006 then to 0.005. These results clearly indicate that the ESIPT reaction proceeds partially from the higher electronic excited states (with shorter excitation wavelengths), which consequently generates stronger T* emission and weaker N* emission. The same trend is also observed in the emissions of 3-HTCA.
For illustrating the magnitude of these effects, we normalized intensities at the N* band and observe dramatic changes in T* band intensities, their increase with shorter wavelength excitation (Fig. 5). This difference can be visualized even with the naked eye. In the inset photo of Fig. 5 we can clearly see that the red emission of 3-HTC-DiCN is dominant when the sample is excited by higher energy photons (e.g. 300 nm), while it switches to red–white colour upon 420 nm excitation, manifesting more contribution from the N* emission.
Time-resolved spectroscopy
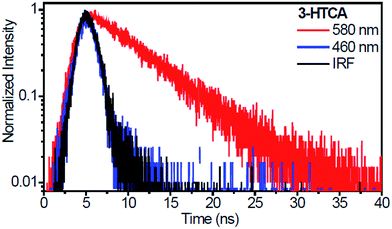
As mentioned earlier, the necessary (but not sufficient) condition for the observation of anti-Kasha effect is the absence of reversibility in ESIPT reaction.41 The presence of reverse ESIPT reaction (k-PT in Fig. 1) with the rate faster than the emission would re-populate SN1 state, masking the SNn → STm kinetics. Reversible and irreversible excited-state reactions can be distinguished based on analysis of their emission decay kinetics: for irreversible reaction the long component of emission decay of its product should be much longer than the decay from initially excited state N*, whereas the rate of ESIPT reaction populating the T* state should be distinguished as a short rising component of T* emission decay.42The time-resolved emission kinetics of 3-HTCA and 3-HTC-DiCN in CH2Cl2 obtained using the time-correlated single photon counting technique, shown in Fig. 6 and S8,† conform to this behaviour. The population decay lifetimes of 3-HTCA and 3-HTC-DiCN monitored at the T* band are rather long, about 6.1 ns and 2.4 ns, correspondingly, whereas the N* emission kinetic is too fast to be resolved in our sub-nanosecond instrument conditions. This fact demonstrates immediately that the equilibrium between the normal and tautomer forms is not achieved on the time scale of emission.
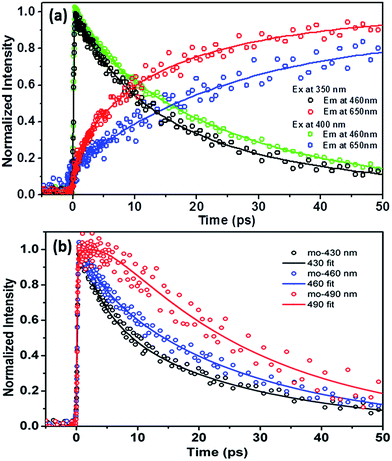
In order to resolve the early dynamics of the emission we then applied the femtosecond fluorescence up-conversion technique. For 3-HTCA, Fig. 7, S9 and S10† show the kinetics of depopulating the N* state and of populating the T* state on early picosecond time scale. The results of deconvolution of these data into individual components are presented in Table S3.† As shown in Fig. 7b, upon 350 nm excitation and monitoring at the normal emission at the shorter wavelength of 430 nm, the relaxation dynamics could be well fitted by double exponential decay of 3.8 ± 0.3 and 25.2 ± 3.2 ps (an average of four replicas). Increasing the monitoring wavelength from 430 to 460 nm the short decay component becomes slightly longer (4.6 ± 0.7 ps), while the long one within experimental error remains virtually unchanged (25.8 ± 3.9 ps, an average of five replicas). It is also of note that the increase of lifetime of the short decay component is also accompanied by a decrease of its contribution in pre-exponential factor (see Fig. 7b and Table S3†). Upon monitoring at the very red edge of the normal emission of ∼490 nm, the short decay component seems disappearing. Instead, a rise component looms, which is qualitatively fitted to be ∼2.8 ps, followed by a long decay of (25.5 ± 2.8 ps, an average of six replicas). Upon 400 nm excitation, similar wavelength dependent kinetics of the normal emission (monitored at 430, 460 and 490 nm) are observed (see Fig. S9a†), consisting of a short decay component, which decreases its pre-exponential factor upon increasing the monitored wavelength, and becomes semi-qualitatively a rise component at ∼490 nm. Moreover, independent of the monitored normal emission wavelength, a long decay component of ∼26 ps is always resolved.
As for the tautomer emission, upon 350 nm excitation double-exponential rise kinetics are obvious, which are fitted to be 6.4 ± 0.8 and 26.2 ± 3.1 ps at the 650 nm T* emission, followed by a very long population decay that essentially holds constant at the time window of 50 ps (see Fig. 7a). The population decay is further measured to be 6.1 ns using time correlated single photon counting technique. Differently, upon 400 nm excitation, as shown in Fig. 7a, the rise of the T* 650 nm emission, could be well fitted by a single-exponential rise component of 26.2 ± 3.1 ps.
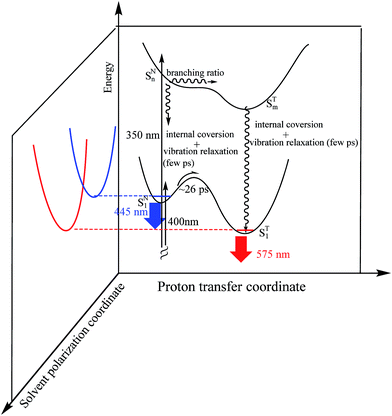
To correlate the above dynamics results with the steady-state measurement, a proposed excited-state reaction/relaxation mechanism is depicted in Fig. 8 (also see Fig. 1). The results imply that normal emission of 3-HTCA possesses charge transfer character in the excited state, such that solvent relaxation takes place. This emission solvatochromism is commonly reflected by the contribution of a short decay component of a few picoseconds due to the fast solvent reorientation at shorter emission wavelength, becoming an obscure rise component at longer emission wavelength due to its growing population. The associated dynamics are believed to overlap and overpower the dynamics of relaxation caused by the vibrational cooling via high energy excitation. Upon reaching the equilibrium polarization of the SN1 state, slow ESIPT takes place with a time constant of ∼26 ps, which is well correlated with the long rise component (∼26 ps) of the tautomer emission. The slow SN1 → ST1 ESIPT is rationalized by the different equilibrium polarization between normal SN1 and tautomer ST1 states. As a result, the solvent reorganization should channel into the SN1 → ST1 ESIPT reaction, inducing a significant barrier (see Fig. 8 for an illustrative 3D plot). The mechanism of charge-coupled proton transfer and the associated slow ESIPT dynamics have been well documented in the recent review articles.27,30
Accordingly, upon 350 nm excitation the ∼6.4 ps rise component of the tautomer emission is attributed to the harvest of the tautomer emission at higher excited states (Fig. S10 and Table S3†). For rationalization we propose a very fast ESIPT (<1 ps) in the SNn state (i.e., SNn → STm), which is able to compete with the SNn → SN1 internal conversion. This proposed mechanism is reasonable once the dipole moment between SNn and STm states is similar, and hence they possess similar equilibrium polarization, i.e. lack of solvent induced barrier. It is plausible that the frontier orbitals of certain HOMO−j or LUMO+k (integer number j and k ≥ 1) are mainly contributed by a π-delocalization around the core chromophore 3-hydroxychromone. As a result, the electron density distribution of certain higher lying states is similar to that of 3-hydroxychromone (and 3-hydroxyflavone), for which ESIPT should be ultrafast (<1 ps)27–29 due to its lack of solvent induced barrier.
The fast SNn → STm ESIPT then competes with the fast SNn → SN1 internal conversion, generating the tautomer in the highly vibronic state, which is then followed by a fast STm → ST1 internal conversion associated with few picoseconds vibrational relaxation, i.e., the vertical energy dissipation, to the tautomer lowest excited state where the tautomer emission is monitored. This mechanism well explains the observed 6.4 ± 0.8 ps rise time of the tautomer emission for 3-HTCA upon 350 nm excitation (Fig. S10†), which is essentially missing on the 400 nm excitation (Fig. S9b†).
It may be accounted that excitation to different highly excited states may give different branching ratio for the SN1versus ST1 population. This, together with slow SN1 → ST1 ESIPT, i.e., another branching ratio for SN1versus ST1 at the lowest lying state, results in the observed excitation energy dependent ratio for the normal versus tautomer emission intensity recorded in the steady-state measurement for the studied compounds. In a quantitative manner, this excitation energy dependent branching ratio can be derived based on the steady-state emission data, which will be elaborated in the next section.
3-HTC-DiCN behaves similar to those discussed for 3-HTCA above. Fig. S11a† shows the N* emission wavelength dependent kinetic traces in CH2Cl2 with 425 nm (SN1) and 350 nm (SNn) excitations. Upon 350 nm excitation, the associated N* normal emission dynamics had to be fitted by bi-exponential decay components, giving a fast decay component of 1.3–1.8 ps, depending on the monitored emission wavelength, and a slower component of 5.8 ± 0.6 ps that is independent of the emission wavelength (Table S4, Fig. S11 and S12†). Unfortunately, as for the 350 nm excitation there seems to be a loss of correlation between the relaxation dynamics of T* (650 nm, Fig. S11†) and N*. This discrepancy is due to the current experimental limitation, that is the non-negligible overlap between N* and T* emission at 650 nm. Unfortunately, further up-conversion signal acquired at >650 nm was not possible for the 350 nm excitation due to strong interference of 700 nm fundamental pulses used for frequency summation. Nevertheless, upon 425 nm excitation, a rise component of ∼6.0 ps (Table S4 and Fig. S12†) is resolved for the T* emission monitored at the red-edge (e.g. 770 nm), consistent with the longer decay component of the N* emission of 5.8 ps that is associated with the SN1 → ST1 ESIPT.
Comparison of efficiencies of ESIPT from S1 and Sn states
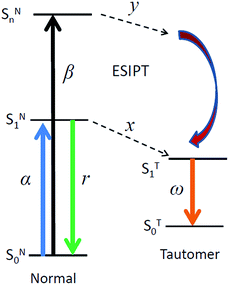
For consistent analysis of steady-state and time-resolved experimental data, in addition to the above expression of reaction rates, we re-organize the scheme in Fig. 1 by considering the distributions of efficiencies of different excited-state processes involved (Fig. 9).Here α and β in Fig. 9 are the absorbance on transitions to S1 and Sn states, x and y are efficiencies (in %) of ESIPT from these states, r and ω are the fluorescence quantum yields of normal and tautomer forms respectively. We consider that in accordance with Beer–Lambert law for the low absorbance values the fluorescence intensity I is proportional to absorbance (A) and intensity of incident light I0: I ∝ I0A. Then upon excitation to the S1 state, the intensity for normal form emission IN(α) can be expressed as:
| IN(α) ∝ I0α(1 − x)r |
Accordingly, upon excitation at the Sn state, the intensity for normal form emission IN(β) can be expressed as:
| IN(β) ∝ I0β(1 − y)(1 − x)r |
The ratio of these two intensities is:
 | (1) |
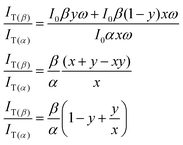
Similar equations can be derived for the tautomer emission with the assumption that SNn → STn contributes to generation of T* state species:
| IT(α) ∝ I0αxω |
| IT(β) ∝ I0βyω + I0β(1 − y)xω |
The ratio of their emission intensities is:
 | (2) |
The ratios β/α and IN(β)/IN(α) can thus be figured out from absorption spectra and excitation spectra, respectively. Similarly, IT(β)/IT(α) can be solved from the excitation spectra. Together with the known value of y, the x value can be solved. Substituting eqn (1) into eqn (2) we obtain a simple relation:
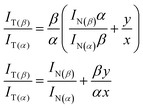 | (3) |
Using this relation we are able to estimate the efficiencies of ESIPT upon excitations to the SN1 and SNn states. The spectroscopic data taken from the results of Fig. S5† for 3-HTCA at 300 and 350 nm (SNn) and 400 nm (SN1) and of Fig. 5 for 3-HTC-DiCN at 300 and 350 nm (SNn) and 450 nm (SN1) are used in these calculations. Details of calculation are presented in the ESI† and the results are summarized in Table 2. We can clearly see that the ESIPT efficiency is higher when the molecule is excited up to the higher energy excited states.
Criteria for observing the anti-Kasha effects in ESIPT
The reasons for deviations from Kasha's rule in solution-phase photochemistry are often difficult to comprehend even in the cases when Sn → S1 internal conversion is involved only.5,6 Photochemical reactions add a new level of complexity since here the kinetics of forward and reverse reactions from multiple states have to be considered. Based on theoretical considerations,41 several criteria for observation of these effects can be formulated.(1) The photochemical reaction should be under kinetic control (kPT ≫ k-PT).42 If, on the contrary, the excited-state equilibrium between ESIPT reactant and product species is established, resulting in dual emissions from such equilibrated states, this would exclude any excitation energy dependent selectivity (vide supra). In this regard, all the compounds studied in this work conform to this criterion. In low polar solvents they demonstrate highly exergonic character of ESIPT reaction with appreciable activation barrier. Their T* form is the major emitter showing dramatically longer fluorescence decays compared to the low intensity and short decay of N* form generating the reaction product.
(2) The rate constant of ESIPT reaction from SNn state should be comparable to the rate of SNn → SN1 internal conversion (k′PT ∼ kIC). This allows the two channels populating the ESIPT product state, SNn → STm → ST1 and SNn → SN1 → ST1, to compete and the STm species generated from the SNn state increase the T* state population. The presence of this additional pathway should result in excitation-wavelength-dependent redistribution of the fluorescence intensity between two emission bands, decreasing quantum yield of N* emission and increasing of T* emission.
(3) The excited-state reaction from the SNn state(s) should proceed faster than that from the SN1 state. (If such difference is absent, the two pathways are indistinguishable and anti-Kasha kinetics should not be observed.) In our experiments the accelerated ESIPT rate on SNn excitation is demonstrated convincingly.
(4) The SN1 → ST1 ESIPT rate should be comparable (i.e., in the same magnitude) with the rates of emission and non-emissive decay of excited reactant (kPT ∼ kNr + kNnr), see Fig. 1. Only in this case we could establish a branching ratio for the N* versus T* population upon SN1 → ST1 ESIPT. Such cases are rare, and commonly for reactions in kinetic regime only T* emission is detected.43 In 3-HTCA and 3-HTC-DiCN the observation of such rare cases can be realized by the fast non-ESIPT radiationless decay rate induced by the more degree of rotational freedom on the thiophene side chain. Support of this viewpoint is given by methylation of 3-HTCA and 3-HTC-DiCN, forming 3-HTCA-OMe and 3-HTC-DiCN-OMe (see Experimental details in ESI†) where ESIPT is prohibited due to the lack of an O–H proton. Both 3-HTCA-OMe and 3-HTC-DiCN-OMe revealed very short lifetimes of 10–20 ps (see Fig. S6† for 3-HTC-DiCN-OMe) with small quantum yield (<0.01).
The cases of excited-state transformations discussed here are probably quite different from the conventional criteria for observing the anti-Kasha effect, i.e., the appreciable steady-state emission from highly excited states5 (vide supra). The Sn emission should be observed only when the non-emissive IC to S1 state is of comparable rate or even slower than the emissive and non-emissive decays from S1 to the ground state (kIC < kNr, kNnr). In contrast, the ESIPT reaction from the SNn state competing with both emissive and non-emissive deactivation of this state may not influence relative probabilities of these pathways. In other words, anti-Kasha photochemistry can be realized in the systems satisfying the above criteria, which are not necessary to demonstrate the anti-Kasha emission, i.e. the emission from the higher lying electronic state (Sn, n > 1).
Conclusions
In this study, we strategically designed and synthesized a series of new thiophenyl 3-hydroxychromone derivatives 3-HTCA and 3-HTC-DiCN. They exhibit classical ESIPT reaction and allow observing the switching between the two reactant and product emissive forms of this reaction in a kinetically controlled regime. For 3-HTCA and 3-HTC-DiCN, we describe unusual behaviour in a display of ESIPT reaction on excitation at shorter wavelengths than the S1 band. The fluorescence intensity is re-distributed from the band belonging to initially excited normal reactant (N*) species to a reaction product phototautomer (T*) band demonstrating an increased rate of ESIPT reaction. Accordingly, the excitation spectra deviate from absorption spectra in a short-wavelength region in opposite directions when recorded at N* and T* emission bands. Moreover, a dramatic decrease of fluorescence quantum yield of N* emission and correspondent rise of T* emission quantum yield is observed.These results are in apparent contradiction to Kasha's rule. They deserve proper explanation and specifying the conditions in which such phenomenon can be observed. The sub-nanosecond time-resolved experiments demonstrate that no equilibrium between the normal form and the tautomer form is achieved during fluorescence lifetime when 3-HTCA and 3-HTC-DiCN species are excited to the S1 state. This indicates the presence of a kinetic barrier in exergonic ESIPT reaction, and it is this barrier that is probably removed or diminished on excitation to higher energy states. Applying femtosecond fluorescence up-conversion technique we obtained direct proof that the rate of overall ESIPT reaction, monitored by the normal and/or tautomer emission, is excitation wavelength dependent. This allows fast SNn → STm ESIPT to compete successfully with SNn → SN1 internal conversion. The origin of this acceleration may be related to the vanishing of solvent-reorganization barrier for the ESIPT reaction.27,30 In contrast to SN1 → ST1 charge transfer coupled ESIPT that is subject to solvent induced barrier, the SNn states of studied compounds must have different distribution of electronic density.33 This distribution may better fit excited tautomer states such that both SNn and STm possess similar equilibrium polarization, minimizing this barrier. Verification of this hypothesis needs very sophisticated computation for the congested higher energy states. The relevant theoretical approach is in progress. Evidently, the uniqueness and difference of 3-HTCA and 3-HTC-DiCN from previously reported ESICT/ESIPT coupled molecules27,30 lie in that the efficiency of the lowest SN1 → ST1 ESIPT process is less than unity and there is no reversibility between SN1 and ST1. In comparison, ESIPT pathways in the higher lying states have higher efficiency than that of the SN1 → ST1 ESIPT process. Accordingly, one can see the increase of the tautomer emission upon higher energy excitation in the steady-state manner, a phenomenon of anti-Kasha's rule.
In summary, using the series of dyes 3-HTCA and 3-HTC-DiCN with different electron acceptor substituents in the thiophenyl fragment we demonstrate that the switching between Kasha and anti-Kasha behaviour can be modulated in a quite delicate way by appropriate molecular design. The exploration of anti-Kasha photochemistry opens an unexpectedly broad range of possibilities of selective control on photoreactions by changing the excitation energy not only in single-photon but also in multiple-photon modes. It allows reducing the losses in energy dissipating internal conversion processes that follow the excitation by high energy quanta and presently look unavoidable in photonic devices. This can make more efficient the utilization of photoexcitation energy, which is demanding in many applications.
Acknowledgements
The authors thank the Ministry of Science and Technology, Taiwan, for funding support.Notes and references
- M. Kasha, Discuss. Faraday Soc., 1950, 9, 14–19 RSC.
- M. Kasha and S. McGlynn, Annu. Rev. Phys. Chem., 1956, 7, 403–424 CrossRef CAS.
- N. J. Turro, V. Ramamurthy and J. C. Scaiano, Principles of molecular photochemistry: an introduction, University Science Books, 2009 Search PubMed.
- P. Klán and J. Wirz, Photochemistry of organic compounds: from concepts to practice, John Wiley & Sons, 2009 Search PubMed.
- T. Itoh, Chem. Rev., 2012, 112, 4541–4568 CrossRef CAS PubMed.
- V. L. Ermolaev, Russ. Chem. Rev., 2001, 70, 471–490 CrossRef CAS.
- T. Fujino, S. Y. Arzhantsev and T. Tahara, J. Phys. Chem. A, 2001, 105, 8123–8129 CrossRef CAS.
- H. Wang, H. Zhang, W. Rettig, A. I. Tolmachev and M. Glasbeek, Phys. Chem. Chem. Phys., 2004, 006, 3437–3446 RSC.
- J. Sung, P. Kim, S. Saga, S. Y. Hayashi, A. Osuka and D. Kim, Angew. Chem., Int. Ed., 2013, 52, 12632–12635 CrossRef CAS PubMed.
- B. D. Wagner, D. Tittelbach-Helmrich and R. P. Steer, J. Phys. Chem., 1992, 96, 7904–7908 CrossRef CAS.
- J. R. Huber and M. Mahaney, Chem. Phys. Lett., 1975, 30, 410–412 CrossRef CAS.
- A. D. McNaught and A. Wilkinson, Compendium of chemical terminology, Blackwell Science, Oxford, 1997 Search PubMed.
- C.-C. Hsu, C.-C. Lin, P.-T. Chou, C.-H. Lai, C.-W. Hsu, C.-H. Lin and Y. Chi, J. Am. Chem. Soc., 2012, 134, 7715–7724 CrossRef CAS PubMed.
- Y.-C. Chang, K.-C. Tang, H.-A. Pan, I. O. Koshevoy, A. J. Karttunen and P.-T. Chou, J. Phys. Chem. C, 2013, 117, 20494–20499 CAS.
- A. Cembran, F. Bernardi, M. Garavelli, L. Gagliardi and G. Orlandi, J. Am. Chem. Soc., 2004, 126, 3234–3243 CrossRef CAS PubMed.
- P. Altoe, N. Haraszkiewicz, F. G. Gatti, P. G. Wiering, C. Frochot, A. M. Brouwer, G. Balkowski, D. Shaw, S. Woutersen and W. J. Buma, J. Am. Chem. Soc., 2009, 131, 104–117 CrossRef CAS PubMed.
- I. Conti, F. Marchioni, A. Credi, G. Orlandi, G. Rosini and M. Garavelli, J. Am. Chem. Soc., 2007, 129, 3198–3210 CrossRef CAS PubMed.
- F. Renth, R. Siewertsen and F. Temps, Int. Rev. Phys. Chem., 2013, 32, 1–38 CrossRef CAS.
- Y. Ishibashi, M. Murakami, H. Miyasaka, S. Kobatake, M. Irie and Y. Yokoyama, J. Phys. Chem. C, 2007, 111, 2730–2737 CAS.
- T. Cordes, S. Malkmus, J. A. DiGirolamo, W. J. Lees, A. Nenov, R. d. Vivie-Riedle, M. Braun and W. Zinth, J. Phys. Chem. A, 2008, 112, 13364–13371 CrossRef CAS PubMed.
- S. Scuppa, L. Orian, A. Donoli, S. Santi and M. Meneghetti, J. Phys. Chem. A, 2011, 115, 8344–8349 CrossRef CAS PubMed.
- J. S. de Klerk, A. Szemik-Hojniak, F. Ariese and C. Gooijer, J. Phys. Chem. A, 2007, 111, 5828–5832 CrossRef CAS PubMed.
- Y.-C. Chang, K.-C. Tang, H.-A. Pan, S.-H. Liu, I. O. Koshevoy, A. J. Karttunen, W.-Y. Hung, M.-H. Cheng and P.-T. Chou, J. Phys. Chem. C, 2013, 117, 9623–9632 CAS.
- V. I. Tomin and R. Jaworski, J. Mol. Struct., 2009, 924–926, 461–465 CrossRef CAS.
- J. E. Kwon and S. Y. Park, Adv. Mater., 2011, 23, 3615–3642 CrossRef CAS PubMed.
- A. P. Demchenko, FEBS Lett., 2006, 580, 2951–2957 CrossRef CAS PubMed.
- A. P. Demchenko, K.-C. Tang and P.-T. Chou, Chem. Soc. Rev., 2013, 42, 1379–1408 RSC.
- S. Ameer-Beg, S. M. Ormson, R. G. Brown, P. Matousek, M. Towrie, E. T. J. Nibbering, P. Foggi and F. V. R. Neuwahl, J. Phys. Chem. A, 2001, 105, 3709–3718 CrossRef CAS.
- Y.-M. Cheng, S.-C. Pu, Y.-C. Yu, P.-T. Chou, C.-H. Huang, C.-T. Chen, T.-H. Li and W.-P. Hu, J. Phys. Chem. A, 2005, 109, 11696–11706 CrossRef CAS PubMed.
- C.-C. Hsieh, C.-M. Jiang and P.-T. Chou, Acc. Chem. Res., 2010, 43, 1364–1374 CrossRef CAS PubMed.
- P. T. Chou, S. C. Pu, Y. M. Cheng, W. S. Yu, Y. C. Yu, F. T. Hung and W. P. Hu, J. Phys. Chem. A, 2005, 109, 3777–3787 CrossRef CAS PubMed.
- P. T. Chou, C. H. Huang, S. C. Pu, Y. M. Cheng, Y. H. Liu, Y. Wang and C. T. Chen, J. Phys. Chem. A, 2004, 108, 6452–6454 CrossRef CAS.
- A. O. Doroshenko, J. Mol. Struct., 2009, 933, 169–171 CrossRef CAS.
- V. I. Tomin, J. Photochem. Photobiol., A, 2013, 257, 1–4 CrossRef CAS.
- P. T. Chou, M. L. Martinez and J. H. Clements, J. Phys. Chem., 1993, 97, 2618–2622 CrossRef CAS.
- S. Gunduz, A. C. Goren and T. Ozturk, Org. Lett., 2012, 14, 1576–1579 CrossRef CAS PubMed.
- A. J. Carpenter and D. J. Chadwick, Tetrahedron, 1985, 41, 3803–3812 CrossRef CAS.
- A. S. Klymchenko and A. P. Demchenko, New J. Chem., 2004, 28, 687–692 RSC.
- N. Chattopadhyay, M. Barroso, C. Serpa, L. G. Arnaut and S. J. Formosinho, Chem. Phys. Lett., 2004, 387, 258–262 CrossRef CAS.
- D. Dziuba, I. A. Karpenko, N. P. F. Barthes, B. Y. Michel, A. S. Klymchenko, R. Benhida, A. P. Demchenko, Y. Mély and A. Burger, Chem.–Eur. J., 2014, 20, 1998–2009 CrossRef CAS PubMed.
- V. I. Tomin and R. Jaworski, Opt. Appl., 2010, 40, 587 CAS.
- V. I. Tomin, A. P. Demchenko and P.-T. Chou, J. Photochem. Photobiol., C, 2015, 22, 1–18 CrossRef CAS.
- S. J. Formosinho and L. G. Arnaut, J. Photochem. Photobiol., A, 1993, 75, 21–48 CrossRef CAS.
Footnotes |
| † Electronic supplementary information (ESI) available. CCDC 1403999. For ESI and crystallographic data in CIF or other electronic format see DOI: 10.1039/c5sc01945a |
| ‡ These authors contributed equally to this work. |
| This journal is © The Royal Society of Chemistry 2016 |

