
Continuous flow gas phase photoreforming of methanol at elevated reaction temperatures sensitised by Pt/TiO2†
A.
Caravaca‡
*ab,
H.
Daly
ac,
M.
Smith
d,
A.
Mills
*a,
S.
Chansai
ac and
C.
Hardacre
*ac
aSchool of Chemistry and Chemical Engineering, Queen's University Belfast, Belfast BT9 5AG, UK. E-mail: angel.caravaca@cea.fr; andrew.mills@qub.ac.uk; c.hardacre@manchester.ac.uk
bUK Catalysis Hub, Research Complex at Harwell, Rutherford Appleton Laboratory, Harwell Oxford, Oxon OX11 0FA, UK
cSchool of Chemical Engineering & Analytical Science, The University of Manchester, The Mill, Sackville Street, Manchester, M13 9PL, UK
dSchool of Materials, The University of Manchester, The Mill, Sackville Street, Manchester, M13 9PL, UK
First published on 11th October 2016
Abstract
Gas phase photoreforming of methanol using a Pt/TiO2 photocatalyst has been performed under flow conditions at elevated temperatures. Comparing the activity of the reforming process as a function of temperature under dark and irradiated conditions shows a significant enhancement in the rate of H2 production using the photo-assisted conditions at temperatures between 100–140 °C. At higher temperatures, the effect of irradiation is small with the process dominated by the thermal process. Deactivation of the catalyst was observed under irradiation but the catalyst was easily regenerated using an oxygen treatment at 120 °C. Diffuse reflectance infra-red Fourier transform spectroscopy (DRIFTS) showed that the activity of the catalyst could be correlated with the presence of the photogenerated trapped electrons. In addition, lower amounts of CO adsorbed on Pt, compared to those observed in the dark reaction, were found for the UV-irradiated systems. It is proposed that CO and adsorbed intermediates, such as formate, can act as inhibitors in the photoreforming process and this is further supported by the observation that, before and after the regeneration process in O2, the CO and surface adsorbed organic intermediate products are removed and the activity is recovered.
1. Introduction
Hydrogen is attracting increasing interest as an energy carrier for use in fuel cell devices and although fuel cell technology is already mature, the production of hydrogen still remains a major issue. Currently, nearly all hydrogen is produced using fossil fuels and only 4% is produced by water electrolysis.1 An alternative approach to the production of hydrogen is via the photocatalysed cleavage of water which is an example of the direct conversion of solar into chemical energy. In this area, many studies have been carried out in which a semiconductor photocatalyst is used to sensitise the photocleavage of water into H2 and O2.2 However, in general, most visible light-absorbing photocatalysts are unstable and most solar UV absorbing photocatalysts, such as TiO2 are unable to drive the reaction forward without additional electrochemical or chemical (e.g. via a pH gradient) bias.2,3 As a consequence, the use of sacrificial electron donors (SEDs) as semiconductor photogenerated hole scavengers, which are able to promote the efficient separation of the photogenerated charge carriers and the accumulation of photogenerated electrons, have been used to facilitate the reduction of water to hydrogen.4 This process can be referred to as photocatalytic reforming or, more simply, referred to herein as photoreforming, and it leads to a significant enhancement in the production of hydrogen compared to direct water splitting.As well as fossil fuel-based SEDs, biomass-derived compounds have been demonstrated as effective SEDs in the photoreforming process, since biomass is ultimately derived from CO2 in air, it follows that the production of CO2 during the photoreforming process leads to a near-zero carbon balance.4 The photoreforming of biomass-derived compounds, such as methanol,5–8 ethanol9,10 or glycerol,10–12 in aqueous solutions has been studied thoroughly, usually at room temperature. Methanol is an ideal model as a sacrificial reductant and, therefore, is often used for this purpose and so methanol was used as the SED in this study. The overall photoreforming reaction is shown in reaction (1).
 | (1) |
As indicated above, to date, most of the studies regarding the photoreforming of alcohols have been carried out in the liquid phase, using platinised TiO2 and under batch reaction conditions. However, Kang13 reported hydrogen production upon irradiation of a Fe/TiO2 photocatalyst dispersed in methanol/water solution in a liquid phase batch system in addition to some limited results for a continuous flow system. For the photoreforming of alcohols, working in continuous flow is a very important step in view of the further practical application of the photoreforming process. For the majority of applications, continuous flow operation saves time, energy and costs, increasing the productivity and reducing the transportation costs. In addition, little attention has been given to the effect of temperature.
Interestingly, there have been only a few studies which examined the photoreforming of alcohols (methanol) in the gas phase and most, if not all, have been conducted at room temperature.1,13–16 For example, Greaves et al.14 carried out the photoreforming of methanol in a batch gas phase system over Au/TiO2 photocatalysts. Chiarello et al. compared the rates of photoreforming of methanol in the gas phase over Au/TiO2,1,15 Pt/TiO2![[thin space (1/6-em)]](https://www.rsc.org/images/entities/char_2009.gif) 1,16 and Ag/TiO21 photocatalysts using a closed recirculating gas system.
1,16 and Ag/TiO21 photocatalysts using a closed recirculating gas system.
In this paper we describe the results arising from a study of the UV-driven, photocatalytic steam reforming of methanol over platinised titania in a continuous flow, gas phase system at reaction temperatures much greater than room temperature, i.e. between 100–200 °C. In addition, in situ DRIFTS has been used to study the effect of UV irradiation on the species adsorbed on the photocatalyst, in order to provide a greater mechanistic insight into the system.
2. Experimental
2.1 Photo photocatalyst preparation
A 0.2 wt% Pt/TiO2 photocatalyst was prepared by wet impregnation of the metal precursor (H2PtCl6·6H2O, Aldrich) onto TiO2 (P25, Degussa) followed by drying at 150 °C for 2 h and, thereafter, calcination at 500 °C for 2 h. The photocatalyst was sieved to ensure that the aggregate size was between 250 and 420 μm prior to use. The metal loading was measured using a Perkin Elmer Optima 4300 dv inductively coupled plasma optical emission spectrometer (ICP-OES). In its unreduced state the Pt will be mainly in the form of PtO2 and thus the pre-catalyst appears cream coloured. However, upon reduction in the reactor at 200 °C 5% H2/Ar at 15 cm3 min−1 for 30 min, the photocatalyst takes on a light grey appearance, as the PtO2 is reduced to Pt.2.2 Photocatalyst characterisation
The total surface area of the as prepared catalyst and catalyst reduced under reaction conditions (used catalyst) were measured using a Micromeritics ASAP2020 and the BET method.XRD patterns were obtained using a PANalytical X'Pert Pro X-ray diffractometer using Cu Kα irradiation. Diffractograms were carried out from 10° to 90°, with a step size of 0.008°. Crystallite sizes in the different phases were estimated from line broadening of the corresponding X-ray diffraction peaks using the Scherrer equation. The anatase/rutile ratio was calculated by examining the relative peak intensities of crystalline planes (101) and (111) of anatase and rutile, respectively.
High resolution transmission electron microscope (HRTEM) images, scanning transmission electron microscope (STEM) images and energy dispersive X-ray spectroscopy (EDS) spectrum images were obtained with a FEI Talos F200A microscope equipped with an X-FEG electron source and Super-X SDD EDS detectors. The experiment was performed using an acceleration voltage of 200 kV and a beam current of approximately 0.5 nA. TEM Images were recorded with an FEI CETA 4k × 4k CMOS camera. STEM images were acquired with a HAADF detector. The sample was supported on a holey carbon film with a 300 mesh copper TEM grid.
2.3 Photocatalytic activity testing
The irradiation of the photocatalyst-filled ‘S-bend’ reactor tube, i.e. the ‘photocatalyst bed’, at elevated temperatures was undertaken using an in-house developed reactor setup, the main features of which are illustrated in Fig. 1(a). The reactor comprised: a semi-cylindrical ceramic fibre heater (Watlow) with quartz cylinder envelope, with the gap between the tube and the heater filled with a ceramic fibre blanket to provide thermal insulation, except for an insulation-free window to allow the irradiation of the heated photocatalyst bed, illustrated in Fig. 1(b), which was placed next to the heater semi-cylinder. All illuminations were carried out using a 200 W Xe/Hg arc lamp (Oriel), which provided a typically UV irradiance of 19 mW cm−2. | ||
| Fig. 1 (a) Schematic representation of the overall reactor set up, showing: (A) the semi-cylindrical heater, (B) the thermal insulation and (C) the ‘S-bend’ reactor tube, all contained in an inner quartz tube, with an outer one for further insulation (the arrows indicate the direction of the reaction gas flow), and (b) expanded view of the photocatalyst filled ‘S-bend’ quartz reactor tube (i.d. 1.5 mm). | ||
To protect the lamp from the heat of the furnace, a second quartz cylinder, concentric to the first but with a diameter 1.5 cm larger than the inner cylinder, was utilised. Holes were drilled in the table between these cylinders to allow the external cylinder to cool by air convection. A serpentine shaped, ‘S-bend’, Pyrex™ glass reactor (internal diameter 1.5 mm) was used for the photocatalytic experiments (Fig. 1b), in which typically, 800 mg of photocatalyst were placed in order to fill the irradiated section of the S-bend reactor. Pyrex™ cuts off all wavelengths below 300 nm, and so no high energy UVC irradiation from the light source reached the photocatalyst. The serpentine shape increased the catalyst surface area that was exposed to the light compared with a conventional tubular plug flow reactor. The reactor temperature was measured at three points corresponding to the top, middle and bottom of the photocatalyst bed by thermocouples attached to the outer wall of the reactor. The temperature of the furnace was adjusted so that the temperature in the middle of the photocatalyst bed remained constant and at the desired value (Table S1†).
The reaction gases supplied by BOC were certified standards of: Ar (99.999% purity), H2 (99.999% purity), 5% O2/Ar and C2H4 (99.999% purity); the latter was used as an internal standard and injected into the gas stream at the exit of the reactor. The gas flow was controlled using calibrated mass flowmeters (Brooks) and the water and methanol were fed into the feed stream by separate saturators whose temperature were controlled using recirculating water baths. All lines downstream of the saturators were trace heated to above 100 °C to prevent condensation. The gas feed into the photoreactor consisted of 5% methanol plus 10% water (in Ar) with a total flow of 10 cm3 min−1 resulting in a weight hourly space velocity of 750 cm3 h−1 gcat−1. The reactor volume was ∼0.43 cm3 and, therefore, the gas hour space velocity was ∼1398 h−1 with a residence time of ∼2.6 s. The reactants and products were analysed using a gas chromatograph (Perkin Elmer) fitted with a Porapak D column with a TCD, for the analysis of H2, and a FID (with methanizer), for the analysis of CO, CO2, methanol and the ethylene internal standard. At the start of each photoreaction, the reactor was flushed with Ar and cooled to the desired reaction temperature before exposure to the feed and subsequent illumination.
2.4 In situ DRIFTS of photoreforming reaction
Photoreforming of 0.2% Pt/TiO2 photocatalysts was also studied using in situ DRIFTS utilising an in-house modified environmental chamber (Spectra Tech) which contained a UV LED lamp (365 nm from LED Engin) positioned ∼1 cm above the photocatalyst bed in the top plate of the environmental chamber (Fig. 2); the irradiance was typically 35 mW cm−2. The photocatalyst was pre-reduced in 5% H2/Ar at 200 °C for 30 min at 50 cm3 min−1 and then the reactor was purged with Ar and cooled to 100 °C before exposure to the feed (5% MeOH plus 10% H2O in Ar total flow 50 cm3 min−1). Spectra were recorded (resolution 4 cm−1, 32 scans) under a continuous flow of the methanol/water feed alternating between dark and UV conditions. The reduced photocatalyst was used as the background spectrum and all spectra shown as reported at log(1/R) where R is reflectance of photocatalyst under the reaction feed/reflectance of the reduced photocatalyst.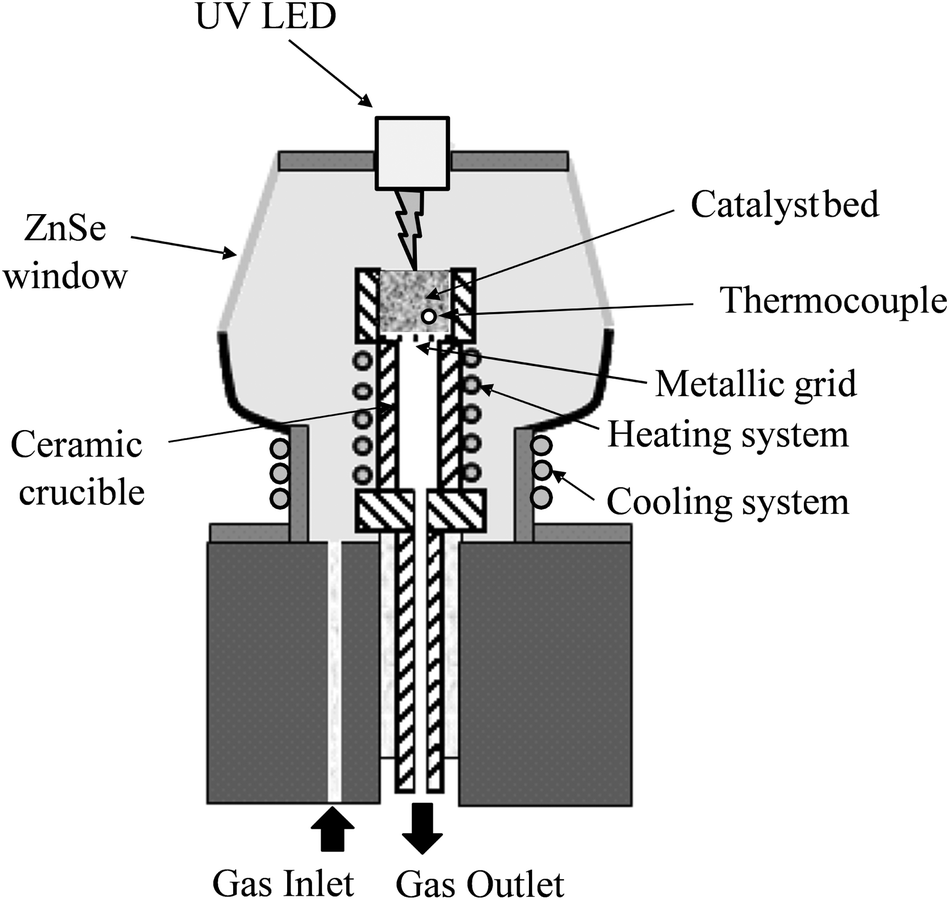 | ||
| Fig. 2 Schematic of photocatalytic in situ DRIFTS setup. | ||
3. Results and discussion
3.1 Characterisation of 0.2% Pt/TiO2
The 0.2% Pt/TiO2 photocatalyst was characterised by XRD and electron microscopy and the results are shown in the ESI† as well as its total surface area measured by BET. The BET surface area of the fresh catalyst was 53.0 m2 g−1 and the used catalyst a surface area of 49.1 m2 g−1. Fig. S1† shows the diffractograms for the pure TiO2 support (P25) and the fresh and used Pt/TiO2 photocatalyst. In addition, Table S2† summarizes the crystallite size of the TiO2 anatase and rutile phases, together with the anatase phase percentage. No significant modification in crystallinity or crystal phase was found comparing the pure support, fresh or used catalyst. This is in good agreement with previous studies regarding the range of temperatures for anatase–rutile phase transition, which indicates that temperatures higher than 600 °C are required.17,18 For the fresh (unreduced) catalyst, no peaks corresponding to Pt or PtOx were observed in the XRD which may be a reflection of the low metal loading and/or a high dispersion of Pt. The latter is consistent with the HRTEM/HAADF STEM analysis which also showed no evidence of Pt nanoparticles. For the catalyst reduced under reaction conditions (used catalyst), a similar XRD pattern was observed with only TiO2 related features found. However, Pt nanoparticles (2–3 nm) were observed using HAADF STEM following reduction (Fig. S2†). This aggregation of Pt may have led to some pore blocking and the small reduction in the BET surface area.3.2 Thermal and photocatalytic activity
The effect of the UV-vis irradiation on the steam reforming reaction was examined through a series of light-on/light-off cycles as a function of temperature. Fig. 3 displays the catalytic activity in the presence and absence of irradiation for the methanol steam reforming reaction over the 0.2% Pt/TiO2 catalyst/photocatalyst. The temperature was increased from 100 to 200 °C in steps of 20 °C maintaining the temperature for 2 h at each point (1 h under dark then 1 h under UV irradiation). | ||
| Fig. 3 Effect of the reaction temperature and the photoirradiation of the catalyst in the activity for methanol steam reforming. Reaction conditions: 800 mg 0.2% Pt/TiO2 (P25), 5% MeOH/10% H2O, total flow 10 cm3 min−1 (Ar carrier). Photoirradiation with 200 W Xe/Hg lamp. The methanol conversion value corresponds to that measured after 1 h (in the dark or UV light). | ||
The thermal (i.e. dark) gas phase catalytic steam reforming of methanol over Pt/TiO2 has been well-studied.19–21 As reported for Group VIII metal catalysts (such as Pt and Pd), the main reactions leading to the production of H2 are methanol steam reforming (the dark equivalent of reaction (1)) and methanol decomposition, reaction (2).
| CH3OH → CO + 2H2 | (2) |
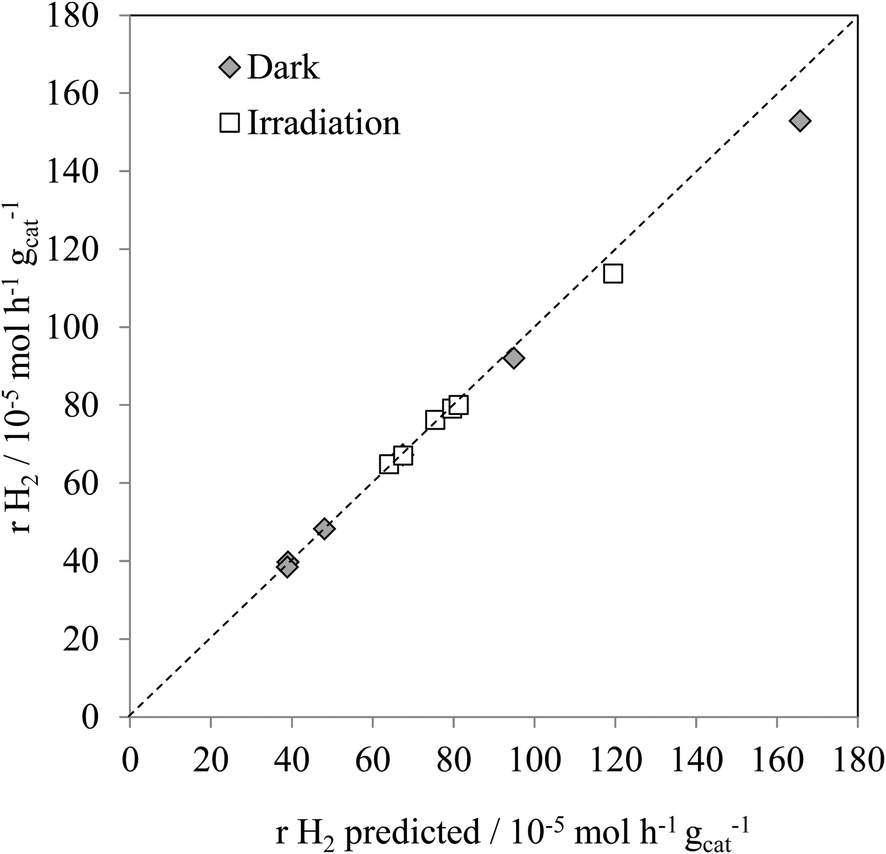
Fig. 4 shows the experimental hydrogen production for both the thermal, and thermal/photoassisted, experiments compared with the predicted hydrogen production according to reactions (1) and (2). The predicted hydrogen production was calculated according to eqn (3).
| rH2predicted = 2 × rCOexp + 3rCO2exp | (3) |
| CO + H2O → CO2 + H2 | (4) |
As found with the thermally activated process, Fig. 4 shows that there is a good agreement with the predicted H2 production from the steam reforming and methanol decomposition reactions under photo activated conditions demonstrating the lack of by-products. For example, the low rate of methane production is similar to that found for the thermally activated reaction. It should be noted that the extent of direct water splitting using 10% water only under these conditions is <5 × 10⁻⁵ mol h−1 gcat−1.
The above results show that, in the dark at low temperatures, the decomposition of MeOH, with concomitant production of CO, is the dominant process. In contrast, under illumination at the same temperatures, i.e. <160 °C, the photocatalysed steam reforming reaction (1) is a major process. It should be noted that the decomposition of MeOH, reaction (2), is also enhanced by photocatalysis at temperatures <160 °C.
The rates of hydrogen production are lower than found by Chiarello et al.1,16 using a recirculating gas phase photocatalytic system. Therein, for a wet impregnated 0.5% Pt/TiO2 catalyst, the H2 production rate was 775 × 10−5 mol h−1 gcat−1 (1.55 mol h−1 gPt−1) at 55 °C compared with 75 × 10−5 mol h−1 gcat−1 (0.375 mol h−1 gPt−1) at 100 °C in the present case. This difference is likely to be associated with the higher flux of photons in both studies and the change in reactor geometry. Importantly, whilst the rate is lower, herein, only trace amounts of methane were observed and no other carbon containing species. Chiarello et al.1,16 reported the formation of formic acid, formaldehyde, dimethyl ether and esters as well as methane which may be the result of operating in a recirculating mode.
 | ||
| Fig. 5 In situ DRIFT spectra of 0.2% Pt/TiO2 under 5% CH3OH + 10% H2O feed at 100 °C (grey) and under 5% CH3OH + 10% H2O feed at 100 °C after 14 s of UV irradiation (black). Spectra have been corrected for gas phase methanol. | ||
Under irradiation, the only major change in the DRIFT spectra is a broad absorbance increase across the entire spectrum from 1000–2500 cm−1 (Fig. 5). The increasing absorbance for TiO2 and TiO2-based photocatalysts has been attributed to IR absorbance of the UV generated electrons in shallow trapped states of the conduction band electrons in TiO2 with the maximum observed at ∼1800 cm−1.23,27 The small changes above 3000 cm−1 are likely to be changes in the surface hydroxyl species on exposure to irradiation. In this study, the change in absorbance was only observed for 0.2% Pt/TiO2 (or TiO2) when exposed to methanol only or methanol plus water feeds and at temperatures up to 180 °C, i.e. no change in absorbance was observed at 200 °C under the same reaction conditions. This observation suggests that in the gas phase the reduction of water to hydrogen at the Pt sites is the rate-determining step, i.e. hole trapping is rapid and, as a result, photogenerated electrons accumulate, because the reduction of H2O to H2 on the Pt particles is rate-determining. This observation is supported by the in situ FT IR and time resolved study on reaction (1) reported by Chen et al.23 Therein, it was observed that the rate of decay of the photo-generated electrons was strongly related to the rate of hydrogen production implying that these may be responsible for the photoactivity.
The extent of change in absorbance under UV irradiation (ΔAbs at 1800 cm−1) provides an indication of the population of the photogenerated, shallow-trapped electrons. As stated above, the trapped electron population for 0.2% Pt/TiO2 decreases with increasing reaction temperature (Fig. 6), which suggests that electron–hole recombination becomes increasingly rapid with increasing temperature and this can be related to the observation that, at elevated temperatures, little or no enhancement in the methanol conversion and formation rate of H2 was found under irradiation compared with the dark reaction (Fig. 3).
 | ||
| Fig. 6 Change in absorbance at 1800 cm−1 after 14 s of UV irradiation for 0.2% Pt/TiO2 under 5% CH3OH + 10% H2O feed at increasing reaction temperatures. | ||
At 100 °C, exposure of the photocatalyst to UV light caused a rapid depletion of ∼20% in the Pt–CO band area for the duration of exposure to UV light (Fig. 7). When the UV light was switched off, the Pt–CO band area recovered to a value similar to that found before the Pt/TiO2 photocatalyst was irradiated. This UV-induced decrease in Pt–CO band area was observed at temperatures up to 180 °C with the extent of the change in band area decreasing as the reaction temperature increased. Interestingly, from the results illustrated in Fig. 3 for the same system the rate of formation of CO was also enhanced under UV conditions. Thus, the decrease in adsorbed CO on Pt observed using in situ DRIFTS is associated with the photocatalyst becoming more active with regard to the steam-reforming reaction (1). This suggests that CO adsorption impedes reaction (1) so that an initial key step is the photocatalysed removal of CO from the Pt, so as to allow reaction (1) to proceed more efficiently.
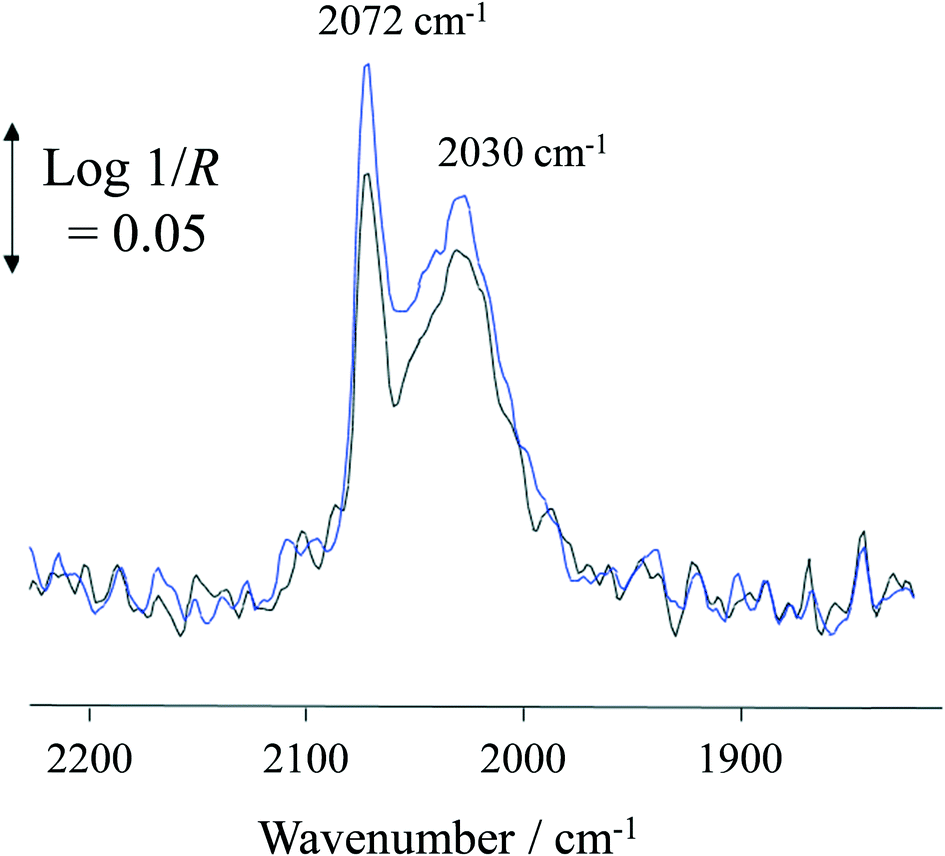 | ||
| Fig. 7 DRIFT spectra of Pt–CO bands at 100 °C in dark (blue spectrum) and under UV irradiation (black spectrum). | ||
The mechanism for the reforming of methanol photocatalysed by Pt/TiO2 is still the subject of much debate with many alternative mechanisms, in which most, or part of the hydrogen generated is derived from thermal, rather than photochemical, versions of reactions (1) and (2).10,15,23,25 Herein, we adopt a popular interpretation, based on an electron flux matching approach,23,28 often used in photocatalysis, which has its origins in photoelectrochemistry and the interpretation that a platinised TiO2 particle can be viewed as a micro-photoelectrochemical cell in which the TiO2 functions as a photoanode and the Pt as a ‘dark’ cathode. Consistent with the flux-matching mechanism, it is worth noting that the photo-oxidation of methanol (at a TiO2 photoanode), and concomitant dark reduction of water to hydrogen, is a very well-studied process.29
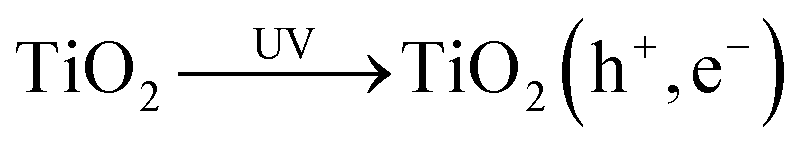
In the flux-matching mechanism, after the photogeneration of an electron–hole pair, reaction (5), on the TiO2 photocatalyst particles the rate of consumption of photogenerated electrons is matched by that of the holes, R, in the absence of a sacrificial electron donor such as MeOH.
 | (5) |
The value of R is effectively the rate of recombination of the photogenerated electrons and holes to generate heat, Δ, reaction (6).
| TiO2(h+, e−) → TiO2 + Δ | (6) |
In the presence of a SED, the overall rate of reaction of the holes, Rh, with MeOH and subsequent reaction intermediates, will then be matched by the overall rate of reaction of the electrons, Re. If Pt and H2O are present, as in this work, the usual fate of the photogenerated electrons will be trapping by the dispersed Pt particles on the TiO2 and the subsequent reduction of water to H2,23,30,31reaction (7).
 | (7) |
In contrast, the photo-oxidation of MeOH by the photogenerated holes is believed16,30,31 to occur on the surface of TiO2, forming intermediate levels of formaldehyde and formic acid before ultimately yielding CO2,26,28reaction (8).
 | (8) |
Support for this overall mechanism, which will give the observed 3:1 yield of H2 to CO2, is provided by previous observations23,26,28 as well as the present study. Possibly the strongest piece of evidence for the above, all photocatalytic, no thermal, mechanism, derives from the recent work of Kandiel et al., who have shown, through isotopic labelling studies that the H2 produced by this system is mainly produced by the reduction of protons originating from water.30 In this work, in agreement with previous studies,26 the DRIFTS reveals the photo-generation of formaldehyde and formic acid/formate. Interestingly, here we find clear evidence for the photogeneration of formate, i.e. its ambient surface level increases under irradiation and stops under dark conditions. In contrast, Highfield et al. attributed the formate changes to a thermal process that leads to some thermal H2 mechanism being present.26
Although MeOH dehydrogenates on Pt in the dark, viareaction (2) and the CO adsorbs on the Pt, from the observed drop in Pt–CO signal in DRIFTS with illumination, this process appears to be reduced significantly, upon illumination of the Pt/TiO2 photocatalyst. This may be associated with the negative effect on the adsorption process, of charging of the Pt particles by the photogenerated electrons and their subsequent reaction viareaction (7).26 The observed increase in background IR absorbance observed in DRIFTS, is compatible with the above flux-matching mechanism,26–28 assuming that reaction (7) is sufficiently slow as to allow the photogenerated electrons to accumulate on the TiO2, as Ti(III), which are often referred to as free conduction band electrons, although they are in fact trapped electrons, and referred to here as such.32
In contrast to the photocatalytic system, in the dark, at low temperatures the Pt/TiO2 catalyst appears to mediate predominately reaction (2), the dehydrogenation of MeOH (i.e. methanol decomposition), rather than the steam reforming process, reaction (1), see Fig. 3. As the temperature is elevated, the latter reaction plays an increasingly important role, presumably as the water-gas shift reaction starts to dominate, as is often seen with PGM/TiO2 thermal catalysts.33–35 DRIFTS shows the presence of methoxy and formate species, both of which have been observed before for Au/TiO2 catalysts34,35 and have been accounted for in a proposed mechanism involving anion vacancies on the TiO2.35
 | ||
| Fig. 8 Effect of the photoirradiation of the catalyst in the production of H2, CO, CO2 and methanol conversion. Reaction conditions: 800 mg 0.2% Pt/TiO2 (P25), 120 °C, 5% MeOH/10% H2O, total flow 10 mL min−1 (Ar carrier). Regeneration treatment: 120 °C, non photo-irradiation, 16% O2/20% H2O, 12.5 cm3 min−1. Photoirradiation with 200 W Xe/Hg lamp. | ||
Conclusions
In this study, a novel photocatalytic reactor was designed and utilised to probe the continuous flow photoreforming of methanol at elevated temperatures over a Pt/TiO2 photocatalyst. A significant UV enhanced activity was observed at temperatures between 100 and 140 °C above which the photocatalyst began to exhibit a significant background thermal activity so that the difference in activity between dark and UV irradiated reactions is reduced markedly. The temperature range where enhanced steam reforming photocatalytic activity was observed correlated with the establishment of a clearly discernible population of photogenerated, trapped electrons as well as with the reduction in the amount of CO adsorbed on Pt as monitored by in situ DRIFTS. The presence of increasing amounts of strongly adsorbed CO/intermediates on the photocatalyst during the reaction is proposed to be the cause of the gradual deactivation under photoreforming conditions, although this can be reversed, and the photocatalyst regenerated, by treating the photocatalyst in humid oxygen.Acknowledgements
UK Catalysis Hub is kindly thanked for resources and support provided via our membership of the UK Catalysis Hub Consortium and funded by EPSRC (Grant no: EP/K014706/1). Open access data can be obtained from the University of Manchester research portal.References
- G. L. Chiarello, M. H. Aguirre and E. Selli, J. Catal., 2010, 273, 182–190 CrossRef CAS.
- A. Fujishima and K. Honda, Nature, 1972, 238, 37–38 CrossRef CAS PubMed.
- P. Deák, J. Kullgren, B. Aradi, T. Frauenheim and L. Kavan, Electrochim. Acta, 2016, 199, 27–34 CrossRef.
- O. Carp, C. L. Huisman and A. Reller, Prog. Solid State Chem., 2004, 32, 33–177 CrossRef CAS.
- L. S. Al-Mazroai, M. Bowker, P. Davies, A. Dickinson, J. Greaves, D. James and L. Millard, Catal. Today, 2007, 122, 46–50 CrossRef CAS.
- H. Bahruji, M. Bowker, P. R. Davies, J. Kennedy and D. J. Morgan, Int. J. Hydrogen Energy, 2015, 40, 1465–1471 CrossRef CAS.
- T. Chen, Z. Feng, G. Wu, J. Shi, G. Ma, P. Ying and C. Li, J. Phys. Chem. C, 2007, 111, 8005–8014 CAS.
- T. Ishii, H. Kato and A. Kudo, J. Photochem. Photobiol., A, 2004, 163, 181–186 CrossRef CAS.
- M. Bowker, C. Morton, J. Kennedy, H. Bahruji, J. Greves, W. Jones, P. R. Davies, C. Brookes, P. P. Wells and N. Dimitratos, J. Catal., 2014, 310, 10–15 CrossRef CAS.
- M. Bowker, Green Chem., 2011, 13, 2235–2246 RSC.
- M. Bowker, P. R. Davies and L. S. Al-Mazroai, Catal. Lett., 2009, 128, 253–255 CrossRef CAS.
- V. M. Daskalaki and D. I. Kondarides, Catal. Today, 2009, 144, 75–80 CrossRef CAS.
- M. Kang, J. Mol. Catal. A: Chem., 2003, 197, 173–183 CrossRef CAS.
- J. Greaves, L. Al-Mazroai, A. Nuhu, P. Davies and M. Bowker, Gold Bull., 2006, 39, 216–219 CrossRef CAS.
- G. L. Chiarello, L. Forni and E. Selli, Catal. Today, 2009, 144, 69–74 CrossRef CAS.
- G. L. Chiarello, D. Ferri and E. Selli, J. Catal., 2011, 280, 168–177 CrossRef CAS.
- E. P. Melián, M. N. Suárez, T. Jardiel, J. M. D. Rodríguez, A. C. Caballero, J. Araña, D. G. Calatayud and O. G. Díaz, Appl. Catal., B, 2014, 152–153, 192–201 CrossRef.
- Q. Xu, Y. Ma, J. Zhang, X. Wang, Z. Feng and C. Li, J. Catal., 2011, 278, 329–335 CrossRef CAS.
- N. Takezawa and N. Iwasa, Catal. Today, 1997, 36, 45–56 CrossRef CAS.
- W. C. Lin, W. D. Yang, I. L. Huang, T. S. Wu and Z. J. Chung, Energy Fuels, 2009, 23, 2192–2196 CrossRef CAS.
- N. Iwasa and N. Takezawa, Top. Catal., 2003, 22, 215–224 CrossRef CAS.
- P. Panagiotopoulou and D. I. Kondarides, J. Catal., 2004, 225, 327–336 CrossRef CAS.
- T. Chen, Z. Feng, G. Wu, J. Shi, G. Ma, P. Ying and C. Li, J. Phys. Chem. C, 2007, 111, 8005–8014 CAS.
- W.-C. Wu, C.-C. Chuang and J.-L. Lin, J. Phys. Chem. B, 2000, 104, 8719–8724 CrossRef CAS; D. A. Panayotov, S. P. Burrows and J. R. Morris, J. Phys. Chem. C, 2012, 116, 6623–6635 Search PubMed.
- L.-F. Liao, W.-C. Wu, C.-Y. Chen and J.-L. Lin, J. Phys. Chem. B, 2001, 105, 7678–7685 CrossRef CAS; P. A. Dilara and J. M. Vohs, J. Phys. Chem., 1993, 97, 12919–12923 CrossRef.
- J. G. Highfield, M. H. Chen, P. T. Nguyen and Z. Chen, Energy Environ. Sci., 2009, 2, 991–1002 CAS.
- A. Yamakata, T.-A. Ishibashi and H. Onishi, J. Phys. Chem. B, 2002, 106, 9122–9125 CrossRef CAS; A. Yamakata, T.-A. Ishibashi and H. Onishi, J. Phys. Chem. B, 2003, 107, 9820–9823 CrossRef.
- J. M. Kesselman, G. A. Shreve, M. R. Hoffmann and N. S. Lewis, J. Phys. Chem., 1994, 98, 13385–13395 CrossRef CAS.
- G. Nogami and J. H. Kennedy, J. Electrochem. Soc., 1989, 136, 2583–2588 CrossRef CAS.
- T. A. Kandiel, I. Ivanova and D. W. Bahnemann, Energy Environ. Sci., 2014, 7, 1420–1425 CAS.
- G. N. Nomikos, P. Panagiotopoulou, D. I. Kondarides and X. E. Verykios, Appl. Catal., B, 2014, 146, 249–257 CrossRef CAS.
- G. Pacchioni, ChemPhysChem, 2003, 4, 1041–1047 CrossRef CAS PubMed.
- V. G. Deshmane, S. L. Owen, R. Y. Abrokwah and D. Kuila, J. Mol. Catal. A: Chem., 2015, 408, 202–213 CrossRef CAS.
- K. Kahler, M. C. Holz, M. Rohe, A. C. van Veen and M. Muhlet, J. Catal., 2013, 299, 162–170 CrossRef.
- A. Nuhu, J. Soares, M. Gonzalz-Herra, G. Hussain and M. Bowker, Top. Catal., 2007, 44, 293–297 CrossRef CAS.
- H. Einaga, N. Urahama, A. Tou and Y. Teraoka, Catal. Lett., 2014, 144, 1653–1660 CrossRef CAS.
Footnotes |
| † Electronic supplementary information (ESI) available. See DOI: 10.1039/c6re00140h |
| ‡ Present address: CEA, DEN, DRCP/SERA/LCAR, F-30207 Bagnols-sur-Cèze Cedex, France. |
| This journal is © The Royal Society of Chemistry 2016 |