A new methodology for the reduction of vibrational kinetics in non-equilibrium microwave plasma: application to CO2 dissociation
J. F.
de la Fuente†
a,
S. H.
Moreno†
a,
A. I.
Stankiewicz
a and
G. D.
Stefanidis
*b
aIntensified Reaction & Separation Systems, Process & Energy Laboratory, Delft University of Technology, Leeghwaterstraat 39, 2628 CB, Delft, The Netherlands
bChemical Engineering Department, Katholieke Universiteit Leuven, Celestijnenlaan 200f, 3001 Leuven (Heverlee), Belgium. E-mail: georgios.stefanidis@cit.kuleuven.be
First published on 17th August 2016
Abstract
Plasma reactor technologies have the potential to enable storage of green renewable electricity into fuels and chemicals. One of the major challenges for the implementation of these technologies is the energy efficiency. Empirical enhancement of plasma reactors' performance has proven to be insufficient in this regard. Numerical models are therefore becoming essential to get insight into the process for optimization purposes. The chemistry in non-thermal plasmas is the most challenging and complex part of the model due to the large number of species and reactions involved. The most recent reaction kinetics model for carbon dioxide (CO2) dissociation in non-thermal microwave plasma considers more than one hundred species and thousands of reactions. To enable the implementation of this model into multidimensional simulations, a new reduction methodology to simplify the state-to-state kinetic model is presented. It is based on four key elements: 1) all the asymmetric vibrational levels are lumped within a single group or fictitious species,  , 2) this group follows a non-equilibrium Treanor distribution, 3) an algebraic approximation is used to compute the vibrational temperature from the translational temperature based on the Landau–Teller formula and 4) weighted algebraic expressions are applied, instead of complex differential equations, to calculate the rates of the most influencing reactions; this decreases substantially the calculation time. Using this new approach, the dissociation and vibrational kinetics are captured in a reduced set of 44 reactions among 13 species. The predictions of the reduced kinetic model regarding the concentrations of the heavy species in the afterglow zone are in good agreement with those of the detailed model from which the former was derived. The methodology may also be applied to other state-to-state kinetic models in which interactions of vibrational levels have the largest share in the global set of reactions.
Introduction
Two major environmental and scientific challenges faced nowadays are energy storage and greenhouse gas emissions.1–5 The pressing need for employing renewable energy sources has brought up new challenges regarding electricity storage, which need to be overcome before the current energy mix can be upgraded to one based on renewable energy sources.3 Various alternatives are being investigated such as mechanical, chemical, electromagnetic and thermal storage.3–6 The valorisation of carbon dioxide (CO2) to produce synthetic fuels has been identified as one of the approaches to convert renewable surplus electricity into easy-to-store chemicals.6 In this regard, plasma-based systems combine the opportunity of utilizing both surplus electricity as well as greenhouse gases as feedstock for the conversion process. Plasma reactor technology offers potential benefits, such as compactness, robustness and fast response time to temporal variations at the reactor inlet.7,8 Therefore, it is a suitable technology to cope with the intermittent and fluctuating pattern of renewable energy supply (e.g., solar and wind energy).2,9 Moreover, the characteristics of non-thermal plasma are particularly favourable for the dissociation and utilization of CO2, making it a very promising technology for chemical process intensification.One of the major drawbacks to commercializing plasma technology is the high energy consumption.10 Despite the extensive research conducted experimentally to optimize plasma reactor performance,11,12 there are still a lot of uncertainties that need to be addressed in order to fully understand the reaction mechanisms in non-thermal plasma conditions and optimize plasma processes.13 Therefore, there is a need to develop reliable plasma chemistries that can be implemented in plasma reactor models for the evaluation of different reactor configurations and process optimization.1 Predictive plasma reactor models are inherently multiphysics models describing electromagnetic wave propagation, mass conservation, electron and fluid dynamics, heat transfer and plasma chemical kinetics.14–16 When detailed kinetic models, including all the elementary steps, are taken into account, the model becomes highly complex due to the large number of reactions and species needed to describe the plasma reactive system. Large chemical kinetic models require solution of a large number of transport equations in addition to estimating the chemical source terms, often governed by stiff ordinary differential equations (ODEs).17 Hence, to enable the applicability of plasma kinetic models in multidimensional simulations, a simplification approach to reduce complex kinetic models is presented in this work.
Several attempts have been made to develop reaction kinetics models for CO2 chemistry. In ref. 18, a numerical model for the plasma chemical reactions taking place in a pure CO2 glow discharge was developed, albeit vibrational kinetics were not included. In ref. 19, a high-temperature non-equilibrium reacting CO2 flow was studied; although a detailed description of the vibrational kinetics by means of kinetic theory methods was given, the plasma chemistry was missing. More recently, a state-to-state kinetic model including all the relevant chemical reactions in a CO2 non-thermal microwave discharge was proposed.20 In a subsequent publication,21 the kinetic model was updated to evaluate the energy efficiency in the discharge. This model consists of 126 species and more than 10![[thin space (1/6-em)]](https://www.rsc.org/images/entities/char_2009.gif) 000 reactions, including electron impact, neutrals and vibrational energy transfer reactions. In ref. 9, a reduced kinetic model for CO2 dissociation in dielectric barrier discharges (DBDs) was introduced. This model includes the most relevant plasma species and reactions in DBD discharge conditions but lacks vibrational kinetics. Such a model is then unsuitable for microwave discharges where dissociation through vibrational excitation of the molecule appears to be the most efficient dissociation mechanism.11,22
000 reactions, including electron impact, neutrals and vibrational energy transfer reactions. In ref. 9, a reduced kinetic model for CO2 dissociation in dielectric barrier discharges (DBDs) was introduced. This model includes the most relevant plasma species and reactions in DBD discharge conditions but lacks vibrational kinetics. Such a model is then unsuitable for microwave discharges where dissociation through vibrational excitation of the molecule appears to be the most efficient dissociation mechanism.11,22
To date, a practical and manageable kinetic model for CO2 dissociation in non-thermal microwave plasma has not been reported. In this work, a novel two-step approach for reduction of vibrational kinetics is presented and applied to CO2 dissociation in non-equilibrium microwave discharges. Two different simplification techniques are coupled to carry out the reduction process: i) chemical lumping of species, where several species are grouped into a single pseudo-species, in combination with ii) a skeletal reduction approach, which includes identification and selection of the most influencing species in the dissociation process without loss of qualitative potential.1,19,23 The novelty of the presented model lies in four key elements: 1) all the asymmetric vibrational levels are lumped within a single group instead of several groups as reported in ref. 24–26, 2) this group follows the non-equilibrium Treanor distribution, 3) an algebraic approximation is used to compute the vibrational temperature from the translational temperature based on the Landau–Teller formula and 4) weighted algebraic expressions are applied, instead of complex differential equations, to calculate the rates of the most influencing reactions. The obtained kinetic model comprises 13 species and 44 reactions whereby all the relevant chemical reactions influencing the CO2 dissociation process are accounted for. The comparison of the results given by the detailed and reduced kinetic models shows good agreement. In particular, the best match is obtained in the afterglow zone, where the species concentrations represent those at the outlet of the reactor. It is important to remark that the purpose of the work is to explore and validate a new methodology for the reduction of vibrational plasma kinetics, exemplified herein for a CO2 non-thermal microwave discharge, rather than to perform self-consistent multidimensional simulations, a task that has not been carried out yet.
Description of the model
To properly evaluate non-equilibrium reaction kinetics, state-to-state (STS) kinetic models are developed accounting for all the internal excited states and their interactions. This approach leads to reaction mechanisms with a large number of species (in the order of dozens to hundreds) and reactions (in the range of hundreds to thousands), which are not practical for multidimensional simulations. Therefore, the application of STS kinetic models has been mostly limited to zero- and one-dimensional simulations. The STS kinetic model reported in ref. 21 was taken as the starting point in this work. In the following subsection, a detailed description of the plasma chemical reactive system and also the simplification methodology is given.Reduced plasma kinetic model: species and reactions
The species considered in the reduced kinetic model are displayed in Table 1. As stated in ref. 12 and 27, the CO2 molecule presents three normal vibrational modes, the symmetric bending mode, the symmetric stretching mode and the asymmetric stretching mode. The symmetric modes of vibration of this molecule are herein denoted as CO2va, CO2vb and CO2vc (Table 1). The asymmetric stretching mode is found to be the most energy efficient dissociation channel due to its capacity to store vibrational energy. In this mode, 21 vibrational excited levels are considered up to the dissociation limit of the molecule.20 The reduction potential of the model is based on the lumping of all the asymmetric vibrational excited levels into a fictitious species, referred to as . This leads to a substantial simplification of the STS kinetic model, as most of the reactions come from the state-to-state interactions of vibrational levels.28
 represents a fictitious species accounting for all the asymmetric vibrational levels
The reactions included in the reduced kinetic model are shown in Tables 2–5. In this model, four different types of reactions are included; these are electron impact reactions, reactions of neutral species, vibrational energy exchange reactions and surface reactions, which are presented in Tables 2–5, respectively.
| No | Process | Reaction | Cross section |
|---|---|---|---|
| RX1 | CO2 elastic scattering | e + CO2 → e + CO2 | Ref. 29 |
| RX2 |
 elastic scattering elastic scattering |
e +  → e + → e +  |
Same as RX1 |
| RX3 | CO elastic scattering | e + CO → e + CO | Ref. 30 and 31 |
| RX4 | O elastic scattering | e + O → e + O | Ref. 31 |
| RX5 | O2 elastic scattering | e + O2 → e + O2 | Ref. 32 |
| RX6 | CO2 ionization | e + CO2 → e + e + CO2+ | Ref. 29 |
| RX7 | CO2 ionization from  |
e +  → e + e + CO2+ → e + e + CO2+ |
Same as RX6 |
| RX8 | CO ionization | e + CO → e + e + CO+ | Ref. 30 |
| RX9 | O ionization | e + O → e + e + O+ | Ref. 33 |
| RX10 | O2 ionization | e + O2 → e + e + O2+ | Ref. 32 |
| RX11 | Vibrational (de) excitation to CO2va | e + CO2 ↔ e + CO2va | Ref. 29 |
| RX12 | Vibrational (de) excitation to CO2vb | e + CO2 ↔ e + CO2vb | Ref. 29 |
| RX13 | Vibrational (de) excitation to  |
e + CO2 ↔ e +  |
“Simplification approach” section |
Electron impact reactions form the driving force of the plasma. The electrons gain kinetic energy from the electromagnetic field, which is further transferred to other species through collisions. The generation of new electrons occurs via ionization reactions, which are responsible for sustaining the plasma.
Reactions of neutral species play an important role in the formation of reactive species to promote chemical reactions. At favourable dissociation conditions, a fraction of the energy transferred from the electrons to the CO2 molecule is stored as internal energy in high vibrational levels of the asymmetric mode, which can either facilitate its dissociation or be transferred to the bulk gas as heat.
Vibrational energy transfer reactions are responsible for the energy exchange between vibrationally excited molecules and the vibrational energy loss to ground-state molecules. In this model, these reactions mainly lead to generation of heat by transferring the energy to the bulk gas via vibrational–translational (VT) relaxation reactions. Note that the parameters νs2 and νs3 represent the stoichiometric coefficients of the symmetric excited states for reactions RV2 and RV3, whereas νl2 and νl3 indicate the stoichiometric coefficients of the lumped excited state for the same reactions (RV2 and RV3).
The charged species, electrons and ions, diffuse together toward the walls through the effect of ambipolar diffusion, where electrons and ions are recombined via collisions on the reactor wall.
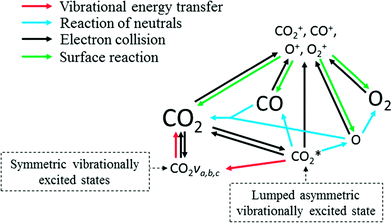
Using the simplification approach, which is described in the following sections, the STS model has been significantly reduced to 44 reactions among 13 species, accounting for the most relevant processes that dominate the dissociation of CO2 in non-equilibrium microwave plasma. A schematic representation of the reaction pathway is presented in Fig. 1.
Simplification approach
To date, various approaches have been adopted to reduce STS kinetic models. For instance, in ref. 28, principal component analysis (PCA) is applied to the CO2 dissociation process driven by vibrational kinetics; in this approach, a large database of results obtained using the STS kinetic model is required to identify the principal components. One can also make use of commercially available software, such as CHEMKIN-PRO,34 which is mainly used for combustion processes, and PumpKin,35 which employs algorithms to identify key components and group large sets of reactions in reduced reaction pathways; the latter is mostly used in plasma chemical models. The approaches in ref. 36 and 37 are closer to the one presented here; specifically, the kinetics are described by the vibrational and translational temperatures for the dissociation and recombination regimes of N2 + N in non-equilibrium hypersonic flows. Approaches where internal modes of molecules are divided into several groups have been reported as well.24–26 Such a multigroup lumping method was recently applied to reduce the vibrational kinetics of CO2.38 In this method, the vibrational levels of the asymmetric mode are lumped into various groups, each characterized by an internal Boltzmann equilibrium distribution given by its own vibrational temperature.In this work, a new reduction approach is introduced to simplify the STS kinetic model proposed in ref. 21 for the dissociation of CO2 in non-equilibrium microwave discharges. As opposed to ref. 24–26, our approach is based on lumping all the asymmetric vibrational levels within a single group. In addition, a non-equilibrium distribution, the so-called Treanor distribution, is considered in the lumping process instead of the commonly used Boltzmann distribution. It is known that the Treanor distribution overestimates the population of high energy levels; yet, this is balanced by the high VT and VV′ rates obtained for the group (see Simplification approach section). The complexity of multi-temperature approaches, widely used up to now, is reduced by the introduction of an algebraic approximation linking the vibrational and translational temperatures. Another advantage of this methodology is the implementation of weighted algebraic expressions to compute rate constants instead of solving the complex differential equations used in ref. 24–26, thereby enabling a faster calculation of the reaction rates. The application of this technique results in significant simplification regarding the number of reactions and species to describe the dissociation of CO2. Few methods have succeeded in the reduction of detailed plasma kinetic models, which concern mainly diatomic molecules. In the case of more complex molecules, the development of practical and manageable approaches is subject to ongoing research in order to enable multidimensional modeling of non-equilibrium plasma processes.
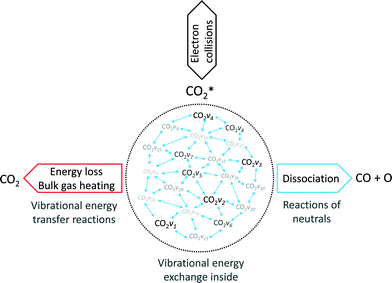
As stated before, the main reduction in the presented approach is achieved by grouping the asymmetric vibrationally excited states of CO2, which represent the main dissociation channel of the molecule in this type of discharges. Hence, the 21 vibrational levels considered in the detailed kinetic model21 to describe the dissociation processes are lumped into a single asymmetric vibrational excited state. The fictitious species  is the representation of all asymmetric vibrational excited states that are not in thermal equilibrium with the translational energy mode of the molecule. An illustration of the lumped species is outlined in Fig. 2.
High CO2 dissociation rates can be attained when the high vibrational levels of CO2 remain far from equilibrium.21 In low-temperature plasmas, the highest relaxation rate is the (vibrational–vibrational) VV relaxation, i.e. the interaction of CO2 molecules that are excited in the same vibrational mode. When the temperature of the gas increases, the (vibrational–translational) VT relaxation rate is boosted, thus leading to a high energy loss by heating up the gas. It is assumed that the vibrational levels lumped into the fictitious species  solely exchange energy through VV relaxation, although, as a group, they can either dissociate or lose energy via VT relaxation as shown in Fig. 2. One of the major assumptions taken in the presented model is that the excited states follow the so-called Treanor non-equilibrium distribution,39 which allows for the calculation of the population densities of all asymmetric vibrationally excited states. The reason behind this assumption is the dominant vibrational energy transfer mechanism in the discharge: electron impact vibrational excitation (0 → 1) followed by VV relaxation. Hence, the energy used in the dissociation is mainly transferred through this mechanism, which also results in a Treanor vibrational distribution. For simplicity, a good approximation is to fit their energy levels to a diatomic anharmonic oscillator model and compute an effective anharmonicity coefficient so that the Treanor distribution can be calculated. The Treanor distribution enables the evaluation of the departure from thermal equilibrium given by the Boltzmann distribution. Fig. 3 shows this concept more in detail by plotting the vibrational distribution functions considering different approaches: 1) Boltzmann distribution, 2) STS kinetic model20 (microwave discharge, power density = 25 W cm−3 and 0.8 ms time) and 3) Treanor distribution. The Tv/Tg value shown in Fig. 3 does not correspond to the values used to carry out the validation of the model; instead it shows the qualitative difference of the various VDFs. At low Tv/Tg values, the Treanor distribution approaches the Boltzmann distribution (becoming equal when Tv/Tg = 1), whereas at high Tv/Tg values the highly non-equilibrium nature of the discharge is noticeable. The departure from thermal equilibrium observed for both the STS and the Treanor vibrational distributions represents the stored vibrational energy in the asymmetric mode. In comparison to the Treanor distribution, the high levels of the STS distribution are depleted due to VT relaxation and dissociation. Herein, the overpopulation of the Treanor distribution is used to compute effective rates for vibrational relaxation and dissociation.
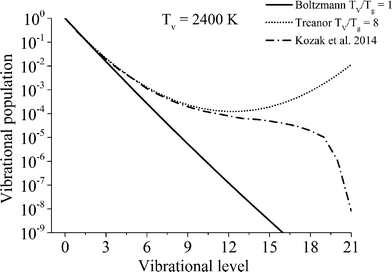 | ||
| Fig. 3 Comparison of the vibrational distribution functions considering the approaches: 1) Boltzmann distribution, 2) STS kinetic model20 (microwave discharge, power density = 25 W cm−3 and 0.8 ms time) and 3) Treanor distribution. | ||
The vibrational and bulk gas temperatures (Tv and Tg) are required to calculate the Treanor distribution, which reads:39
 | (1) |
 | (2) |
The discharge can be characterized by the Tv/Tg ratio, which should be high enough at low bulk gas temperatures to achieve efficient dissociation. For multidimentional models this mean or characteristic value of the discharge could be used for the calculations instead of considering spatial variations of the Tv/Tg values throughout the discharge. Considering the conditions studied in ref. 21, Tv/Tg values lie in the range of 5.2 to 7. A sensitivity analysis carried out to study the effect of this value on the kinetics yielded the best agreement with a value of 6 (see Validation of the model section). On the other hand, at temperatures beyond the characteristic vibrational temperature, the VT and VV relaxation processes become comparable, even for the lowest vibrational levels.39 In this case, the non-thermal effect is not attained and the discharge is completely thermalized, Tv/Tg = 1. The conditions at which a plasma reaches thermal equilibrium vary depending on the type and duration of the discharge. Since it is rather complex to determine when a microwave plasma reaches thermal equilibrium (between 4000 and 5000 K (ref. 12)), a value of 5070 K is assumed. This temperature is 1.5 times the characteristic vibrational temperature of CO2 and is above 5000 K, which ensures thermal equilibrium conditions of the plasma (dominance of VT over VV relaxation). Moreover, as found in ref. 40, the gas temperature in a pure CO2 microwave plasma torch is about 5000 K, which is consistent with our assumption. For further clarification, a comparison of the influence of these two parameters is given in the subsequent section, in which it is shown that the gas temperature at which quasi-equilibrium plasma conditions are reached barely has any influence on the results, while the high Tv/Tg value affects the calculations to a higher degree. The accuracy of the values chosen to compute the Treanor distribution is of secondary importance for the scope of this work, which is to demonstrate the validity of the reduction methodology.
Another point of discussion is the shape of the curve to estimate the Tv/Tg ratio. An exponential dependence is proposed as an initial approximation based on the Landau–Teller temperature dependence of vibrational–translational relaxation (VT), which becomes more relevant as temperature increases. Besides, a simple expression is preferred so that only two points are required for the fitting (see Fig. 4). For the considered range of temperatures the following expression gives a reasonable agreement of the temperature dependence with STS calculations of CO2 vibrational kinetics
 | (3) |
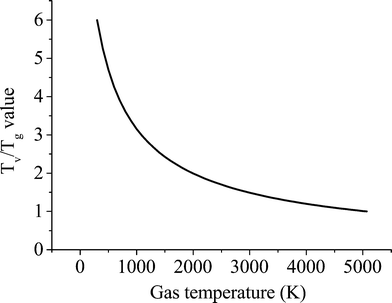 | ||
| Fig. 4 T v/Tg ratio–gas temperature dependence according to eqn (3). | ||
An accurate description of Tv and Tg would require the full set of reactions, which is not practical, or even possible, for multidimensional simulations. The coefficients a and b were computed by fitting this function to the proposed values of Tv/Tg. By following this approach, the Treanor distribution becomes exclusively a function of the gas temperature, thereby facilitating the calculation of the distribution. The Treanor distribution at various gas temperatures enables the estimation of rate constants for reactions involving the fictitious species  . These parameters are obtained by adding the individual contributions of the vibrational levels, which are computed from their populations and individual rate constants.
At low electron energies, the highest reaction rates are expected for elastic scattering and vibrational excitation since these reactions show the largest collisional cross sections.43 On the other hand, at high electron energies, the EEDF is considerably smaller, meaning that the rate constants are orders of magnitude smaller than processes taking place at low energies. For instance, for an electron temperature of 2 eV, the rate coefficient of the electron impact CO2 dissociation, which takes place at relatively high electron energies, is 3 orders of magnitude smaller than the rate coefficient of vibrational excitation. Therefore, only reactions with large cross sections are considered in the high electron energy range. In particular, besides elastic scattering, the largest cross section and the lowest energy threshold is attributed to the single charge ionization of CO2.29 In fact, the ionization rate due to single charge ionization is at least two orders of magnitude larger than other ionization processes, such as dissociative ionization or multiple charge ionization. In conclusion, three types of collision processes (elastic scattering, vibrational excitation and non-dissociative single charge ionization) are taken into account for the reduced kinetic model.
Concerning collisions of electrons with the main neutral products of CO2, i.e. CO, O, O2 and O3, these species take part in important processes of the reactive system, thus displaying high population densities. Based on the results given in ref. 21, the population density of O3 is at least two orders of magnitude less than that of O2 and three orders of magnitude less than the one of CO2. Moreover, O3 is mainly a product formed in the afterglow and does not have a major influence on the dissociation kinetics of CO2. For this reason, the O3 species is not included in the model. By analysing the cross section data reported,30–33,43,44 it can be concluded that the same type of reactions (elastic scattering, vibrational excitation and ionization) should be considered for the neutral species.
It is noted that the electronic excitation process has been neglected for neutral species in the reduced kinetic model, as it barely influences the CO2 dissociation kinetics at low electron energies. Furthermore, assuming the quasi-neutrality of plasma and an ionization degree of about 10−5,21 the mass fractions of the charged species are ∼5 orders of magnitude lower than those of the neutrals. Therefore, reactions with charged species are not included in the model.
With regard to electron collisions with vibrationally excited species, vibrational excitation reactions are considered for CO2 and neglected for other neutrals as the energy transfer to vibrational modes of these species is considerably lower.21 While the symmetric vibrational modes of CO2, CO2va and CO2vb, in combination with the lumped asymmetric vibrational mode  , are included, higher symmetric levels, such as the CO2vc and CO2vd are not added, as the cross sections for multiquantum vibrational jumps are smaller than single quantum vibrational jumps. Reverse processes of vibrational excitation, called de-excitation reactions, are also included in the model by using the detailed balancing principle.45
The black arrows in Fig. 1 show the electron impact reactions included in the reduced kinetic model. A total of 16 electron impact reactions are included; we refer to Table 2 for more information.
 .
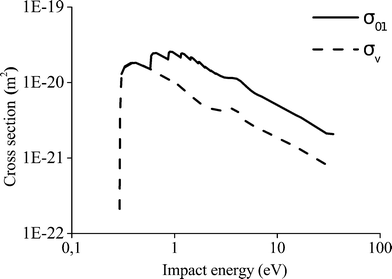
An overall vibrational excitation cross section is computed by lumping the vibrational excitation processes in the asymmetric vibrational mode, from the CO2 ground state to the higher states within
  . Vibrational de-excitation cross sections are obtained from the overall cross section by applying the detailed balancing principle. The calculation is carried out by scaling the cross sections using Fridman's approximation. Then, the computed cross sections are added to estimate the overall cross section. The total electron impact vibrational excitation rate for CO2 is the sum of the vibrational excitation rates from level 0 to all higher levels, thus:
 | (4) |
 (reaction RX13 in Table 2) and is computed as follows:
 | (5) |
Not all the cross sections for the transitions from any level i to a higher level j are available. Hence, they are computed using Fridman's approximation.12 Specifically, the cross section of the lowest transition, from level 0 to level 1 (σ0,1), is scaled to higher transitions by applying the following expression:
 | (6) |
In Fig. 5, a comparison between the cross section for the transition from level 0 to level 1 and the cross section for the excitation from CO2 to  is presented. The energy threshold of the process is the minimum energy required to put a CO2 molecule into vibration, which in this case is E1 − E0 = 0.29 eV.
In Fig. 1, it can be observed that the lumped excited species  is considered in the dissociation processes as dissociation reactions involving CO2 ground state (v = 0) present the highest activation energies leading to very low reaction rates.
Due to the change in the activation energy of the dissociation reactions as a consequence of the stored vibrational energy, the rate constants of reactions RN1 and RN2 must be computed. To estimate the efficiency in the reduction of the activation energy due to vibrational excitation, the Fridman–Macheret α-model is applied.12 The following expression is used:46
 | (7) |
The rate constants of each level are then multiplied by the population densities obtained from the Treanor distribution. For the dissociation reaction RN1, the following equation is apllied:37
 | (8) |
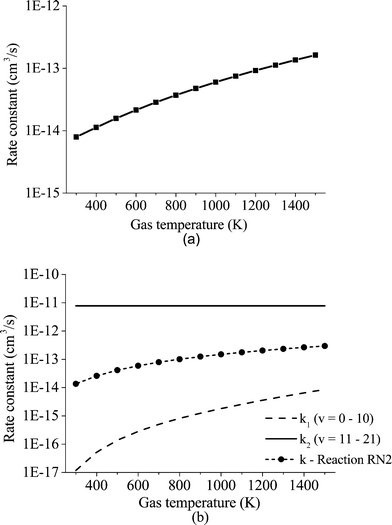
For the dissociation reaction RN2, a different expression is used. RN1 is an endothermic reaction with a high activation energy, which virtually vanishes at the highest vibrational levels, whereas RN2 is a thermoneutral reaction with an activation energy that vanishes at vibrational levels above v = 10. Hence, the form of the rate constant is divided into two groups: 1) vibrational levels from 1 to 10 and 2) levels from 11 to 21. We propose the following expression to compute the rate constant for RN2:
 | (9) |
In Fig. 6, the calculated rate constants for the reactions RN1 and RN2 at different temperatures are displayed. These values are then fitted to a modified Arrhenius type of equation so that a single temperature-dependent expression for the  dissociation reactions can be implemented (Table 3, RN1 and RN2 rate constants).
 and a CO2 ground-state, thus transferring a portion of its vibrational energy to the symmetric modes of the molecule. A total of 13 vibrational energy exchange reactions are included in the reduced kinetic model (red arrows in Fig. 1 and Table 4). The following subsections describe how the rate constants for the reactions RV2 and RV3 are calculated. The energy change in the reactions is fitted to diatomic anharmonic oscillator models so that the anharmonicity coefficient can be computed to scale the rate constants from the lowest vibrational state to higher ones at specific gas temperatures.20 The approach to calculate these rates is rather similar to the one used for the reaction of neutrals with one difference; the stoichiometric coefficients also depend on the Treanor distribution, which then depends on the bulk gas temperature.
 . In these reactions, a purely asymmetric vibrational level v relaxes into a lower asymmetric level v − 1 with a symmetric sublevel a, b, or c. It is assumed that symmetric sublevels relax rapidly via VT relaxation, thus becoming in thermal equilibrium with the asymmetric level. This mechanism is not a direct process and consists of multiple VT relaxation reactions, in which the first process is considered to be the rate-limiting step:48
 | (10) |
The rate constants are scaled by using expressions derived from the SSH theory.49,50 The scaling of the reaction rates is carried out by fitting the energy change in the reaction to a diatomic anharmonic oscillator model. The rate constants of reactions involving higher vibrational levels v > 1 are estimated from the rate constant of the reaction corresponding to the lowest levels (from v = 1 to v = 0). The calculation procedure for scaling the reactions is adapted from ref. 20.
The reactions V2a, b, c21 of all asymmetric vibrational levels within CO2 are multiplied by the corresponding Treanor population and added to obtain three reactions per collision partner M:
 | (11) |
 they can be simplified to
 | (12) |
For a specific collision partner M it is possible to express these reactions in a more general “lumped” expression, which is more convenient for implementation into the model:
 | (13) |
| kM(Tg) = kM,a(Tg) + kM,b(Tg) + kM,c(Tg) | (14) |
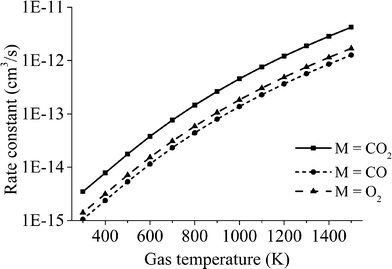
The averaged rate constant of each reaction is computed as in eqn (9), considering that the individual rate constants kv are scaled to the asymmetric vibrational level v and depend on the symmetric sublevel and the collision partner M. For each collision partner M, the temperature range of interest (300–1500 K) is evaluated as shown in Fig. 7. For each of the reactions with different collision partners, the rate constant is fitted to a modified Arrhenius equation with the aim of using a more practical expression in the model.
 | (15) |
Assuming a rapid VT relaxation of the symmetric sublevels and adding the reactions of all asymmetric levels within  , the following expression is obtained for V5 x = a:
 | (16) |
The reaction RV3 included in the model is a result of combining the previous reaction with the analogous reaction V5 for the symmetric level b. Once the two combined reactions are put together, RV3 can be written as:
 | (17) |
The stoichiometric coefficients νl3 and νs3 are computed as done in the previous section for RV2. The total averaged rate constant of reaction RV3 is estimated by adding the individual averaged rate constants of both reactions:
| k(Tg) = ka(Tg) + kb(Tg) | (18) |
The averaged rate constant of each reaction is computed as in eqn (9), considering that the individual rate constants kv are scaled to the asymmetric vibrational level v and depend on the symmetric sublevel.
The overall “lumped” rate constant calculated at various temperatures is fitted to a modified Arrhenius equation to obtain a temperature-dependent expression (see Table 4).
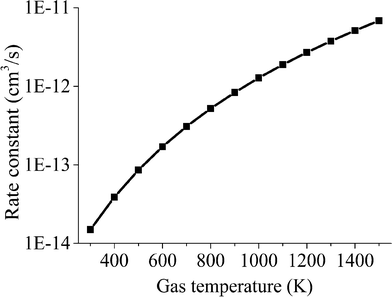
The results of the rate constant obtained at various temperatures are displayed in Fig. 8.
 | (19) |
Various surface reactions can occur in the reactor, such as recombination or vibrational de-excitation reactions. The characteristic diffusion time is orders of magnitude smaller than the residence time of the reactor,21 thus recombination reactions on the wall can be neglected. In the latter, the collision frequency is high enough to ensure a dominant vibrational de-excitation through VT relaxation processes. For the abovementioned reasons, neither recombination nor vibrational de-excitation reactions are included in the model. The included surface reactions are related to recombination or neutralization processes through which ions are grounded (green arrows in Fig. 1 and Table 5) and restore the neutral charge. Due to the low temperatures of heavy species, a unity sticking coefficient is assumed for these low energy collisions of ions with the walls.52,53 Moreover, ions are consumed in these reactions and thus are needed to avoid their accumulation inside the reactor. The expression presented to calculate the rate coefficients can be simplified to the one shown below as no surface species are involved in the reactions:
 | (20) |
| No | Process | Reaction | Sticking coefficient (γ) |
|---|---|---|---|
| RS1 | CO2+ neutralization | CO2+ → CO2 | 1 |
| RS2 | CO+ neutralization | CO+ → CO | 1 |
| RS3 | O+ neutralization | O+ → O | 1 |
| RS4 | O2+ neutralization | O2+ → O2 | 1 |
Results and discussion
In this section, a comparison of the results obtained from the proposed reduced model and the detailed STS kinetic model is performed. A qualitative study of the key model parameters is also carried out to identify which parameter displays the highest influence on the reduced model predictions. A simple reactor model was built in the COMSOL Multiphysics-plasma module54 for this purpose. Spatially uniform quasi-neutral plasma is assumed throughout the reactor volume.In the previous section, a description of the calculation process to estimate the rate constants for highly relevant chemical reactions in the dissociation kinetics of CO2 is provided. In this regard, the computed rate constants for reactions involving the lumped excited species  are shown in Fig. 9. Two different zones are distinguished in this figure. At low temperatures, below 700–800 K, the rate constants for the reactions with neutrals are relatively higher than the vibrational energy transfer reactions, thus leading to high dissociation rates of the CO2 molecule. At high temperatures though, above 800 K, the vibrational reactions become dominant, resulting in a drop in the dissociation rate at the expense of increasing the bulk gas temperature.
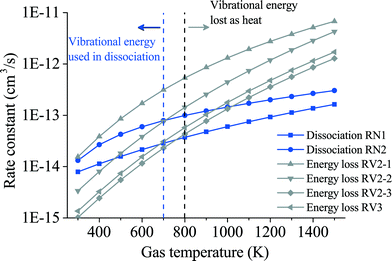 | ||
| Fig. 9 Rate constants of the main reactions leading to dissociation of the CO2 molecule (blue lines, RN1 and RN2) and the reactions causing energy loss (grey lines, RV2-1, RV2-2, RV2-3 and RV3). | ||
Validation of the model
The simulations to investigate the validity of the reduced kinetic model are carried out at the same conditions as reported in ref. 21. The discharge takes place at a pressure of 100 torr, reduced electric field of 50 Td, electron density 1013 cm−3, specific energy input 0.6 eV per molecule, frequency of the electromagnetic field 2.45 GHz and a residence time of 1.4 × 10⁻⁵ s. Elastic scattering and ionization reactions are not considered, and CO2+ is the only ion included for the quasi-neutrality of the plasma. The initial gas composition is a CO2 mole fraction of 1; the initial bulk gas temperature is 300 K and the initial electron temperature is 0.39 eV or 4500 K.In this work, the plasma medium is specified by the electron density and the mean electron energy. In the case of multidimensional simulations, where the spatial distribution and time evolution of the species concentration are to be studied, these parameters should be determined by solving the conservation laws and Boltzmann equation for the electrons. The energy equation is not included in the model. The electron and gas temperatures profiles in the reactor volume are specified as functions fitted to the results given in ref. 21. Viscosity effects are neglected and the pressure is considered uniform and constant inside the reactor.
Mass conservation equations are solved for the species to validate the reaction kinetics. Diffusion is neglected given its relatively short characteristic time. Thus, for this specific validation model the surface reactions are not included and the charged species densities are constant. This is done for consistency with ref. 21, even though the results are not affected by the kinetics of charged species. Convection is not considered and time-dependent simulations are performed based on the residence time value.
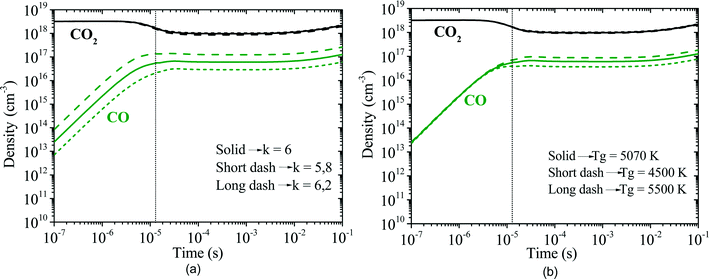
The model is divided into two parts describing two spatial zones; these are the plasma zone, where the plasma is active, and the afterglow zone, where the plasma vanishes. In the former, a constant electron density and an increasing electron temperature profile describe the chemically reactive (plasma) zone. In the latter, the electron density is set to zero, whereas a decreasing electron temperature profile is specified to describe the zone where reactive species relax back to equilibrium and radicals recombine. It is known that the electron density is not constant in either zone, but setting a constant electron density seems to be a good approximation to study the influence of chemical reactions in the overall reactive scheme. The total simulation time is fixed to 0.1 s, which is long enough for the relaxation process (VT and VV′) to take place. In conclusion, the inputs required for the model are the electron density, electron temperature, bulk gas temperature and pressure. The comparison of the benchmark STS kinetic model versus the proposed reduced kinetic model is displayed in Fig. 10 where the division of both zones can be observed. As expected, the dissociation of CO2 occurs mainly in the plasma zone, whereas recombination processes take place in the afterglow.
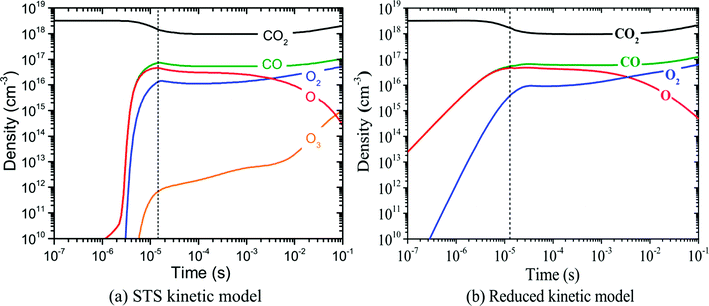 | ||
| Fig. 10 (a) Population densities computed by the STS kinetic model, adapted from ref. 21. (b) Population densities calculated by the reduced kinetic model of the most relevant neutral species. | ||
The major difference as for the computed species concentrations is found in the plasma zone. In the afterglow, the species densities are in good agreement with the STS kinetic model. Notably, the predicted CO2 density is virtually exact in both models, which in turn allows the calculation of the CO2 dissociation rate. On the other hand, the concentrations of CO and O2 present an error lower than 10% and 20%, respectively. The steep slopes noticed in the time range 10−6–10−5 in Fig. 10a are the result of the STS kinetic model. The processes by which the energy is transferred from the electrons to the lower levels of the vibrational ladder and then progressively transferred by VV relaxation to higher levels have a time scale of ∼10−6 s. Once the highest vibrational levels are excited, the dissociation of CO2 starts taking place until the VT relaxation rates become comparable to the VV relaxation ones at about 10−5 s and therefore the dissociation rate declines. In the abovementioned time range, the stored vibrational energy enhances the dissociation processes by lowering the activation energy of the reactions. The rate constants for the dissociation processes are rather high, which explains the sharp increase in the densities of CO and O. The increase in the O2 concentration is mainly due to the O recombination reaction (RN5, Table 3). Concerning the reduced kinetic model, it is assumed that at low bulk gas temperatures, the lumped excited state  has a large population of the high vibrational levels, thus initiating the production of CO and O as soon as the species
  is formed by means of electron collisions. This explains the slower dissociation process taking place in the reduced kinetic model in the range 10−7 to 10−5 s.
It is noted that the predictions given by the model can be improved by adjusting the assumed value of the Tv/Tg ratio (see Simplification approach section) at low temperature. The value can be experimentally determined by measuring the vibrational and gas temperatures of the discharge, for instance, by optical emission spectroscopy.41 This fact offers an evident benefit since the STS kinetic model does not enable such tuning due to the large number of reactions. At the very early stage in the plasma zone (10−7–10−6 s), the results of the reduced kinetic model do not match the ones from the STS model. Conversely, the densities calculated at the end of the plasma zone and the afterglow do match the predictions of the STS model. To validate other process conditions, the electron dynamics and the energy equation should be included in the model.
Effect of model parameters
The results presented in Fig. 10b are calculated using constant values of the following model parameters: stoichiometric coefficients νl2 = 0.262, νs2 = 0.246, νl3 = 0.262 and vs3 = 0.869 for a mean bulk gas temperature of 500 K in the discharge (plasma zone and afterglow). In the section Description of the model, it was shown that these factors are functions of the bulk gas temperature. As stated in ref. 21, the gas temperature increases from 300 to 560 K over the residence time in the plasma zone; therefore an alternative mean bulk gas temperature of 300 K is considered to study the effect of these parameters on the model predictions. It was proven that the error induced by keeping the parameters constant is relatively small since the species concentrations follow nearly the same trends. In this regard, the effect of the Tv/Tg ratio at the initial gas temperature (300 K) and the assumed gas temperature at which thermal equilibrium is reached are evaluated and displayed in Fig. 11.As expected, when the value of Tv/Tg is higher (Tv/Tg = 6.2 – long dash line) the dissociation rate increases and vice versa (Tv/Tg = 5.8 – short dash line). As previously stated, the value of Tv/Tg at low temperatures can be seen as the dissociation potential; the higher the Tv/Tg value, the higher the vibrational energy stored in the molecules, thus conducting the process toward higher dissociation rates. The gas temperature at which the plasma becomes thermal seems to be much less influencing than the Tv/Tg ratio at low temperature. Lastly, it is shown that the value of Tv/Tg at low temperature has a higher influence on the predictions of the CO2 dissociation rate, whereas the gas temperature at which quasi-equilibrium plasma conditions are reached does not have a major effect on the overall process. In this regard, experimental validation of the concept proposed in this work, where the Tv/Tg values are taken from ref. 21, needs to be carried out through measurements of the vibrational and gas temperatures in a pure CO2 microwave discharge via optical emission spectroscopy. However, the experimental determination of these two temperatures is complex and only approximate values can be obtained using current plasma diagnostic techniques. Lastly, the actual implementation of the proposed kinetic model has not yet been done in multidimensional simulations. The computation of local rate constants considering spatial variations of the Tv/Tg ratio can be highly complex. Hence, a better approach is to use a characteristic Tv/Tg value to describe the reactor performance and keep the computational load at its minimum.
Conclusions
We have introduced a new methodology to simplify detailed plasma vibrational kinetics and applied it to the dissociation of CO2 in non-equilibrium microwave plasma discharges. In this type of discharges, the dissociation kinetics of the CO2 molecule are driven by the excitation of the highest vibrational levels of the asymmetric stretching mode. The novelty of the proposed model lies in four key elements: 1) the 21 vibrational levels considered for the asymmetric stretching mode are lumped within a single group or fictitious species, , 2) this group follows the so-called non-equilibrium Treanor distribution, 3) an algebraic approximation is used to compute the vibrational temperature from the translational temperature based on the Landau–Teller formula and 4) weighted algebraic expressions are applied, instead of complex differential equations, to calculate the rates of the most influencing reactions. The reduced kinetic model comprises 44 reactions among 13 species, as opposed to our benchmark detailed kinetic model, in which 100+ species and 10
![[thin space (1/6-em)]](https://www.rsc.org/images/entities/char_2009.gif) 000+ reactions are considered, thus reducing substantially the calculation time to less than a minute. For the validation of the reduced kinetic model, a reactor model was built in COMSOL Multiphysics. The predictions of the reduced kinetic model showed that the neutrals' densities are in good agreement with those predicted by the STS kinetic model, notably at the end of the plasma zone and the afterglow, which represent the reactor outlet.
000+ reactions are considered, thus reducing substantially the calculation time to less than a minute. For the validation of the reduced kinetic model, a reactor model was built in COMSOL Multiphysics. The predictions of the reduced kinetic model showed that the neutrals' densities are in good agreement with those predicted by the STS kinetic model, notably at the end of the plasma zone and the afterglow, which represent the reactor outlet.
The calculation process for the rate constants of the most influencing chemical reactions in the dissociation kinetics was described. Moreover, it was shown that the bulk gas temperature highly affects the dissociation rate as expected. Remarkably, at temperatures below 700 K, the dissociation rates are faster than the VT relaxation processes, thus resulting in higher conversion. Furthermore, a qualitative analysis of the key model parameters was carried out. The value of the Tv/Tg ratio at low temperature had a considerable effect on the calculation process. This ratio can be used as a fitting parameter to link the presented plasma kinetic model to experimentally measured vibrational and gas temperatures via optical emission spectroscopy. At this stage of development, where current models are in qualitative agreement with experimental data, the introduction of an experimentally obtained parameter describing the non-thermal degree of the discharge can facilitate the transition from STS to more practical models suitable for engineering purposes. Furthermore, this parameter may be used to fit experimental data to the model, improving the overall accuracy of the predictions.
To further assess the influence of plasma/process parameters, the electron dynamics and energy equations should be included in the model. This will be the next step towards development of a self-consistent multidimensional model for non-thermal plasma reactors. As a final note, we believe that the presented approach can also be applied to other plasma chemistries, in which the vibrational kinetics are dominant in the dissociation process.
Acknowledgements
This research was supported by Alternative Energy Forms for Green Chemistry (ALTEREGO), a European cooperation project funded within the 7th Framework Programme with grant agreement No. 309874.References
- J. F. Griffiths, Prog. Energy Combust. Sci., 1995, 21, 25–107 CrossRef CAS.
- J. Amouroux, P. Siffert, J. P. Massue, S. Cavadias, B. Trujillo, K. Hashimoto, P. Rutberg, S. Dresvin and X. H. Wang, Prog. Nat. Sci., 2014, 24, 295–304 CrossRef CAS.
- S. Sabihuddin, A. E. Kiprakis and M. Mueller, Energies, 2015, 8, 172–216 CrossRef.
- S. Hameer and J. L. van Niekerk, Int. J. Energy Res., 2015, 39, 1179–1195 CrossRef.
- T. M. I. Mahlia, T. J. Saktisandan, A. Jannifar, M. H. Hasan and H. S. C. Matseelar, Renewable Sustainable Energy Rev., 2014, 33, 532–545 CrossRef.
- J. Amouroux and P. Siffert, Spie Eco-Photonics 2011, 2011, vol. 8065, p. 80650E Search PubMed.
- Q. Wang, B. Spasova, V. Hessel and G. Kolb, Chem. Eng. J., 2015, 262, 766–774 CrossRef CAS.
- J. R. Roth, Indutrial plasma engineering, IOP Publishing Ltd: British Library, 1995 Search PubMed.
- R. Aerts, W. Somers and A. Bogaerts, ChemSusChem, 2015, 8, 702–716 CrossRef CAS PubMed.
- H. H. Kim and A. Ogata, Eur. Phys. J.: Appl. Phys., 2011, 55, 13806 CrossRef.
- V. D. Rusanov, A. A. Fridman and G. V. Sholin, Usp. Fiz. Nauk, 1981, 134, 185–235 CrossRef CAS.
- A. Fridman, Plasma Chemistry, Cambridge University Press, Cambridge, 2008 Search PubMed.
- Y. G. Ju and W. T. Sun, Prog. Energy Combust. Sci., 2015, 48, 21–83 CrossRef.
- Y. Yang, W. Hua and S. Y. Guo, Phys. Plasmas, 2014, 21, 040702 CrossRef.
- M. Baeva, A. Bosel, J. Ehlbeck and D. Loffhagen, Phys. Rev. E: Stat., Nonlinear, Soft Matter Phys., 2012, 85, 056404 CrossRef CAS PubMed.
- M. Jimenez-Diaz, E. A. D. Carbone, J. van Dijk and J. J. A. M. van der Mullen, J. Phys. D: Appl. Phys., 2012, 45, 335204 CrossRef.
- P. Gokulakrishnan, R. Joklik, D. Viehe, A. Trettel, E. Gonzalez-Juez and M. Klassen, J. Eng. Gas Turbines Power, 2014, 136, 011503 CrossRef.
- A. Cenian, A. Chernukho, V. Borodin and G. Sliwinski, Contrib. Plasma Phys., 1994, 34, 25–37 CrossRef CAS.
- E. V. Kustova and E. Nagnibeda, Chem. Phys., 2006, 321, 293–310 CrossRef CAS.
- T. Kozak and A. Bogaerts, Plasma Sources Sci. Technol., 2014, 23, 045004 CrossRef.
- T. Kozak and A. Bogaerts, Plasma Sources Sci. Technol., 2015, 24, 015024 CrossRef CAS.
- G. van Rooij, D. van den Bekerom, N. den Harder, T. Minea, G. Berden, W. Bongers, R. Engeln, M. Graswinckel, E. Zoethout and M. van de Sanden, Faraday Discuss., 2015, 183, 233–248 RSC.
- A. Stagni, C. Saggese, M. Bissoli, A. Cuoci, A. Frassoldati, T. Faravelli and E. Ranzi, Iconbm: International Conference on Biomass, Pts 1 and 2, 2014, vol. 37, pp. 877–882 Search PubMed.
- T. E. Magin, M. Panesi, A. Bourdon, R. L. Jaffe and D. W. Schwenke, Chem. Phys., 2012, 398, 90–95 CrossRef CAS.
- A. Guy, A. Bourdon and M. Y. Perrin, Chem. Phys., 2013, 420, 15–24 CrossRef CAS.
- H. P. Le, A. R. Karagozian and J. L. Cambier, Phys. Plasmas, 2013, 20, 123304 CrossRef.
- L. F. Spencer and A. D. Gallimore, Plasma Sources Sci. Technol., 2013, 22, 015019 CrossRef.
- K. Peerenboom, A. Parente, T. Kozak, A. Bogaerts and G. Degrez, Plasma Sources Sci. Technol., 2015, 24, 025004 CrossRef.
- Y. Itikawa, J. Phys. Chem. Ref. Data, 2002, 31, 749–767 CrossRef CAS.
- K. Kameta, N. Kouchi and Y. Hatano, in Interactions of Photons and Electrons with Molecules, ed. Y. Itikawa, Springer, Berlin, Heidelberg, 2003, ch. 1, vol. 17, pp. 4001–4061 Search PubMed.
- A. Zecca, G. P. Karwasz and R. S. Brusa, Riv. Nuovo Cimento Soc. Ital. Fis., 1996, 19, 1–146 CrossRef CAS.
- Y. Itikawa, J. Phys. Chem. Ref. Data, 2009, 38, 1–20 CrossRef CAS.
- R. R. Laher and F. R. Gilmore, J. Phys. Chem. Ref. Data, 1990, 19, 277–305 CrossRef CAS.
- H. T. Zheng and Q. Liu, Math. Probl. Eng., 2014, 2014, 938618 Search PubMed.
- A. H. Markosyan, A. Luque, F. J. Gordillo-Vazquez and U. Ebert, Comput. Phys. Commun., 2014, 185, 2697–2702 CrossRef CAS.
- G. Colonna, I. Armenise, D. Bruno and M. Capitelli, J. Thermophys. Heat Transfer, 2006, 20, 477–486 CrossRef CAS.
- G. Colonna, L. D. Pietanza and M. Capitelli, J. Thermophys. Heat Transfer, 2008, 22, 399–406 CrossRef CAS.
- A. Berthelot and A. Bogaerts, Plasma Sources Sci. Technol., 2016, 25, 045022 CrossRef.
- C. E. Treanor, J. W. Rich and R. G. Rehm, J. Chem. Phys., 1968, 48, 1798–1807 CrossRef CAS.
- H. S. Kwak, H. S. Uhm, Y. C. Hong and E. H. Choi, Sci. Rep., 2015, 5, 18436 CrossRef CAS PubMed.
- T. Silva, N. Britun, T. Godfroid and R. Snyders, Plasma Sources Sci. Technol., 2014, 23, 025009 CrossRef.
- L. D. Pietanza, G. Colonna, G. D'Ammando, A. Laricchiuta and M. Capitelli, Chem. Phys., 2016, 468, 44–52 CrossRef CAS.
- K. Anzai, H. Kato, M. Hoshino, H. Tanaka, Y. Itikawa, L. Campbell, M. J. Brunger, S. J. Buckman, H. Cho, F. Blanco, G. Garcia, P. Limao-Vieira and O. Ingolfsson, Eur. Phys. J. D, 2012, 66, 36 CrossRef.
- S. J. Buckman, M. T. Elford, M. Inokuti, Y. Itikawa and H. Tawara, Interactions of Photons and Electrons with Atoms, Springer-Verlag, Berlin/Heidelberg, 2000 Search PubMed.
- Y. Itikawa, Springer Series on atomic, optical and plasma physics, Molecular processes in plasmas, Springer, Berlin, Heidelberg, 2007, vol. 43 Search PubMed.
- R. D. Levine and R. B. Bernstein, in Dynamics of Molecular Collisions, ed. W. Miller, Springer, US, 1976, ch. 7, vol. 2, pp. 323–364 Search PubMed.
- J. A. Blauer and G. R. Nickerson, Report, Ultrasystems, Inc, 1973 Search PubMed.
- T. Kozák, Private communication, 2015 Search PubMed.
- R. N. Schwartz, Z. I. Slawsky and K. F. Herzfeld, J. Chem. Phys., 1952, 20, 1591–1599 CrossRef CAS.
- J. Keck and G. Carrier, J. Chem. Phys., 1965, 43, 2284–2298 CrossRef CAS.
- R. J. Kee, Chemically Reacting Flows, John Wiley & Sons, Inc., Hoboken, NJ, USA, 2003 Search PubMed.
- K. Hassouni, F. Silva and A. Gicquel, J. Phys. D: Appl. Phys., 2010, 43, 153001 CrossRef.
- A. J. Ryan, Emerging Themes in Polymer Science, The Royal Society of Chemistry, 2001 Search PubMed.
- Plasma Module User's Guide COMSOL Multiphysics 4.4, 2013 Search PubMed.
Footnote |
| † The first two authors had equal contribution to the work. |
| This journal is © The Royal Society of Chemistry 2016 |


