
Upgrading of bio-oil and subsequent co-processing under FCC conditions for fuel production
Thuan Minh
Huynh
*ab,
Udo
Armbruster
a,
Hanan
Atia
a,
Ursula
Bentrup
a,
Binh Minh Quoc
Phan
b,
Reinhard
Eckelt
a,
Luong Huu
Nguyen
b,
Duc Anh
Nguyen
b and
Andreas
Martin
*a
aLeibniz Institute for Catalysis at University of Rostock, Albert Einstein Str. 29a, 18059, Rostock, Germany. E-mail: thuan.huynh@catalysis.de; andreas.martin@catalysis.de; Fax: +49 381128151309; Tel: +49 381128151246
bVietnam Petroleum Institute, 167 Trung Kinh, Cau Giay, Hanoi, Vietnam
First published on 14th December 2015
Abstract
Hydrodeoxygenation of fast pyrolysis oil was first investigated on bimetallic catalysts (homogeneous Ni–Co alloy) supported on various carriers (HZSM-5, HBeta, HY and ZrO2). The bimetallic catalyst 10Ni10Co/HZSM-5 outperformed the corresponding monometallic catalysts and Ni–Co supported on other support materials (HBeta, HY and ZrO2) with 39% deoxygenation degree and 37 wt% (wet basis) oil yield. 13C-NMR spectroscopy, GC, GC-MS, and elemental analysis revealed that the chemical composition of the product changed significantly and the higher heating value increased substantially from 23.6 to 33.3 MJ kg−1. The upgraded bio-oil was subsequently co-fed with a conventional feed (atmospheric distillation residue) using a commercial micro activity test setup under FCC conditions with an equilibrated commercial refinery catalyst to demonstrate a possible route for production of fuel from biomass. These tests showed similar conversion for both the conventional and co-processed feeds, whereas the latter case revealed a reduction of heavy cycle oil and a slight increase of gasoline, gas and light cycle oil yields.
Introduction
The utilization of biofuels (biodiesel, bioethanol) based mostly on plant oils, sugar cane and corn has increased dramatically in the past two decades.1 This is mainly due to the foreseeable shortage of fossil fuels, the steadily increasing global energy demand and the growing environmental concerns.1,2 However, the energetic use of such feedstock competes with other outlets (e.g. food, pharmaceuticals). Therefore, the access to second-generation biofuels from non-food and/or waste biomass resources is an attractive option to avoid the competition with food supply chain. On the other hand, many countries have implemented mandatory legislation for the use of renewable energy, e.g., the European Union (EU) renewable energy directive sets a target for the EU to consume 20% of its final energy from renewable sources by 2020 and the U.S. Department of Energy sets a target to produce 20% of transportation fuel from biomass.3There are several pathways to convert biomass to liquid fuels via biochemical or thermochemical processes. In the latter case, bio-oil is a primary product obtained from fast pyrolysis of biomass with 60–70 wt% carbonaceous matter based on dry feed and additionally it shows a higher density and heating value than the original biomass.4,5 Thus, it has attracted considerable attention all over the world. In this respect, we recently evaluated the potential of bio-oil production from various biomass feedstocks via fast pyrolysis technology.6 The obtained bio-oils fulfill the ASTM D7544-12 standard and can be used either directly as combustion fuel (heat, electricity) or upgraded to transportation fuels or chemicals. The primary reasons that make bio-oil unsuitable for direct use as a fuel component are the high oxygenate (35–50 wt%) and water contents (15–30 wt%), high acidity and immiscibility with petroleum fuel,7,8 which in turn indicate the need of bio-oil upgrading.
Indeed, several aspects of upgrading of bio-oil via hydrotreating or hydrodeoxygenation (HDO) have been studied with model compounds or bio-oil, e.g. as recently reviewed by Elliott,9 Choudhary and Phillips10 and Mortensen et al.11 Noble metal catalysts (e.g., Ru/C, Ru/Al2O3, Ru/TiO2, Pd/C, Pt/C) and hydrotreating catalysts (NiMoS2/Al2O3, CoMoS2/Al2O3) have intensively been used for this process e.g. by Elliott et al.12,13 and Wildschut et al.14,15 The latter group reported a range of oil yields on dry basis from 25 to 65 wt% with oxygen contents of 6–11% depending on catalyst type under severe conditions (200 bar, 350 °C). It should be emphasized that bio-oil possesses 15–30 wt% water, thus it might be advantageous if the reaction is carried out in an aqueous environment. In addition, water is “green”, environmentally suitable as well as easy and safe to handle. In this context, Duan and Savage reported on the hydrotreatment of bio-oil derived from algae liquefaction in supercritical water with Pt/C, Mo2C, and HZSM-5 at high temperature and pressure (400–530 °C, 340 bar).16–18 Nevertheless, the total removal of oxygenates from bio-oil for direct use in transportation fuels is very challenging. A high input energy and severe reaction conditions are required to reach complete conversion and high degree of deoxygenation. Furthermore, high investment cost might also incur for a standalone plant to convert bio-oil to biofuels.
Thus, another strategy has been proposed to upgrade bio-oil under mild conditions to just partially reduce oxygenates in order to provide a suitable co-feed for further processing together with conventional crude oil products in an existing refinery unit. In this regard, French et al.19 proposed mild hydrotreating of bio-oil to produce a suitable feed for refinery. Venderbosch et al.20 proposed a stabilization step for bio-oil by mild hydrotreating using a Ru catalyst.
On the other hand, some researchers propose a direct use of bio-oil for catalytic cracking in a standard refinery as a near-term application; however, several cumbersome issues are observed (e.g. significant amount of coke formation, fast polymerization), which lead to a more severe catalyst deactivation compared to the usually used FCC process. Thus, direct use of an untreated bio-oil in a standard refinery unit is not considered as a straightforward option.
The co-feeding of bio-oil with a conventional feed in standard refinery units as a promising strategy due to the utilization of the existing infrastructures for processing, transport and distribution of liquid fuel as well as the guarantee of product quality is still under debate. A fluid catalytic cracking (FCC) unit appears as a suitable choice because it transforms high molecular weight compounds to more valuable products, namely gasoline, liquefied petroleum gas (LPG), olefins, and light cycle oil (LCO) for fuels or the petrochemical industry. Moreover, FCC is flexible for changing feedstock and product specifications depending on market demands.
In order to get more insight into co-feeding of such bio-oil into a FCC unit, several attempts have been reported for co-processing of various oxygenated model compounds for bio-oil in a lab-scale FCC unit, e.g., by Corma et al.,21 Domine et al.,22 and Graça et al.23,24 The latter group reported that a maximum amount of 10 wt% of oxygenated compounds (related to gas–oil) can be fed to a FCC unit without major problem. Few reports on co-feeding of HDO products of bio-oil into a FCC unit using standardized micro activity test units (MAT) have been presented. For example, Mercader et al.25 observed that the mixed feed led to a lower conversion than that obtained with a conventional feed (vacuum distillation residue – long residue) and in order to obtain an equivalent conversion, a slightly higher catalyst to oil (CTO) mass ratio was required. Depending on the nature of different bio-oils treated at 60 wt% conversion, CTO ratios in the range of 3.4–4.3 (g g−1) were required for the co-feeding of 20 wt% hydrotreated oils compared to 3.1 (g g−1) for 100% long residue. The authors also reported that the required CTO ratio was even higher (in the range of 12–20 g g−1) when cracking 100% undiluted hydrotreated oil at the same conversion. On the other hand, Fogassy et al.26 showed that the conversion obtained from co-processing of hydrotreated bio-oil with vacuum gas oil (VGO) is higher than that obtained from pure VGO feed experiment. Another study by Samolada et al.27 on co-feeding of hydrotreated bio-oil and an aromatic feedstock (15/85 wt wt−1) using two commercial FCC catalysts (ReUSY1, ReUSY2) showed that the conversion of these mixtures is slightly lower than that of the ordinary VGO. However, the limited crackability of the aromatics in conventional feedstock seemed to be the primary reason rather than the reactivity of the co-feed. In sum, the overall conversion in co-processing of hydrotreated bio-oil with a conventional feedstock in the FCC unit depends on the nature of conventional feeds, FCC catalysts and reaction conditions.28
As a result, co-processing of biomass-derived resources together with a conventional feed in a standard refinery unit is considered as a realistic scenario to increase the fraction of bio-based fuel components in the short term, which has motivated us to work on this field. A successful solution requires an effective HDO process and the subsequent tuning of the FCC process. In recent studies,29,30 we have developed active bimetallic Ni–Co catalysts using HDO of phenol as a model compound for bio-oil to replace noble metal catalysts and to overcome some drawbacks (deactivation, coke formation, cost). In this study, the step from the model reaction to the conversion of real bio-oil is performed. The impact of reaction conditions as well as the effect of different supports for Ni–Co bimetallic catalysts on bio-oil HDO is described. The product obtained with the best-performing catalyst was subsequently co-fed with a conventional feed (atmospheric distillation residue) in a MAT unit under realistic FCC conditions to demonstrate the potential of co-processing for the regular FCC process.
Experimental
Catalyst preparation
All catalysts were prepared by a wet impregnation method using various zeolites like HZSM-5 (PZ-2/25H – SiO2/Al2O3 = 34, Zeochem AG), HBeta (PB/H – Zeochem AG), NH4-Y (CBV712 – Zeolyst) and ZrO2 (Saint-Gobain NorPro GmbH) as supports. Prior to impregnation, NH4-Y was calcined at 550 °C for 4 h to get the HY form. The other supports were calcined at 450 °C for 2 h to remove physisorbed water. Ni(NO3)2·6H2O (Merck) and Co(NO3)2·6H2O (Fluka) were used as precursors for Ni and Co, respectively. In a typical preparation, the calculated amount of precursor was dissolved in a known amount of deionized water and subsequently such a solution was in contact to a support under stirring at room temperature (RT) for 16 h. Excess water was removed using a rotavap and the samples were ground, dried overnight and then calcined at 550 °C for 4 h. Before the reaction, the calcined catalysts were reduced in H2 flow (100 ml min−1) in a tubular reactor with a heating rate of 10 K min−1 to 650 °C and kept for 4 h. The catalysts were denoted as xNiyCo/Z, where x and y are the rounded up contents (wt%) of nickel and cobalt, respectively, and Z is the name of the support.Catalyst characterization
The methods used for catalyst characterization are described in detail in our previous study29 and are presented shortly as follows.Metal contents (Ni, Co) of the calcined catalysts were determined by ICP-OES (715-ES, Varian).
Nitrogen physisorption measurements were performed on a Micromeritics ASAP 2010 apparatus at −196 °C. Prior to analysis, the calcined catalysts were degassed at 200 °C in vacuum for 4 h.
The X-ray powder diffraction (XRD) measurements used for the phase composition study were carried out using a theta/theta diffractometer (X'Pert Pro from PANalytical, Almelo, Netherlands) with CuKα radiation (λ = 1.5418 Å, 40 kV, 40 mA) and an X'Celerator RTMS detector. The samples were scanned in the 2theta range of 5–80°. The crystallite size was calculated by using the Scherrer equation.
Pyridine IR measurements were carried out on a Bruker Tensor 27 spectrometer equipped with a homemade reaction cell with CaF2 windows. The pre-reduced catalysts were pretreated in 5% H2/He at 400 °C for 10 min. After cooling to RT and evacuation, the pyridine adsorption was performed until saturation. Then, the reaction cell was evacuated to remove physisorbed pyridine and finally the desorption of pyridine was followed by heating the sample in vacuum to 300 °C and recording spectra every 50 K.
Temperature programmed oxidation (TPO) measurement was done using a Micromeritics AutoChem II 2910 instrument connected to an online quadrupole mass spectrometer (Balzers Omnistar). The spent catalyst (60 mg) was loaded into a U-shaped quartz reactor and pretreated at 200 °C for 60 min in He flow (50 ml min−1) for the removal of adsorbed water, then cooled to RT. The samples were then heated from RT to 580 °C in a flow of 5% O2/He (50 ml min−1) with a ramp of 10 K min−1.
The coke deposition on the spent catalyst was also analyzed using a CHN analyzer (LECO-CS600).
HDO of bio-oil
In a typical test, 5 g of bio-oil, 25 g of H2O and 0.5 g of catalyst were loaded into an autoclave (100 ml, Parr Instruments). The autoclave was flushed with N2 and then with H2 to remove air. Then, the reactor was pressurized with H2 to 50 bar at RT. Subsequently, the autoclave was heated to the desired temperature. The start time was recorded when the temperature was reached and then the stirring speed was set to 650 rpm. After completing the reaction, the autoclave was cooled to RT, the gas phase was collected using a syringe and analyzed by a gas chromatograph (GC) (see below).After gas phase analysis, the remaining gas in the autoclave was released to atmospheric pressure. Dichloromethane (DCM) was used to recover the organic phase and to extract the aqueous phase (two times). All of the DCM extracts were combined and then the solvent was evaporated at 27 kPa and RT for 45 min; the resulting oil phase is denoted as upgraded bio-oil (UBO). The catalyst together with solid products was recovered by filtering off and rinsing with acetone before drying and weighing. The amounts and compositions of the oil phase, aqueous phase, solid (coke/char) and gas phase were determined experimentally and the yields for the products (wt% on wet basis) were calculated by dividing by the amount of bio-oil loaded into the autoclave. A CHN analyzer was used for determining of coke formation in the spent catalysts. All experiments were performed in duplicate or more and the average number was presented with the experimental error of product yields less than 5 wt%.
The following paragraphs explain the methods for feed and product analyses and catalyst evaluation.
The gas phase was analyzed using a GC (Agilent 7890), which was equipped with both FID and TCD using Ar as carrier gas. The TCD channel was configured with three columns (0.5 m HayeSep Q 80/100 mesh, 6 ft HayeSep Q 80/100 mesh, and 6 ft Molecular Sieve 5A 60/80 mesh) to analyze H2, CO2, CO, O2, N2 and light hydrocarbons as CH4. The FID channel was configured with two columns (DB-1 123–1015 (cut) 2 m × 0.32 mm × 5 μm, HP-AL/S 19091P-S12 25 m × 0.32 mm × 8 μm) to analyze hydrocarbons (C1–C5). The following temperature program was applied: 60 °C (2 min), 20 K min−1 to 190 °C (2 min). A reference gas was used for peak identification and calibration. The amounts of formed gases (except H2) were calculated based on calibration and summed up to the gas phase amount.
To identify compounds in the bio-oil and the aqueous and DCM phases, a GC-MS (Agilent 7890 GC coupled with a mass spectrometer 5970C) equipped with a DB-1701 column (60 m × 0.25 mm × 0.25 μm) was used (temperature program: 40 °C (10 min), 4 K min−1 to 280 °C (20 min)).
The water content of the original bio-oil and the UBO was determined by Karl-Fischer titration (MKS-520 Mettler Toledo) according to ASTM E203. pH measurement of the bio-oil was carried out on a UB-10 pH/mV/Temp (Denver Instrument) according to ASTM E70.
The elemental compositions (C, H, N) of the original bio-oil and UBO were determined using a CHN Vario Macro analyzer (Elementar Analysensysteme) according to ASTM D5291-10. The dry elemental compositions were calculated by subtracting the contribution of H and O originating from measured water and then the oxygen content was calculated by difference. These results were used for calculating the degree of deoxygenation (DOD) and the higher heating values (HHV) using a unified correlation proposed by Channiwala and Parikh.31 Note that the contents of sulfur (S) and ash were not used for calculation in this study.


13C-NMR spectra of the original bio-oil and UBO were recorded on a 500 MHz-spectrometer (Avance III 500, Bruker) at 125 MHz. The sample (10 mg) was dissolved and filled up with CDCl3 up to volume of 0.6 ml.
Catalytic cracking under FCC conditions
To predict and evaluate the FCC catalyst activity and selectivity, the MAT technique has become a widely applied method in laboratories, instead of performing time-consuming and costly test runs in pilot plants or commercial units. In this study, the FCC reaction was performed in a fully automated Single Receiver-Short Contact Time-Micro Activity Test (SR-SCT-MAT) unit supplied by Grace Davison. The use of such a traditional fixed bed SR-SCT-MAT unit simulates accurately a commercial cracking unit with a fluidized bed reactor. The system operates with a single shot at a very short contact time. The reactor was designed with zero dead volume and a feed injection with both oil and nitrogen was modified to simulate a transition state from the feed injection to the stripping phase as in a standard unit. Finally, a single receiver serves to collect liquid and gaseous products.32 This setup consists of three main parts (Fig. 1): oil injection, reaction (an annular gap fixed bed reactor embedded in a three-zone furnace) and product collection (glass receiver). | ||
| Fig. 1 Experimental setup of the SR-SCT-MAT unit. | ||
Prior to a run, the equilibrated catalyst was calcined in air at 540 °C for 3 h. The catalyst was diluted with glass beads before being fed into the reactor, and the CTO mass ratio was varied by keeping a constant feed and changing the catalyst weight. Before the reaction, the catalyst was preheated at the reaction temperature for 1 h in a N2 flow of 40 ml min−1. Normally 1.75 g of oil (either a conventional feed or a mixture of UBO and the conventional feed) was fed into a syringe in the oil injection part. The system automatically performed a pressure drop measurement and leak check and then the oil was injected by the syringe drive within 30 s for both oil and N2. The oil injection (2 ml) always took 12 s, and afterwards 3 ml of N2 was added within 18 s. After completion of injection and reaction, N2 was used to purge the system and the liquid and gaseous products were transferred into the receiver. At the end, the gas and liquid phases were taken from the receiver for GC analysis. The spent catalyst was separated from the glass beads and its coke content was determined using the CHN analyzer.
The gas phase was analyzed in the GC as described in the previous section. The gaseous products included CO2, CO, H2 and gaseous hydrocarbons. The C5+ gases were quantified in this GC and this fraction was formally added to the gasoline fraction. The liquid phase was analyzed by a GC-SIMDIS (Agilent 7890) with electronic pressure control (EPC), configured with a FID (DB-1, 10 m × 530 μm × 2.65 μm). Temperature program: 40 °C to 350 °C at 20 K min−1, held for 5 min. The liquid products are classified into various fractions based on boiling ranges: gasoline (C5 – 211 °C), light cycle oil (LCO; 221–360 °C), and heavy cycle oil (HCO; >360 °C).
The composition of the gasoline fraction was analyzed using a GC-PIONA system (Agilent 7890A) equipped with Hydrocarbon Expert software from Separation System Inc. The GC was configured with a pre-fractionator inlet for gasoline separation and a SP-009 column (100 m × 0.25 mm × 0.5 μm) connected to a FID. This method helps to identify the hydrocarbons in the gasoline fraction groupwise roughly up to C15 (n-paraffins, iso-paraffins, olefins, aromatics, and naphthenes).
All calculation methods and software were provided by Grace Davison. The yield (Y) for the products (gas, gasoline, LCO, HCO and coke) and the MAT conversion (X) were calculated based on weight (W) according to the following equations. A balancing factor (F) was used as the mass balance was found not equal to 100%. Note that the recovery of coke is considered to be 100%.


| X = 100 − (YLCO + YHCO) |
The mass balance was between 96 and 101% of the injected feed in all runs.
Results and discussion
Characterization of catalysts
Table 1 summarizes some typical data of differently supported pre-reduced catalysts and spent samples (recovered from the HDO tests as described below). As expected, sample 10Ni10Co/ZrO2 possesses a significantly lower surface area (SBET) compared to the zeolitic samples. The average crystallite size of metal particles was calculated using the Scherrer equation and 10Ni10Co/HZSM-5 exhibited the smallest particles with roughly 15 nm, whereas for the other catalysts they vary from 19–30 nm.| Samples | Metal contents (wt%) | N2 adsorbed volume at STPa (cm3 g−1) | S BET (m2 g−1) | Acidity (μmol g−1) | Crystallite size (nm) | Coke deposited on spent catalystc (wt%) | |||
|---|---|---|---|---|---|---|---|---|---|
| Ni | Co | BS | LS | Total acidity | |||||
| a STP: standard temperature and pressure (1 bar, 0 °C). b S BET = surface areas of fresh catalysts, BS – Brønsted sites, LS – Lewis sites. c Coke formation on the spent catalyst obtained from the tests with different supports. | |||||||||
| 10Ni10Co/ZrO2 | 9.8 | 9.8 | 12 | 40 | 0 | 44 | 44 | 30 | — |
| 10Ni10Co/ZrO2 – spent | 14 | 50 | — | — | — | — | 2.5 | ||
| 10Ni10Co/HBeta | 10.0 | 9.9 | 102 | 434 | 137 | 984 | 1121 | 23 | — |
| 10Ni10Co/HBeta – spent | 20 | 70 | — | — | — | — | 5.4 | ||
| 10Ni10Co/HY | 10.3 | 9.6 | 132 | 568 | 259 | 505 | 765 | 19 | — |
| 10Ni10Co/HY – spent | 29 | 110 | — | — | — | — | 6.3 | ||
| 10Ni10Co/HZSM-5 | 9.6 | 9.5 | 65 | 281 | 162 | 509 | 672 | 15 | — |
| 10Ni10Co/HZSM-5 – spent | 54 | 229 | — | — | — | — | 4.8 | ||
| 21Ni/HZSM-5 | 21.4 | — | 65 | 281 | 243 | 345 | 588 | 30 | — |
| 21Ni/HZSM-5 – spent | 39 | 167 | — | — | — | — | 6.3 | ||
The Brønsted (BS) and Lewis acid site (LS) concentrations were determined by IR spectroscopy of adsorbed pyridine and calculated based on the molar extinction coefficient according to the literature33 and the intensities of the bands at 1544 cm−1 (BS) and 1448 cm−1 (LS) in the spectra recorded at 150 °C (see Table 1). Compared to the zeolite supports, ZrO2 contained a significantly lower amount of LS and no BS. The BS concentrations of the supported catalysts follow the order: HY > HZSM-5 > HBeta > ZrO2.
If normalized to SBET, the respective BS concentration of these samples showed another trend: HZSM-5 > HY > HBeta > ZrO2, confirming the high density of BS of the HZSM-5 support. With the same support (HZSM-5), the number of BS in the monometallic catalysts was higher than in the bimetallic catalysts, whereas the LS proportion showed the reverse trend, but that is yet not fully understood. It might be due to the difference in valence states of Ni and Co.30 However, as the density of LS in the HBeta supported catalyst is significantly higher than for the other samples, 10Ni10Co/HBeta has the highest total acidity among these series.
HDO of bio-oil
The bio-oil used was produced by ablative fast pyrolysis of wood (PYTEC GmbH) by using the hot rotating disk technique.34Table 2 shows some typical properties of such bio-oil. In addition, an existing FCC feed (bottom residue from crude oil atmospheric distillation) from a commercial refinery in Vietnam was used as a representative of a FCC conventional feed (denoted as BH-Residue from Bach Ho oilfield) and its properties are shown in Table 2 as well. The difference in the nature of the bio-oil and the conventional feed are evident in this table, e.g. oxygen content, water content and HHV. The properties of upgraded bio-oil (UBO) obtained by HDO using the 10Ni10Co/HZSM-5 catalyst are also given here; its production will be discussed below.| Properties | Bio-oil | BH-Residue | UBO (run 11) from Table 3 | |
|---|---|---|---|---|
| Wet basis | H2O (wt%) | 32.58 | — | — |
| pH | 3.2 | — | — | |
| Dry basis, wt% | C | 55.3 | 86.1 | 66.4 |
| H | 6.9 | 13.5 | 10.6 | |
| N | 0.25 | 0.32 | 0.3 | |
| O | 37.4 | — | 22.8 | |
| HHV (MJ kg−1) | 23.6 | 46.0 | 33.3 | |
 | ||
| Fig. 2 Performance of 21Ni/HZSM-5 and 10Ni10Co-catalysts in bio-oil HDO (DOD = degree of deoxygenation, UBO = upgraded bio-oil, AQ = aqueous phase). | ||
Regarding the product yields, the oil fractions (UBO) obtained with all catalysts reached more or less the same values (32–37 wt%), whereas the amount of (polar) organic products found in the aqueous phase was slightly higher in the case of 10Ni10Co/HY and 10Ni10Co/HBeta than with the other ones. This indicated that less non-polar products were generated and thus, the HDO was somehow less effective. Considerable amounts of gases were produced in all runs in the range of 13–22 wt% related to the feed. The main components in the gas phase were non-converted H2, CH4, CO2, CO and various hydrocarbons (C2 to C5+) (see Fig. 3).
 | ||
| Fig. 3 Gas composition in bio-oil HDO over the prepared catalysts. | ||
It is well known that the high acidity of the zeolites promotes cracking reactions. Interestingly, a smaller gas fraction was observed in the case of 10Ni10Co/HY with a relatively high number of BS (Fig. 2). It might be due to the loss of acidity of 10Ni10Co/HY during reaction due to its limited hydrothermal stability (see below). In contrast, the formation of a large amount of gas fraction was observed with 10Ni10Co/ZrO2 even though it does not offer BS. This might be explained by the impact of Lewis acid sites of ZrO2 or its mesoporous structure, which offers improved accessibility to acid sites for the feed molecules or intermediate products, leading to an increase of the gas fraction. In addition, ZrO2 is also reported to be active in deoxygenation of bio-oil in hot compressed water at temperatures above 350 °C.36
The bimetallic catalyst 10Ni10Co/HZSM-5 showed a higher activity in terms of the DOD value and UBO yield than the monometallic catalyst. This can be related to the higher dispersion with smaller metal particles (Table 1), also backed by the TEM results.29 A second reason could be attributed to the lower coke formation with the bimetallic catalyst as determined by elemental analysis (Table 1) and the hard coke formation as indicated by the TPO results as discussed below. This probably refers to the high proportion of Brønsted acid sites in 21Ni/HZSM-5 compared with that in 10Ni10Co/HZSM-5.
Notably, the DOD value obtained with the bimetallic catalysts with different supports follows the order HZSM-5 > HBeta > ZrO2 > HY. Otherwise, this ranking doesn't match with the acidity strength of the fresh solids as listed in Table 1. Another important solid property, i.e. the hydrothermal stability, is an important factor in discussing the catalytic results. Thus, HZSM-5 based solids reveal an optimum of these two desired properties and therefore, outperform the other materials. The low DOD value with the sample 10Ni10Co/ZrO2 can be attributed to its much lower surface area and acidity compared to the other catalysts (Table 1). The much lower DOD of 10Ni10Co/HY is attributed to its poor hydrothermal stability (see Fig. 8 below), as the crystalline character of HY almost disappeared after the reaction. The HDO performance is also shown in a van Krevelen plot (Fig. 4). The molar O![[thin space (1/6-em)]](https://www.rsc.org/images/entities/char_2009.gif) :C ratio of the UBO was considerably lower and the molar H:C ratio was higher compared to the original bio-oil (O:C–0.51, H:C–1.5). The presence of all catalysts improved the bio-oil quality toward the fossil feed. Similarly as discussed for DOD, there is no clear correlation of acidity and the results displayed in Fig. 4 as hydrothermal stability affects performance. The molar H:C ratio of UBOs upgraded with 10Ni10Co/HBeta and 10Ni10Co/HZSM-5 is higher although the molar O:C ratio is still higher than that of the fossil feed. This indicates an effective HDO reaction. Notably, a balanced combination of metal and acid sites is needed for the effective elimination of oxygen from bio-oil, which is shown in several studies on HDO of various phenolic model compounds (e.g. phenol, guaiacol).37,38 Two main pathways are proposed for oxygen elimination from phenolic compounds: either the direct deoxygenation via hydrogenolysis or the hydrogenation of the aromatic ring followed by dehydration. In the latter, acid sites are needed to promote the dehydration step. In addition, it is believed that the higher the acidity of catalysts, the greater the coke formation, which can be clearly seen in Table 1.
:C ratio of the UBO was considerably lower and the molar H:C ratio was higher compared to the original bio-oil (O:C–0.51, H:C–1.5). The presence of all catalysts improved the bio-oil quality toward the fossil feed. Similarly as discussed for DOD, there is no clear correlation of acidity and the results displayed in Fig. 4 as hydrothermal stability affects performance. The molar H:C ratio of UBOs upgraded with 10Ni10Co/HBeta and 10Ni10Co/HZSM-5 is higher although the molar O:C ratio is still higher than that of the fossil feed. This indicates an effective HDO reaction. Notably, a balanced combination of metal and acid sites is needed for the effective elimination of oxygen from bio-oil, which is shown in several studies on HDO of various phenolic model compounds (e.g. phenol, guaiacol).37,38 Two main pathways are proposed for oxygen elimination from phenolic compounds: either the direct deoxygenation via hydrogenolysis or the hydrogenation of the aromatic ring followed by dehydration. In the latter, acid sites are needed to promote the dehydration step. In addition, it is believed that the higher the acidity of catalysts, the greater the coke formation, which can be clearly seen in Table 1.
 | ||
| Fig. 4 van Krevelen plot for bio-oil, BH-Residue (from Bach Ho oilfield) and upgraded bio-oil (UBO) obtained by HDO with prepared catalysts. | ||
| Runs | T (°C) | P (bar) | t (h) | Products yields (wt%) | Elemental composition of bio-oil and oil phase (dry basis) | DOD (%) | HHV, MJ kg−1 | |||||||
|---|---|---|---|---|---|---|---|---|---|---|---|---|---|---|
| UBO | AQ | Gas | Solid | Loss | C | H | N | O | ||||||
| Reaction conditions: 5 g of bio-oil, 25 g of H2O, 0.5 g of catalyst.a 1 g of catalyst; UBO – upgraded bio-oil, AQ – aqueous phase, DOD – degree of deoxygenation, HHV – higher heating value. | ||||||||||||||
| 0 | Bio-oil | 55.3 | 6.9 | 0.3 | 37.4 | — | 23.6 | |||||||
| 1 | 250 | 40 | 4 | 36.0 | 39.8 | 8.2 | 1.67 | 14.4 | 58.6 | 10.1 | 0.4 | 30.9 | 17 | 29.2 |
| 2 | 280 | 40 | 4 | 34.4 | 40.3 | 9.2 | 1.76 | 14.4 | 60.4 | 9.5 | 0.3 | 29.7 | 21 | 29.3 |
| 3 | 300 | 40 | 4 | 35.5 | 40.5 | 9.8 | 1.93 | 12.2 | 61.5 | 8.9 | 0.4 | 29.3 | 22 | 28.9 |
| 4 | 320 | 40 | 4 | 33.9 | 36.1 | 13.8 | 2.02 | 14.1 | 61.6 | 8.9 | 0.3 | 29.2 | 22 | 28.9 |
| 5 | 300 | 50 | 2 | 35.9 | 38.5 | 8.3 | 2.10 | 15.2 | 57.3 | 9.4 | 0.3 | 33.0 | 12 | 27.7 |
| 6 | 300 | 50 | 4 | 36.9 | 39.3 | 9.6 | 1.79 | 12.4 | 61.7 | 9.6 | 0.3 | 28.4 | 24 | 29.9 |
| 7 | 300 | 50 | 6 | 35.0 | 39.6 | 10.2 | 1.92 | 13.3 | 62.3 | 8.7 | 0.4 | 28.7 | 23 | 29.0 |
| 8 | 300 | 40 | 4 | 35.5 | 40.5 | 9.8 | 1.81 | 12.3 | 61.5 | 8.9 | 0.4 | 29.3 | 22 | 28.9 |
| 9 | 300 | 50 | 4 | 36.9 | 39.3 | 10.2 | 1.79 | 11.8 | 61.7 | 9.6 | 0.3 | 28.4 | 24 | 29.9 |
| 10 | 300 | 60 | 4 | 37.0 | 38.4 | 10.2 | 1.62 | 12.8 | 63.8 | 9.9 | 0.3 | 26.0 | 30 | 31.2 |
| 11a | 300 | 60 | 4 | 36.7 | 35.3 | 14.6 | 2.03 | 11.3 | 66.4 | 10.6 | 0.3 | 22.8 | 39 | 33.3 |
Next, test runs with different H2 initial pressures (40, 50 and 60 bar at RT) were carried out (runs 8–10). Furthermore, a run with a higher catalyst to bio-oil ratio (0.2 g g−1) was conducted (run 11). The range of the catalyst to bio-oil ratio was selected based on the results of Duan and Savage, who stated that higher catalyst loadings lead to more light gas components and coke formation, hence more carbon is lost and subsequently the DOD value is decreased.17Table 3 presents the results of such runs and the elemental composition of the parent bio-oil (run 0). In addition, Fig. 5 depicts a van Krevelen plot for the product properties from those runs. The diagram shows that the molar O:C ratios of the UBO phases from all runs are always less compared to that of the parent bio-oil, whereas the molar H:C ratios are always higher. Fig. 6 visualizes the impact of the reaction conditions on the composition of the gas phase.
 | ||
| Fig. 5 van Krevelen plot for bio-oil, BH-Residue (from Bach Ho oilfield) and UBOs from runs under various reaction conditions over 10Ni10Co/HZSM-5 (cf.Table 3). | ||
 | ||
| Fig. 6 Gas distribution obtained with the 10Ni10Co/HZSM-5 catalyst under different conditions. | ||
:C ratio of UBO. Fig. 6 shows a significantly lower ratio already in run 1 carried out at 250 °C (0.39) compared to the original bio-oil (0.51), and dropped further at 300 °C (0.35).
The formation of a high amount of CO2 and in particular CH4 (Fig. 6) via hydrocracking could be responsible for the lower UBO yield. Moreover, the molar H:C ratio at 250 °C (2.1) was significantly higher than that of bio-oil. This can be attributed to initial hydrogenation of oxygenated compounds (aldehydes, ketones) which is favorable at lower temperature.25,39 However, the molar H:C ratio was reduced with the increase of temperature. This might be due to dehydrogenation on the metal sites and dehydration on the available BS of the support at higher temperature, forming olefins and aromatics, the latter of which might also act as coke precursors. Our results from the HDO of phenol and cyclohexanol with the same catalyst confirmed that the increase in selectivity toward benzene and cyclohexene runs at the expense of cyclohexane with increase of temperature (not shown here). In line with this, Venderbosch et al. performed the HDO of pyrolysis oil over Ru/C and showed that hydrogenation took place rapidly in the range of 175–250 °C and resulted in an increase of the molar H:C ratio compared to the feed. However, the H:C ratio was reduced with further increase of temperature.20 Mercader et al.25 also observed a decrease in the molar H:C ratio in UBO with increasing temperature up to 340 °C. As the objective of this study is to decrease the oxygen content and to retain the UBO yield, the temperature of 300 °C was therefore selected for further investigation.
Simultaneously, the DOD value increased significantly from 2 to 4 h, but only little from 4 to 6 h. This may point to a higher reaction rate of HDO compared to conventional hydrocracking (which is usually run at higher pressure and temperature). Furthermore, the amount of solids decreases slightly from 2 to 4 h but increases slightly at the longest reaction time. A run time of 6 h leads to a slight rise of the molar O:C ratio in the oil phase, most likely due to a shift towards oxygen-free hydrocarbons in the gas phase; at the same time, the molar H:C ratio is lowered. Therefore, the 4 h reaction time is considered as the optimum in terms of UBO yield.
:C ratio would drop. In addition, methanation of CO/CO2 might be promoted because Ni based solids are known to support the methanation of carbon oxides under the given conditions.40
:C ratio and even more the lower molar O:C ratio (Fig. 6) at a higher catalyst to bio-oil ratio probably point to a higher overall contact time between oxygenates and catalyst, thereby increasing the severity and allowing deeper hydrogenation of the feed and leading to an improved performance.17
Thus, the highest oil yield on wet basis (37 wt%) and DOD (39%) with the bimetallic catalyst 10Ni10Co/HZSM-5 were achieved with such a high catalyst amount. Table 2 shows typical properties of the resulting UBO fraction (run 11). Obviously, the hydrogen content in UBO increased significantly and the oxygen content decreased, as desired, leading to higher molar H:C and lower molar O:C ratios and finally a greater HHV (33.3 MJ kg−1) compared to the original bio-oil (23.6 MJ kg−1). This product (produced in separate experiments to get enough UBO) was used for co-processing tests that will be described below.
 | ||
| Fig. 7 13C-NMR spectra of (a) the original bio-oil and (b) the UBO obtained with 10Ni10Co/HZSM-5. | ||
The NMR results evidenced significant changes in the chemical nature of the bio-oil during HDO. The fractions of carboxylic acids, ketones, aldehydes and alcohols are reduced significantly, whereas the fractions of aliphatic and aromatic carbon atoms increased strongly. These results are also in line with the GC-MS analysis of both samples (not shown here).
Characterization of the spent catalysts
The XRD patterns of the spent catalysts were recorded and compared with the pre-reduced catalysts as depicted in Fig. 8. Obviously, the sharp reflections of fresh zeolite Y in the range of 6–32° almost disappeared after the reaction, indicating the transformation of well-crystallized zeolite Y into an amorphous phase. In contrast, the HZSM-5 and ZrO2 supported catalysts showed no appreciable change in the patterns. The HBeta supported catalyst presents a moderate decrease in the intensity of the reflections of zeolite Beta (2theta = 4.5°, 23°). | ||
| Fig. 8 XRD patterns of the pre-reduced and spent catalysts. | ||
The SBET of the spent 10Ni10Co/HY and 10Ni10Co/HBeta samples significantly dropped compared to those of the fresh catalysts, whereas that of 10Ni10Co/ZrO2 slightly increased (as shown in Table 1). Among the HZSM-5 supported catalysts, the SBET of spent 21Ni/HZSM-5 was significantly less than that of spent 10Ni10Co/HZSM-5. The decline in the SBET of the named samples was most likely due to their poor hydrothermal stability (cf. XRD results) and the coke formation (see Table 1).
In addition, three spent catalyst samples (10Ni10Co/HZSM-5, 21Ni/HZSM-5 and 10Ni10Co/ZrO2) were studied by TPO in order to gain more insight into the nature of coke species formed during the course of reaction. Fig. 9 displays the profiles for CO2 and H2O desorption. These profiles show a sharp peak at medium temperature (280–340 °C), whereas another broad peak is visible at higher temperature (400–500 °C) only for the HZSM-5 supported catalysts which is due to hard coke. The latter peak is much clearer for the monometallic catalyst than for the bimetallic catalyst. This indicates that two types of carbonaceous material (degradable at medium and high temperatures) are formed over the HZSM-5 supported catalysts in contrast to the ZrO2-based catalyst.
 | ||
| Fig. 9 TPO results of selected spent catalysts. | ||
In addition, the CO2 desorption curves of the HZSM-5 supported catalysts look quite similar (peak areas of 293 × 106 and 268 × 106 for 10Ni10Co/HZSM-5 and 21Ni/HZSM-5, respectively) and the amounts of generated CO2 are much higher than that of 10Ni10Co/ZrO2 (peak area of 190 × 106). At the same time, the peak areas of the H2O desorption curves for the HZSM-5 supported catalysts (286–314 × 106) were much higher than for 10Ni10Co/ZrO2 (139 × 106), suggesting that hydrogen rich species were formed with the zeolite supported catalysts. In the case of the 10Ni10Co/ZrO2 catalyst, the CO2 desorption is much more pronounced than the corresponding H2O desorption, indicating that this sample was covered with less hydrogenated species.
Notably, the maximum temperatures of the two peaks in 21Ni/HZSM-5 were higher than for 10Ni10Co/HZSM-5, which in turn illustrate the beneficial effect of the addition of Co to Ni/HZSM-5 in terms of a strong decrease of hard coke formation.
Co-feeding of UBO with a conventional feed under FCC conditions
As stated above, FCC is one of the most important conversion processes used in petroleum refineries and might offer sufficient capacity to co-process large streams of UBO. To stay as close as possible to the regular FCC conditions, a typical equilibrated FCC catalyst and a conventional feed (BH-Residue) from a commercial refinery in Vietnam was used (Table 4).| Properties | |
|---|---|
| BET surface area, m2 g−1 | 125 |
| Zeolite surface area, m2 g−1 | 63 |
| Matrix surface area, m2 g−1 | 62 |
| Pore size, nm | 8.8 |
| Unit cell, nm | 2.43 |
| Chemical composition, wt% | |
| Al2O3 | 55.30 |
| Re2O3 | 1.14 |
| CaO | 0.17 |
In this study, we performed the cracking of the conventional feed and of a mixture of the conventional feed with the UBO. Various fractions (0, 5, 10 and 20 wt%) of UBO (produced with 10Ni10Co/HZSM-5) in the feed were used and the obtained samples were denoted according to the weight percentage of UBO in the feeds (0UBO, 5UBO, 10UBO, 20UBO). A comparison of the product distribution from the MAT runs with 100% conventional feed (0UBO) and with the co-feed mixtures (5UBO, 10UBO, and 20UBO) is given below in detail. Several independent MAT runs with the equilibrated catalyst and various fractions of UBO in the feed and different CTO ratios were performed under FCC conditions (520 °C, 1 bar, CTO = 2.5 or 3 g g−1). Fig. 10 shows the main results observed with respect to the conversion and product yields as a function of the various fractions of the UBO in the feed and the CTO ratios.
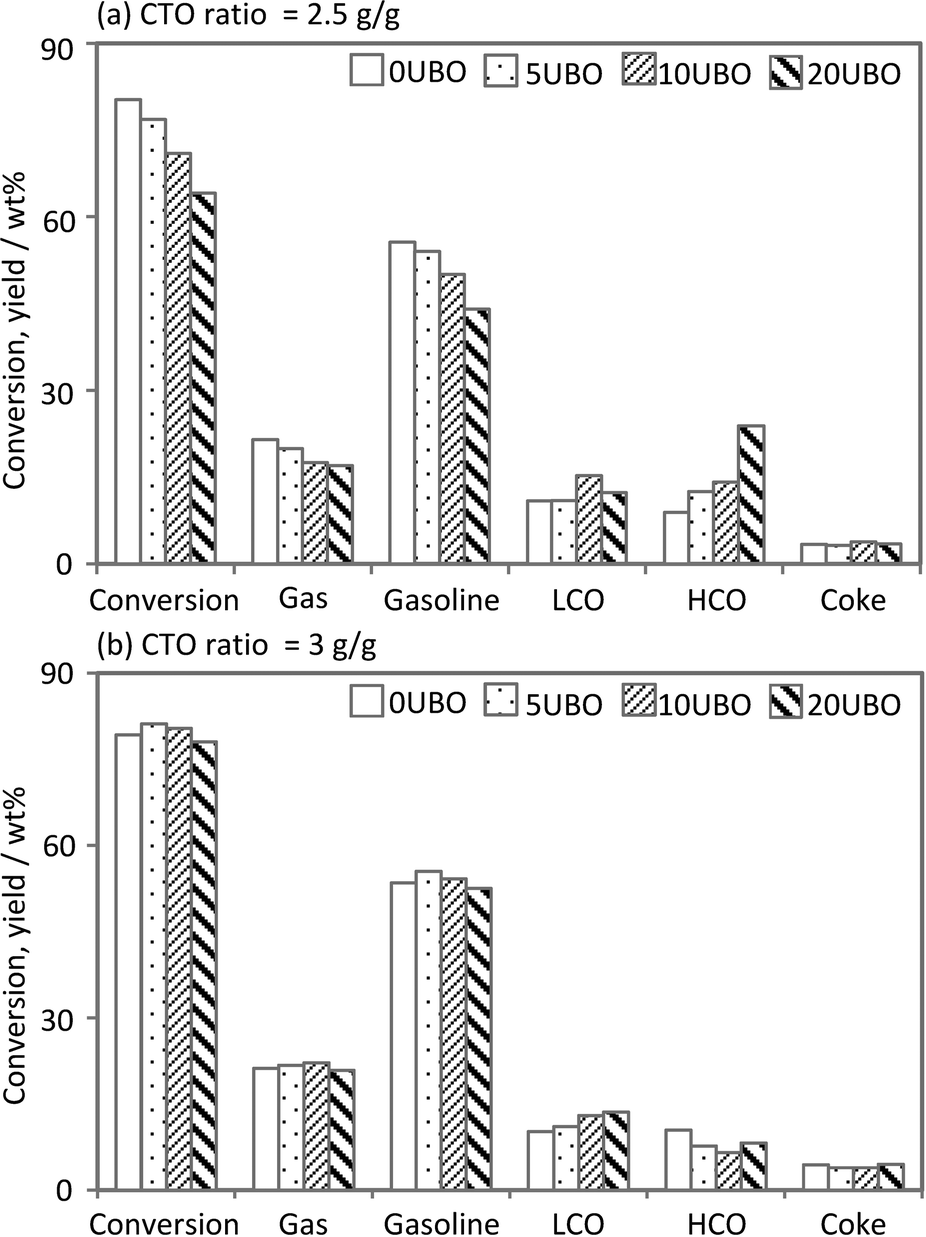 | ||
| Fig. 10 Performance of co-processing tests at different feed compositions and CTO ratios in a MAT unit. | ||
Obviously, at a CTO ratio of 2.5 (g g−1), which correlates to somewhat milder reaction conditions in terms of residence time and respective catalyst load, the conversion decreased gradually from 80% to 65% with the increase of the UBO proportion. In contrast, the conversion of all feed samples was quite similar, except for 20UBO with a slight decrease, at the CTO ratio of 3 (g g−1). This demonstrates that the oxygenated compounds in the UBO are more recalcitrant to cracking due to the high number of functional groups with higher O-content and lower H-content (e.g. phenols, guaiacols, syringols and dimers). This observation is in line with the results of Mercader et al.,25 who stated that a slightly higher CTO ratio is required for co-processing of 20 wt% of UBO with a conventional feed in order to obtain an equivalent conversion.
Regarding the product distribution at the CTO ratio of 2.5 (g g−1), the gas and gasoline yields decreased slightly when raising the amount of co-fed UBO, whereas the LCO and HCO fractions increased gradually. The slight increase of the LCO content could be related to either the existence of components in the LCO range of the UBO or to cracked products of the co-feed in the LCO range. It should be noted that the LCO fraction from the FCC unit is normally used for diesel fuel blending.
The gas and gasoline yields with increasing UBO fraction at the CTO ratio of 3 (g g−1) were similar for both the BH-residue and the co-feeds, whereas a considerable change in the yield of the LCO and HCO fractions was observed. The LCO yield increased gradually and the HCO yield showed the reverse trend (especially with 20UBO), indicating the subsequent cracking of heavy components in the HCO fraction to form lighter components in the LCO range (particularly for the 5UBO and 10UBO samples) or the gas range. These results were in line with the observation of increasing yields of gas components (dry gas (H2, C1, C2), LPG (C3, C4) and CO/CO2) with increasing UBO fraction in the feed (Fig. 11). However, at the CTO ratio of 2.5 (g g−1), the contents of LPG and olefins (C2![[double bond, length as m-dash]](https://www.rsc.org/images/entities/char_e001.gif) , C3) decreased gradually with the increase of the UBO fraction in the feed, whereas the dry gas fraction slightly increased (Fig. 11). It should be noted that CO and CO2 were solely formed with the co-fed UBOs due to the cracking of oxygenated compounds and their amounts increased with the increase in its fraction (Fig. 11).
, C3) decreased gradually with the increase of the UBO fraction in the feed, whereas the dry gas fraction slightly increased (Fig. 11). It should be noted that CO and CO2 were solely formed with the co-fed UBOs due to the cracking of oxygenated compounds and their amounts increased with the increase in its fraction (Fig. 11).
 | ||
| Fig. 11 Gas yield in the co-processing tests at 520 °C and different CTOs. | ||
Catalytic cracking of oxygenates runs via complex reaction pathways involving different classes of reactions, namely, cracking of large molecules to smaller molecules, dehydration, hydrogen-producing reactions (e.g. steam reforming, dehydrogenation), hydrogen-consuming reactions (hydrogenation, hydrogenolysis, dehydration), Aldol condensation or Diels Alder reaction.21,26 As a consequence, the catalytic cracking of such biomass derived feedstock in the presence of a fossil feed showed a synergetic effect due to coupling of such reactions.41 This can be seen from the results above, as BH-Residue can act as a hydrogen donor, which provides the hydrogen to reduce the oxygenated compounds in UBO, resulting in high hydrogen consumption in the co-feed test. The effect is also known from cracking of model compound m-cresol together with hexanes over HY zeolite as recently reported by To and Resasco,42 who interpreted that small amounts of m-cresol at low reactant concentrations caused fast deactivation of the catalyst. Nevertheless, increasing the paraffin concentration interestingly hindered the deactivating effect of m-cresol. The authors proposed the observation due to the hydride transfer between the phenolic compound and the paraffins.
Coke deposition appears as a major problem in hydrocarbon catalysis, particularly in the case of cracking of oxygenated model compounds and untreated bio-oils.25,43,44 In this study, a slight increase in coke yield was observed with the increase of the CTO ratios and cracking severity. However, there was no significant difference in the observed coke yield between co-feeds and the conventional feed, independent of the CTO ratios. It is difficult to explain the observed trends compared with the literature data because different FCC catalysts, feeds and setups with different contact times were used.28 Coke deposition is well-known to be a function of several factors such as catalyst activity, space velocity, temperature and molar H:C ratio of the feed.45,46 Anyway, these results indicate that the FCC process seems to be rather insensitive to the UBO admixture with regard to coking.
The gasoline fraction is the primary objective of a FCC unit. Therefore, the composition of the gasoline fraction obtained with the four samples tested at a CTO ratio of 3 (g g−1) was analyzed to see the impact of co-feed of UBO in this product range. Clearly, co-processed feeds give larger amounts of aromatic compounds in the gasoline compared to a conventional feed (Fig. 12). This finding is not surprising as the UBO initially contains aromatic compounds (see Fig. 8b) and they are additionally more refractory to cracking than a paraffinic feedstock because of the lower H-content. Additionally, the proportions of iso-paraffin and olefin fractions decreased compared to a conventional feed while the n-paraffin and naphthene fractions were more or less the same. The increase of aromatics in gasoline from co-processed feeds can be countered by optimizing the blend ratio of gasoline fractions from the different units in a standard refinery (e.g. FCC, reforming, isomerization) to adapt the limit values of aromatics in gasoline.
 | ||
| Fig. 12 Gasoline composition in the products from co-processing tests at 520 °C and CTO = 3 (g g−1). | ||
Conclusions
In this work, we reported on the effect of various reaction conditions and different acidic supports on the performance of highly active redox metals Ni and Co in HDO of bio-oil. The results reveal that the bimetallic catalyst 10Ni10Co/HZSM-5 shows the best performance in HDO of bio-oil compared to monometallic 21Ni/HZSM-5 and 10Ni10Co supported on other carriers. This can be mainly attributed to alloying, the metal particle dispersion, acidity properties of supports and hydrothermal stability. 10Ni10Co/HZSM-5 obviously provides a well-balanced mixture of metal sites for activation of hydrogen and acid sites for cracking and dehydration steps. As a next step, expanded long-term HDO tests in a continuous flow reactor are crucial for further progress; such tests are underway to check catalyst long-term stability on-stream.The co-processing of such upgraded oil (UBO) with conventional feedstock using a commercial catalyst in a lab-scale FCC unit was successful. This provides valuable data on the effect of the most important process parameters related to co-processing. A systematic study on an increasing fraction of UBO in a FCC feed from low to high amount of UBO clearly indicates the impact of the difference in the proportion of UBO. At a low CTO ratio (2.5 g g−1), the conversion and yield of some desired products (LPG, gasoline) were reduced slightly, whereas LCO and HCO fractions show a reverse trend. However, at the higher CTO ratio (3 g g−1), the HCO yield is reduced gradually, leading to a slight increase in the desired LCO, gasoline and gas fractions at a similar conversion. It is suggested that a higher CTO ratio should be used for the conversion of UBO in the standard FCC unit in a conventional refinery.
These findings demonstrated that an intermediate mild HDO treatment step with cheap catalysts is possible and makes the upgraded product a well-suited co-feed for processing in a conventional refinery. This provides a potential route for conversion of biomass to renewable liquid fuels with sufficient yields.
Acknowledgements
The authors gratefully acknowledge financial support by Petrovietnam and LIKAT. We want to thank Dr. M. Schneider, Ms. A. Simmula (all at LIKAT) for their excellent analytical support. We also thank Mr. T. Tran and Mr. S. Nguyen (VPI-PVPro) for their help in operating the MAT setup.References
- IEA Technology Roadmap – Biofuels for Transport, Paris, 2011http://www.iea.org/publications/freepublications/publication/biofuels_roadmap_web.pdf, accessed date 11/26/2015.
- Shell: New Lens Scenarios, Amsterdam, 2013, http://www.shell.com.br/content/dam/royaldutchshell/documents/corporate/scenarios-newdoc.pdf, accessed date 11/26/2015.
- J. A. Melero, J. Iglesias and A. Garcia, Energy Environ. Sci., 2012, 5, 7393–7420 CAS.
- D. Meier, B. van de Beld, A. V. Bridgwater, D. C. Elliott, A. Oasmaa and F. Preto, Renewable Sustainable Energy Rev., 2013, 20, 619–641 CrossRef.
- A. V. Bridgwater, Biomass Bioenergy, 2012, 38, 68–94 CrossRef CAS.
- B. M. Q. Phan, L. T. Duong, V. D. Nguyen, T. B. Tran, M. H. H. Nguyen, L. H. Nguyen, D. A. Nguyen and L. C. Luu, Biomass Bioenergy, 2014, 62, 74–81 CrossRef CAS.
- D. Mohan, C. U. Pittman and P. H. Steele, Energy Fuels, 2006, 20, 848–889 CrossRef.
- A. V. Bridgwater, Environ. Prog. Sustainable Energy, 2012, 31, 261–268 CrossRef CAS.
- D. C. Elliott, Energy Fuels, 2007, 21, 1792–1815 CrossRef.
- T. V. Choudhary and C. B. Phillips, Appl. Catal., A, 2011, 397, 1–12 CrossRef.
- P. M. Mortensen, J. D. Grunwaldt, P. A. Jensen, K. G. Knudsen and A. D. Jensen, Appl. Catal., A, 2011, 407, 1–19 CrossRef CAS.
- D. C. Elliott and T. R. Hart, Energy Fuels, 2009, 23, 631–637 CrossRef.
- D. C. Elliott, T. R. Hart, G. G. Neuenschwander, L. J. Rotness and A. H. Zacher, Environ. Prog. Sustainable Energy, 2009, 28, 441–449 CrossRef CAS.
- J. Wildschut, F. H. Mahfud, R. H. Venderbosch and H. J. Heeres, Ind. Eng. Chem. Res., 2009, 48, 10324–10334 CrossRef CAS.
- J. Wildschut, M. Iqbal, F. H. Mahfud, I. M. Cabrera, R. H. Venderbosch and H. J. Heeres, Energy Environ. Sci., 2010, 3, 962–970 CAS.
- P. Duan and P. E. Savage, Bioresour. Technol., 2011, 102, 1899–1906 CrossRef CAS PubMed.
- P. Duan and P. E. Savage, Appl. Catal., B, 2011, 104, 136–143 CrossRef CAS.
- P. Duan and P. E. Savage, Energy Environ. Sci., 2011, 4, 1447–1456 CAS.
- R. J. French, J. Hrdlicka and R. Baldwin, Environ. Prog. Sustainable Energy, 2010, 29, 142–150 CrossRef CAS.
- R. H. Venderbosch, A. R. Ardiyanti, J. Wildschut, A. Oasmaa and H. J. Heeres, J. Chem. Technol. Biotechnol., 2010, 85, 674–686 CrossRef CAS.
- A. Corma, G. W. Huber, L. Sauvanaud and P. O'Connor, J. Catal., 2007, 247, 307–327 CrossRef.
- M. E. Domine, A. C. van Veen, Y. Schuurman and C. Mirodatos, ChemSusChem, 2008, 1, 179–181 CrossRef CAS PubMed.
- I. Graça, F. R. Ribeiro, H. S. Cerqueira, Y. L. Lam and M. B. B. de Almeida, Appl. Catal., B, 2009, 90, 556–563 CrossRef.
- I. Graça, J. M. Lopes, M. F. Ribeiro, F. Ramôa Ribeiro, H. S. Cerqueira and M. B. B. de Almeida, Appl. Catal., B, 2011, 101, 613–621 CrossRef.
- F. de Miguel Mercader, M. J. Groeneveld, S. R. A. Kersten, N. W. J. Way, C. J. Schaverien and J. A. Hogendoorn, Appl. Catal., B, 2010, 96, 57–66 CrossRef CAS.
- G. Fogassy, N. Thegarid, G. Toussaint, A. C. van Veen, Y. Schuurman and C. Mirodatos, Appl. Catal., B, 2010, 96, 476–485 CrossRef CAS.
- M. C. Samolada, W. Baldauf and I. A. Vasalos, Fuel, 1998, 77, 1667–1675 CrossRef CAS.
- M. Al-Sabawi, J. Chen and S. Ng, Energy Fuels, 2012, 26, 5355–5372 CrossRef CAS.
- T. M. Huynh, U. Armbruster, M.-M. Pohl, M. Schneider, J. Radnik, D.-L. Hoang, B. M. Q. Phan, D. A. Nguyen and A. Martin, ChemCatChem, 2014, 6, 1940–1951 CrossRef CAS.
- T. M. Huynh, U. Armbruster, B. M. Q. Phan, D. A. Nguyen and A. Martin, Chim. Oggi, 2014, 32(2), 40–44 CAS.
- S. A. Channiwala and P. P. Parikh, Fuel, 2002, 81, 1051–1063 CrossRef CAS.
- D. Wallenstein, M. Seese and X. Zhao, Appl. Catal., A, 2002, 231, 227–242 CrossRef CAS.
- C. A. Emeis, J. Catal., 1993, 141, 347–354 CrossRef CAS.
- http://www.pytecsite.de/pytec_eng/flash_pyrolyse_2.htm, accessed date 08/14/ 2015.
- J. Wildschut, J. Arentz, C. B. Rasrendra, R. H. Venderbosch and H. J. Heeres, Environ. Prog. Sustainable Energy, 2009, 28, 450–460 CrossRef CAS.
- A. R. Ardiyanti, A. Gutierrez, M. L. Honkela, A. O. I. Krause and H. J. Heeres, Appl. Catal., A, 2011, 407, 56–66 CrossRef CAS.
- C. Zhao and J. A. Lercher, ChemCatChem, 2012, 4, 64–68 CrossRef CAS.
- C. R. Lee, J. S. Yoon, Y.-W. Suh, J.-W. Choi, J.-M. Ha, D. J. Suh and Y.-K. Park, Catal. Commun., 2012, 17, 54–58 CrossRef CAS.
- A. Gutierrez, R. K. Kaila, M. L. Honkela, R. Slioor and A. O. I. Krause, Catal. Today, 2009, 147, 239–246 CrossRef CAS.
- S. Krompiec, J. Mrowiec-Białoń, K. Skutil, A. Dukowicz, L. Pająk and A. B. Jarzębski, J. Non-Cryst. Solids, 2003, 315, 297–303 CrossRef CAS.
- G. W. Huber and A. Corma, Angew. Chem., Int. Ed., 2007, 46, 7184–7201 CrossRef CAS PubMed.
- A. T. To and D. E. Resasco, J. Catal., 2015, 329, 57–68 CrossRef.
- S. Vitolo, M. Seggiani, P. Frediani, G. Ambrosini and L. Politi, Fuel, 1999, 78, 1147–1159 CrossRef CAS.
- S. Vitolo, B. Bresci, M. Seggiani and M. G. Gallo, Fuel, 2001, 80, 17–26 CrossRef CAS.
- M. Ibáñez, B. Valle, J. Bilbao, A. G. Gayubo and P. Castaño, Catal. Today, 2012, 195, 106–113 CrossRef.
- S. Li, S. Zhang, Z. Feng and Y. Yan, Environ. Prog. Sustainable Energy, 2015, 34, 240–247.3 CrossRef.
| This journal is © The Royal Society of Chemistry 2016 |