Bubble generation in liquid rope coiling
Hossein Hosseini†
 a,
Ali Farnudia,
Mohammad Hassan Khatami‡
a and
Mehdi Habibi*abc
aDepartment of Physics, Institute for Advanced Studies in Basic Sciences, Zanjan 4513766731, Iran. E-mail: M.habibi@uva.nl
bVan der Waals-Zeeman Institute, University of Amsterdam, 1098 XH Amsterdam, The Netherlands
cCondensed Matter National Laboratory, IPM, Tehran, Iran
First published on 1st November 2016
Abstract
We present an experimental study of liquid rope coiling in order to explore different possibilities of air bubble generation in a viscous fluid. A column of viscous fluid falling on a smooth solid surface exhibits different behaviours, e.g., axisymmetric stagnation flow, coiling, rotatory folding, supercoiling, etc. These states provide ample opportunity for air to get trapped inside the body of a fluid. We investigate bubble generation mechanisms by studying the instability of a falling fluid rope and the characteristics of the observed bubbles. Our experiments show that a viscous rope undergoing supercoiling on the impact surface can, at times, produce a four-branched spiral pattern of bubbles. Finally, we provide a phase diagram illustrating the bubble properties relevant to the flow rate and fall height of the viscous jet. Our study provides a very simple method for the generation of mono/bi-dispersed bubbles in viscous fluids at high rates with an ability to tune the bubble size.
1 Introduction
Quite often air gets trapped in liquids during processes such as pouring one liquid onto another. This can be seen in almost any phenomenon in nature that involves liquids. For instance, it contributes to river oxygenation or in various processes in glass, food, and health care industries. A number of industrial processes involve pouring jets of viscous liquids, typically molten glass, metal, or polymers, inside a mould or a container. During most of these processes, bubbles get trapped in the mould and are usually considered to be a defect.1 On the other hand, in recent years there has been a growing interest in developing methods that produce monodisperse distributions of bubbles in viscous fluids for use in microchemistry and pharmaceutics, and applications such as monosize microfoams and stable emulsions.2,3In previous studies air entrainment methods due to the impact of a continuous liquid jet1,4–7 or liquid drop8,9 on a liquid–air interface have been investigated. Lorenceau et al. have shown that the axisymmetric stagnation state resulting from a jet of viscous fluid plunging into a bath of the same fluid can entrain air in the fluid. The formation of trumpet-like air pockets can decay into air bubbles if the velocity of the jet is above a certain threshold value.1 In the case of a filament or a ribbon of viscous fluid falling on a surface, periodic coils and folds are formed as a result of the impact. Depending on the parameters of the system, e.g., the frequency of oscillation or viscosity of the liquid, air bubbles can become trapped between two successive coils or folds that often lead to the formation of attractive patterns.5,6
In spite of the striking research carried out with the intention of understanding the dynamics of buckling and coiling of viscous jets,10–15 only a couple of studies are dedicated to bubble generation by coiling and buckling.5,6 The first study focuses on the formation of spiral patterns of monodispersed bubbles generated by liquid rope coiling. Within limited ranges of parameters in the gravitational coiling regime, the coiling centre executes a precession and consequently each new coil is slightly displaced from the previous one creating an opportunity for small air bubbles to find their way between them. Bubbles were advected radially outwards by the fluid spreading over the plate. The combination of the slow azimuthal drift of the trapped bubbles due to the precession of the centre of the coil and radial advection leads to the generation of a surprising five-branched spiral wave of bubbles.5 In the second study, air was ingested during the buckling of planar jets (viscous ribbons) onto a free surface of the same liquid. Bubbles were trapped between two successive folding ribbons and advected downward by the fluid leading to different bubble patterns.6
In this paper, we investigate different mechanisms of bubble ingestion by observing different states of a viscous liquid column falling onto a solid plate. The five states include stagnation flow, folding, steady coiling, periodic buckling, and supercoiling previously studied by some of us.15–17 With the exception of the stagnation flow that shows no instability along its length, we observed bubbles getting trapped inside the liquid in all the above mentioned states. We show that simple high-frequency coiling (that forms a stable hollow column structure) can entrap air when the Rayleigh instability of the falling jet18 coexists with the coiling instability. Within our experimental boundaries, the size of the entrapped bubbles remains approximately unaffected by changes in the falling height of the fluid during simple coiling. We also find that the air ingestion mechanism in the folding state is similar to that of the viscous folding ribbon.6 In contrast to the somewhat unvarying bubble size distributions observed during the mentioned flow states, a range of bubble sizes results during the periodic collapse of a falling fluid (i.e., an irregular collapse of the hollow column of coils in simple coiling). During supercoiling, the formation of bidispersed bubbles is seen not to be affected by the fall height or flow rate. We introduce a simple model for bubble formation in the supercoiling state that gives rise to multi-branched spiral patterns. Finally, we present a phase diagram that displays our results as fall height versus flow rate.
2 Experimental procedure
The apparatus of the experimental setup is shown schematically in Fig. 1. A hole of diameter d = 4 mm at the bottom of a constant-head reservoir allows a thin stream of viscous fluid to fall at a constant flow rate onto a glass plate H = 1 to 100 cm below. The buckled filament forms a pile of fluid that spreads radially on the horizontal glass plate. Two cameras were used to monitor the side and bottom-view of the fluid pile formed on the transparent plate. We used polydimethylsiloxane oil (silicone oil) with density ρ = 0.97 cm−3 g, surface tension coefficient γ = 21.5 dyne cm−1, and different viscosities ranging from ν = 2200 cS to ν = 3450 cS as our functioning fluid. The flow rate (Q) was calculated by measuring the oil accumulated in the container for a given period of time. During each study, the falling height (H) was changed in discrete steps through an adjustable platform while d, ν, and Q were held constant. We used the frame rate and pixel size from our captured videos to calculate the needed parameters such as frequency and bubble size (D).3 The different mechanisms of bubble generation in liquid rope coiling
Depending on the experimental parameters, a column of viscous fluid impacting a solid surface may exhibit different states including axisymmetric stagnation flow, rotatory folding,16 liquid rope coiling,13 secondary buckling,19 and supercoiling.17 With the state of the axisymmetric stagnation flow as an exception, air is trapped inside the viscous fluid in the remaining states and leads to different mechanisms of bubble intake.3.1 Bubble generation during folding
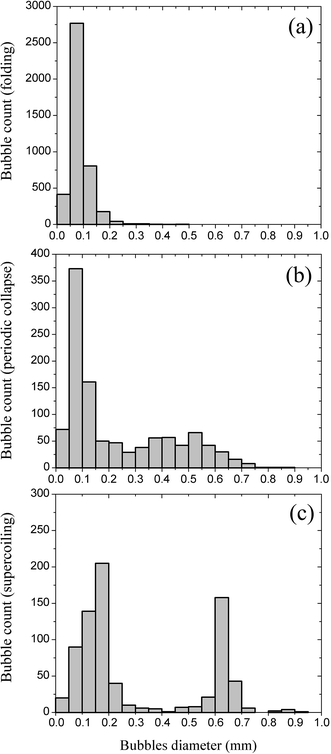
Under certain conditions,16 the buckling instability of a falling viscous rope forms periodic folds of the viscous rope that may occur with or without the rotation of the folding plane. Folding is the result of an oscillatory motion of the buckled rope that is confined to lie on a vertical plane (Fig. 2a). The folding dynamics gives rise to bubble generation. With every successive fold, the viscous filament traps one or several tiny air bubbles. The trapped bubbles are arranged in a regular fashion in several branches along the folding plane as shown in Fig. 2b. This process is reminiscent of trapped bubbles in planar jets.6 When bubbles reach the horizontal plate, they advect outwards and spread irregularly on the surface. Fig. 5a shows the size distribution of the bubbles generated by rotatory folding in a typical experiment in a circular area with a diameter of 25 mm. The number of the generated bubbles in the fluid is staggeringly high mainly due to the high folding frequency. The size distribution shows a large peak in the range of 0.05–0.1 mm.3.2 Bubble generation during coiling
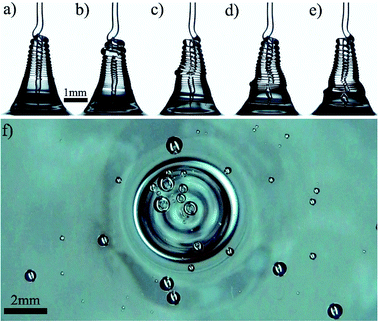
Coiling is the most dominant state in the parameter space of the falling viscous fluid problem. According to ref. 13 and 20, depending on how the main forces are balanced in the coil, the process may lead to four different regimes: viscous, gravitational, inertio-gravitational, and inertial. During a small part of the gravitational regime, successive commutative coils do not lay exactly on top of one another giving rise to small trapped air bubbles, and consequently five-branched spiral patterns when the bubbles advect radially away from the pile (this phenomenon was extensively investigated in ref. 5). In the high-frequency (inertial) regime, in contrast with the previous case, each newly formed coil falls exactly on top of the previous coil and results in the formation of hollow corkscrew shaped columns. Depending on the viscosity and flow rate, the hollow column exhibits different states: steady coiling, secondary buckling, or supercoiling. At lower viscosities, the rate of coil generation is proportional to the rate of gravitational spreading of the pile and as a result a steady hollow column appears with a fixed height (Fig. 3a). Since coiling is steady and the shape of the column is stable, no bubbles are generated during this process. However, the emergence of any perturbation (e.g., Rayleigh instability of the falling jet18) can deform the hollow column and trap air inside the column as shown in Fig. 3b–e. Fig. 3f shows the bottom view of the bubble generation process. Here, the local thickening of the jet diameter due to perturbation further perturbs the coiling dynamics and deforms the hollow column. Then, air is trapped inside the column and advects outwards by the fluid pile. The maximum size of the bubbles generated can be roughly determined by the size of the hollow cavity inside the column, which depends on the dimensions of the pile and is consequently a function of Q, d, and ν. Our experimental studies show that the maximum size of the bubbles is almost independent of the fall height, H. In a typical experiment with the experimental parameters d = 4 mm, ν = 2, 200 cS, Q = 0.20 cm3 s−1, the diameter of the largest bubble was 0.6 ± 0.1 mm for fall heights ranging between 33 cm and 42 cm.By increasing the viscosity in the coiling state, gravity does not have enough time to spread the corkscrew pile. So the height of the column grows and after exceeding a critical value, it collapses under its own weight (Fig. 4a and b) and this cycle is repeated. This phenomenon is known as ‘secondary buckling’ or ‘periodic collapse’.19 This instability is the dominant state of a high-viscous falling jet at low flow rates and large falling heights. The periodic collapse of the fluid column traps air inside the column in an irregular dynamic. Therefore, the bubbles generated by secondary buckling exhibit no regular size distribution or pattern after spreading on the glass plate. Such an irregular pattern of bubbles is shown in Fig. 4c. Fig. 5b shows the distribution of the diameter of the bubbles generated in this state on the plate for a circular area of diameter 25 mm. As can be seen there is a wide distribution with a peak at 0.1 mm. The number of bubbles with diameters between 0.2 and 0.6 mm is roughly the same.
3.3 Spiral patterns generated during supercoiling
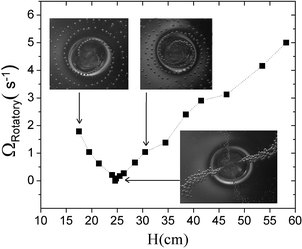
In a small portion of the parameter space, inertial coiling appears in a complex state called supercoiling.17 During supercoiling, the hollow column starts to coil with a specific frequency.17 The column coils into an ellipsoid instead of the original circle. The bubbles generated as a result of this regular dynamics, form neat and regular patterns. The air bubble trapped by the buckling of the hollow column is stretched and breaks into a large bubble and a small satellite one. In every coil of the hollow column, four bubbles are generated, which are bi-dispersed. Fig. 6a–d show how the trapped air is stretched and the generated bidispersed bubbles inside the buckled part of the hollow column. The flow of the fluid carries these bubbles radially away from the centre on the horizontal surface forming a beautiful four branched spiral. Two branches of the spiral are made up of large bubbles and the others form the smaller bubbles (Fig. 6f refers to a photo where both large and small branches are visible). The large and small bubbles do not flow at the same depth inside the fluid. In Fig. 6e and g different spiral bubbles have been shown. In these photos, we focused the lens on large bubbles, so the small bubble branches have not been shown. Experimental observations indicate that the rotation of the buckling column causes the bubbles to arrange in spiral patterns. On the other hand, Fig. 6h shows an eight-branched pattern of bubbles. This pattern, seen with difficulty, appears before the beginning of the spiral pattern, and also in coexistence with the spiral pattern at low fall heights.Fig. 7 shows the rotational frequency of the diagonal of the ellipsoid coiling column vs. the fall height. The frequency is measured by taking a side-view movie of the coiling pattern using a high speed camera (1000 f/s) and frame counting on the movie. The rotation frequency decreases at the beginning and then increases with the falling height. The frequency becomes zero at a certain height resulting in the diagonal of the ellipsoid coming to a halt, arranging bubbles in two straight lines (no spirals). See Fig. 6e and f.
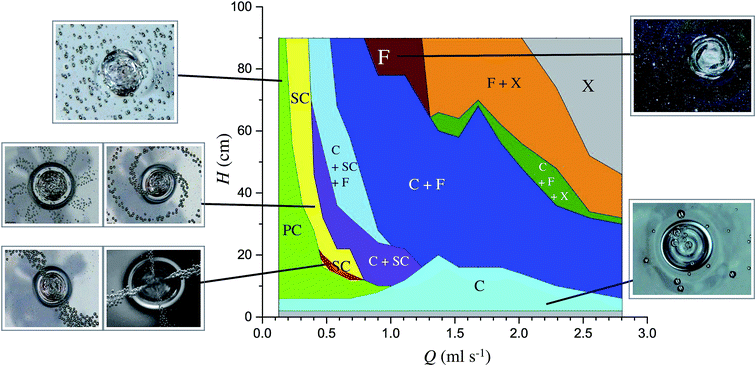
In our recent work,17 we provided a state diagram showing where each of the five states occurs in the parameter space flow rate vs. the fall height (Q, H) for a fixed viscosity. In this study, we also provided a (Q, H) phase diagram indicating bubble patterns formed at different flow rates Q and fall heights H (Fig. 8). A collected diagram of all the information provided so far on bubble patterns observed for different flow rates (Q) and fall heights (H) is shown in Fig. 8; a state diagram illustrating the areas where bubbles behave according to the relevant states extensively discussed throughout this section. The areas on the diagram are estimated by connecting the data points assigned to different bubble formations. Bubbles disappear for Q > 2.3 cm3 s−1 and falling heights H > 60 cm. These areas are indicated by the letter X. We found regions where bubbles exhibit a single pattern relevant to the corresponding state. The areas comprised of single states that result from a single flow state are shown connected to a photo of the corresponding bubble formation, and the coexisting states. Single states appear as irregular bubbles during simple coiling C, as high bubble population during folding (F), as bubbles generated during periodic collapse (PC), and as straight and spiral patterns formed during supercoiling (SC). Regions labeled C + SC + F, C + SC, C + F, C + F + X, and F + X indicate two or three different bubble patterns observed in different experiments carried out with the same flow rate and fall height.
Fig. 9 shows the size of large bubbles vs. height. The size of large bubbles is nearly constant and does not change considerably by varying the fall height in addition to the flow rate. The bubble sizes, however, depend on the viscosity of the liquid jet, that is, larger bubbles are generated by increasing the viscosity, and a larger flow rate is needed for supercoiling to occur leading to larger bubbles.
 | ||
| Fig. 9 The diameter of large bubbles generated by supercoiling state does not change with the fall height. The dashed lines show the average diameters. | ||
Furthermore, Fig. 5c shows the distribution of the bubble diameter in this state for a circular area of diameter 25 mm on the plate. Overall, we see the bubbles properly bi-dispersed in this state.
The bubbles generated inside the pile first move down the pile and then spread radially with the spreading film. Assuming the fluid volume is conserved and the height of the spreading fluid film is constant, we have Q = 2πrhv = const or  , where h is the height of the liquid film spreading on the solid surface, v is the average speed of the liquid film, and r is the radial position from the centre of the coil. Therefore, the radial position of a bubble in the spreading film r, follows
  or r ∼ t0.5. The experimental measurements in Fig. 10 show that bubbles move according to r ∼ t0.50±0.02 (after moving away a little from the point of generation). Since the supercoiling frequency of rotation of the diagonal of the ellipse (ΩRotatory) is constant for a fixed falling height and a fixed flow rate, the angle between two successive bubbles in one branch of the spiral is δθ ∼ ΩRotatoryδt, where δt is the period of bubble generation in each branch. Therefore, the angle is proportional to the time (θ ∼ t) for any generated bubble. This will give rise to a Fermat's spiral (i.e., a spiral obeying r ∼ θ0.5, where r is the radial position and θ is the angle) since r ∼ t0.5 ∼ θ0.5. The inset of Fig. 10 shows a fit of this simple model to the observations for an experiment with H = 28.5 cm, ν = 2200 cS, Q = 0.20 cm3 s−1, h = 7 mm, and ΩRotatory = 0.66 Hz. We have adjusted h to obtain the best fit between the experiments and the model. The best agreement shown in the inset of Fig. 10 is obtained for h = 6.7 mm, close to the experimental value. Therefore, our simple model provides a quantitatively detailed understanding of the formation of the spiral bubble patterns in the supercoiling state.
4 Conclusions
In this work, we presented an experimental study of the mechanism of bubble generation by a viscous liquid jet impacting a solid plate.We mapped out the experimental conditions under which bubble generation occurs and described how the bubbles are trapped between successive fluid coils or folds. We measured the size distribution of the bubbles, the rate of generation, and how the bubble size is affected by changes in the fall height, flow rate, and viscosity. We showed that some of these methods generate mono or bi-dispersed bubbles at high rates. Most of the usual methods for making monodispersed bubbles are very slow. By contrast, coiling and folding instabilities of falling viscous threads can, under appropriate conditions, generate mono or bi-disperse bubbles at a high rate that is proportional to the coiling or folding frequency (up to thousands of Hertz). The size of the generated bubbles can also be tuned by changing the experimental parameters as we have shown in our study. We have also shown that beautiful spiral patterns can be formed in the supercoiling state and found that these surprising spiral bubble patterns are located at r ∼ t0.5, which is a particular type of an Archimedean spiral  , namely, the Fermat spiral.
Acknowledgements
The authors gratefully thank N. Ribe for his useful discussions and B. Farnudi for his help in improving the writing of the manuscript. The experiments were carried out in the Complex Fluid Laboratory of IASBS. MH acknowledges support from VIDI fellowship from NWO.References
- É. Lorenceau, D. Quéré and J. Eggers, Phys. Rev. Lett., 2004, 93, 254501 CrossRef PubMed.
- A. Utada, E. Lorenceau, D. Link, P. Kaplan, H. Stone and D. Weitz, Science, 2005, 308, 537–541 CrossRef CAS PubMed.
- E. Lorenceau, Y. Y. C. Sang, R. Höhler and S. Cohen-Addad, Phys. Fluids, 2006, 18, 097103 CrossRef.
- Y. Zhu, H. Oguz and A. Prosperetti, J. Fluid Mech., 2000, 404, 151 CrossRef CAS.
- M. Habibi, P. Møller, N. Ribe and D. Bonn, EPL, 2008, 81, 38004 CrossRef.
- B. Pouligny and M. Chassande-Mottin, Phys. Rev. Lett., 2008, 100, 154501 CrossRef CAS PubMed.
- K. T. Kiger and J. H. Duncan, Annu. Rev. Fluid Mech., 2012, 44, 563–596 CrossRef.
- A. Prosperetti and H. N. Oguz, Annu. Rev. Fluid Mech., 1993, 25, 577–602 CrossRef.
- A. G. Bick, W. D. Ristenpart, E. A. van Nierop and H. A. Stone, Phys. Fluids, 2010, 22, 042105 Search PubMed.
- G. Barnes and R. Woodcock, Am. J. Phys., 1958, 26, 205–209 CrossRef.
- L. Mahadevan, W. Ryu and A. Samuel, Nature, 2000, 403, 502 CrossRef CAS.
- N. M. Ribe, Proceedings of the Royal Society of London A: Mathematical, Physical and Engineering Sciences, 2004, pp. 3223–3239 Search PubMed.
- M. Maleki, M. Habibi, R. Golestanian, N. Ribe and D. Bonn, Phys. Rev. Lett., 2004, 93, 214502 CrossRef CAS PubMed.
- M. Habibi, J. Najafi and N. M. Ribe, Phys. Rev. E: Stat., Nonlinear, Soft Matter Phys., 2011, 84, 016219 CrossRef PubMed.
- N. M. Ribe, M. Habibi and D. Bonn, Annu. Rev. Fluid Mech., 2012, 44, 249–266 CrossRef.
- M. Habibi, Y. Rahmani, D. Bonn and N. Ribe, Phys. Rev. Lett., 2010, 104, 074301 CrossRef CAS PubMed.
- M. Habibi, S. Hosseini, M. Khatami and N. Ribe, Phys. Fluids, 2014, 26, 024101 CrossRef.
- A. Javadi, J. Eggers, D. Bonn, M. Habibi and N. Ribe, Phys. Rev. Lett., 2013, 110, 144501 CrossRef CAS PubMed.
- M. Habibi, M. Maleki, R. Golestanian, N. M. Ribe and D. Bonn, Phys. Rev. E: Stat., Nonlinear, Soft Matter Phys., 2006, 74, 066306 CrossRef PubMed.
- N. Ribe, M. Habibi and D. Bonn, Phys. Fluids, 2006, 18, 084102 CrossRef.
Footnotes |
| † Present address: Department of Chemistry and Biochemistry, University of Lethbridge, Lethbridge AB T1K 3M4, Canada. |
| ‡ Present address: Department of Physics and Physical Oceanography, Memorial University of Newfoundland, St John's, NL, A1B 3X7, Canada. |
| This journal is © The Royal Society of Chemistry 2016 |


