Microstructure investigation, optical properties and magnetic phase transition of Tm3+ substituted nanocrystalline ZnO (Zn0.95Tm0.05O)

A. Bandyopadhyayae, N. Bhaktaa, S. Sutradharb, B. J. Sarkara, A. K. Debc, S. Kobayashid, K. Yoshimurad and P. K. Chakrabarti*a
aSolid State Research Lab., Department of Physics, Burdwan University, Burdwan 713 104, W.B., India. E-mail: pabitra_c@hotmail.com; Fax: +91 342 2657800; Fax: +91 342 2534200; Tel: +91 342 2657800 Tel: +91 342 2534200
bDepartment of Physics, Amity University, Rajarhat, Kolkata-700156, W.B., India
cDepartment of Physics, Raiganj University, Uttar Dinajpur-733 134, W.B., India
dDepartment of Chemistry, Kyoto University, Kyoto 606-8502, Japan
eDepartment of Physics, University of Gour Banga, Mokdumpur, Malda-732103, India

Received 22nd June 2016 , Accepted 7th October 2016

First published on 10th October 2016


Abstract

The magnetic phase transition, optical and dielectric properties of nanocrystalline Tm3+-doped zinc oxide (Zn0.95Tm0.05O), prepared by the co-precipitation method, were determined for the first time. The oxygen vacancy of the as prepared sample was enhanced by annealing at 200 °C for 6 h in an argon atmosphere. The formation of defects/oxygen vacancy is reflected in the Raman, FTIR and PL spectral analyses of the doped sample. Paramagnetic to ferromagnetic phase transition of Zn0.95Tm0.05O was observed at and below ∼30 K. The onset of ordering is successfully explained by the vacancy assisted bound-magnetic-polaron (BMP) model. The results of dielectric measurements suggest that the dielectric response of Zn0.95Tm0.05O is significantly enhanced, compared to that of pristine ZnO, and this is due to the presence of large amounts of oxygen vacancies, and the nanostructure of the sample.

1. Introduction

Research on dilute magnetic semiconductors (DMS) has been the focus of detailed investigations in the last few years, due to their potential applications in various electronic devices.1,2 The suitability of DMS for spintronics applications is derived from its ability to accommodate magnetic ions, which are a small fraction of host semiconductor cations. The spin polarization of charge carriers in semiconducting material is formed by the ferromagnetic (FM) exchange interaction among magnetic ions. In this direction, much work has been done on the magnetic properties of IV, III–V and II–VI DMS materials doped with magnetic cations.3–5 Among them, ZnO-based DMSs have been extensively studied because they have wide prospects for applications in spin-electronics and microwave devices, owing to the large band gap (3.37 eV) and high exciton binding energy (60 meV).6,7 During the last decade, various works on room temperature ferromagnetism (RTFM) have been reported for transition metal ions (Mn, Co, Fe, Ni, Cr, etc.) doped ZnO;8–12 however, in most of these cases, the ferromagnetism is due to the presence of trace amounts of metallic cluster/secondary phases, which restricts the utility of such materials for spintronics applications. Also, the magnetization in most of the cases is of the order of 10−3 emu g−1 or less,13,14 so they cannot be used in practical devices, due to the low degree of spin polarization. On the other hand, rare earth (RE) atoms/ions with partially filled f-orbitals have non-zero magnetic moments and they may also take part in magnetic coupling, as in the case of transition metals (TM) with partially filled d-orbitals. The free ion magnetic moments of some 4f ions are quite high compared to those of TM-ions. For example, the free ion magnetic moments of Dy3+, Tb3+, Tm3+ are 10.99, 9.72, 7.49 μB, respectively. Aside from their magnetic properties, RE-ions are good luminescence centers, due to their narrow and intense emission lines that originate from 4f intrashell transitions, and many investigations on the optical properties of Eu, Tb, and Er doped ZnO have been carried out.15,16 The RE-ion doped ZnO therefore has great potential for use, due to its multifunctional, semi-conducting/dielectric, magnetic and optical properties. As such, the investigations of the magnetic and optical properties of rare earth ion doped ZnO is a very interesting subject of recent research. In this direction, various works, including our works on magnetic properties of Gd, Ho, Tb, Dy, Er, Eu doped ZnO, have been reported.17–22 The presence and absence of magnetic ordering are both equally abundant in literature. Until now, the origin of ferromagnetism in rare earth ion doped ZnO has remained a very controversial topic. These facts motivated us to investigate the magnetic and optical properties of another RE ion doped ZnO, and as far as we know, the magnetic or optical properties of Tm3+ doped ZnO have not yet been reported. Herein, we report the structural, magnetic, optical and dielectric properties of nanocrystalline Tm3+ doped ZnO prepared by a chemical route. The origin of the low temperature magnetic ordering in the Tm3+ doped ZnO is also discussed. We show that Tm3+ doped ZnO exhibits a paramagnetic to ferromagnetic transition at ∼30 K, which is correlated with the structural defects.

2. Experimental methods

Samples of Tm3+ doped zinc oxide were prepared by a simple co-precipitation method. Zinc chloride hexahydrate (ZnCl2·6H2O) and thulium oxide were used as precursor materials in the co-precipitation method. To obtain a 2 g sample, we started with 5.33429 g of zinc chloride hexahydrate (0.021 M) and 0.223 g thulium oxide (0.00056 M). All the chemicals used were of analytical grade. The details of preparation were given in our earlier paper.19,20 In addition, we also prepared the pure ZnO sample by maintaining the same synthesis conditions to compare the physical properties with those of doped samples. The whole course of the washing of the co-precipitated particles was done several times, using boiled, triple distilled water to neutralize the pH, as well as to remove the extra ions. The co-precipitated particles were collected after filtration and the filtered precipitate was dried at room temperature (RT). Finally, the collected nano-powder of the doped sample was annealed at 200 °C under Ar atmosphere for 6 h and the sample was designated as ZTO.

The X-ray diffraction (XRD) pattern of ZTO was recorded using a Bruker D8 Advance diffractometer with Cu Kα radiation (λ = 0.15425 nm) in the 2θ range from 20° to 75°. Crystallite size/shape/distribution was analyzed using field emission scanning electron microscopy (FESEM, JSM-6700F, JEOL) and high resolution transmission electron microscopy (HRTEM, JEOL JEM-2100). Raman spectra of the sample were recorded at RT using a T64000 Raman spectrophotometer (J.Y. HORIBA) fitted with an argon ion (Ar+) laser, with 514.5 nm as the exciting radiation. Fourier transform infrared spectra (FTIR) were recorded on a FTIR spectrometer (8400S, Shimadzu) in the wavelength range of 400–3500 cm−1. The photoluminescence (PL) spectra were observed at RT using a luminescence spectrometer (F-4500 Hitachi). Magnetic measurements were carried out using Quantum Design SQUID Magnetometer in the temperature range of 300–10 K.

3. Results and discussion

3.1. 1X-ray diffraction (XRD) analysis

The XRD pattern of ZTO is shown in Fig. 1. All the peaks in the XRD pattern are duly assigned and this is in good agreement with the hexagonal wurtzite structure of ZnO, as given in the JCPDS file (no. 36-1451). Also, no peak corresponding to any other impurity phase, such as Tm2O3 etc., was found in the XRD pattern, which indicates the substitution of Tm3+ ions in the tetrahedral sites of Zn2+ ions in the wurtzite structure of ZnO. The comparison between the XRD pattern of pure ZnO nanoparticles with that of ZTO (first three intense peaks only) is also shown in the inset of Fig. 1. The diffraction peaks of pure and doped ZnO are all same, but the Bragg angle of the reflections showed a slight shift towards higher values, relative to that of undoped ZnO. For example, the first three intense peaks of pure ZnO were observed at 31.785°, 34.428° and 36.25693°, whereas, for the doped sample the peaks were situated at 31.803°, 34.450°, 36.281°. This is due to the creation of internal compressive micro stress. This structural strain results from the incorporation of the larger sized RE-ion into the ZnO lattice. Dakhel et al., showed that the doping with RE (Gd3+) ions creates oxygen vacancies in the ZnO crystalline structure, which cause the decrease in the lattice parameter.17 After the proper phase identification, the XRD pattern was analyzed by the Rietveld method using the software MAUD, and all the relevant information regarding structural and microstructural characterizations were extracted from this analysis.23 During the simulation, a series of structural and microstructural parameters were refined to generate the theoretical pattern and then these extracted parameters were compared with the experimental data by adopting a non-linear least squares procedure. The quality of fitting was assessed by the values of the goodness of fit (GOF) and also by different reliability parameters (Rw, Rexp, etc.), which were defined in our earlier papers.19,20 Interestingly, the value of GOF of ZTO is 1.37, which is very close to the ideal value (∼1), hinting that the observed XRD pattern is well fitted by the derived pattern. In our present refinement, the microstructure of ZTO appears to be anisotropic. Large scatter and global d* (=2[thin space (1/6-em)]sin[thin space (1/6-em)]θ/λ) dependence of β* (=β[thin space (1/6-em)]cos[thin space (1/6-em)]θ/λ) is observed in our case, which certainly indicates anisotropic size-strain broadening. Thus, the Popa model for anisotropic size-strain broadening (included in MAUD) has been used in our present Rietveld analysis.24 This analysis reveals that ZTO shows anisotropic values of crystallite size along different [hkl]. The volume averaged crystallite/particle size along (002) is ∼37 nm, whereas it lies between 25–28 nm for other directions. The r.m.s (root mean square) micro-strains are of the order of ∼10−4, and it is slightly higher for (002). Other results obtained from the Rietveld refinement are shown in Table 1. The values of GOF and R extracted from the fitting were successfully generated in the Rietveld refinement technique.
image file: c6ra16194d-f1.tif
Fig. 1 X-ray diffractogram and the fitted pattern of ZTO obtained from the Rietveld analysis (inset shows comparison of first three intense peaks between pure ZnO and ZTO).
Table 1 Results from Rietveld analysis
Cell (Å) a: 3.2522 (2 × 10⁻⁴)
b: 5.2097 (2 × 10⁻⁴)
Strain 4.6 × 10⁻⁴ (100)
6.9 × 10⁻⁴ (002)
3.8 × 10⁻⁴ (101)
4.4 × 10⁻⁴ (102)
4.6 × 10⁻⁴ (110)
Size (nm) 26 (100)
37 (002)
25 (101)
28 (102)
26 (110)
Biso 1.713 (0.097)
Rw (%) 4.914
Rb (%) 3.996
Rexp (%) 3.587
GOF 1.370


3.2 FESEM and HRTEM studies

The structural morphology of ZTO was investigated by FESEM, and a representative micrograph is shown in Fig. 2a, which confirms the formation of nanoparticles of ZTO. Careful observations of the micrograph show that the nanoparticles are more-or-less rectangular/rod-like. The length and diameter of the nanoparticles lie in the range of 30–90 nm and 20–60 nm, respectively. Thus, there is a large distribution in the length and diameter of the particles. For the detailed investigation of the microstructure and morphology of ZTO, HRTEM observations were also carried out and the results of the observations are shown in Fig. 2b–d. One representative micrograph of ZTO is shown in Fig. 2b. The FESEM and HRTEM images show that the sample was grown in the shape of aggregated particles, which are actually rectangular/rod-shaped particles and the corresponding values are in the range of ∼22–70 nm (breadth) and ∼25–90 nm (length). One such representative particle of 27 nm in width and 46 nm in length is shown in the inset of Fig. 2b. During HRTEM observations, the single crystalline lattice fringe pattern of a focused nanoparticle of ZTO was recorded and is shown in Fig. 2c, where the separation between the two consecutive parallel fringes was calculated and the calculated value is ∼2.81 Å. The separating distance of 2.81 Å between the consecutive fringes of Fig. 2c corresponds to the (100) lattice plane of ZnO. The fringe pattern observed in the nanoparticles indicates that the nanoparticles are single crystalline in nature. The selected area electron diffraction (SAED) pattern of ZTO was recorded and all the lattice planes corresponding to ZnO were detected in the SAED pattern and these planes were also assigned (Fig. 2d). The elemental compositions of ZTO were confirmed by EDX measurement and the corresponding results are shown in Fig. 2e. The maximum number of peaks corresponding to Tm is mainly observed above 6 keV. The EDX results demonstrated that the Tm3+ ions entered the ZnO lattices. It also revealed that the synthesized nano-particles are composed of the elements Zn, Tm and O. No traces of other impurity elements have been found in the EDX spectrum, which establishes the purity of the synthesized nanoparticles.
image file: c6ra16194d-f2.tif
Fig. 2 Results of FESEM and HRTEM observations of ZTO (a) micrograph obtained from FESEM (b) micrograph recorded during HRTEM (c) single crystalline lattice fringe pattern (d) SAED pattern and the corresponding assignment of lattice plane of ZTO (e) EDX of ZTO.

3.3 Raman studies

Raman spectroscopy provides useful information, such as the presence of the impurity phase, structural defects/oxygen vacancy, nanostructure, etc., of a material. Fig. 3 shows the Raman spectra of ZTO recorded at RT, which contain five different peaks at 101, 195, 333, 439 and 582 cm−1, whereas in the Raman spectra of bulk ZnO, three peaks are observed at 380, 413 and 444 cm−1, respectively.25,26 Normally, the Raman band of nanoparticle systems are modified, due to various reasons, like the absence/resurgence of peaks, the position of the frequency, line width, etc., compared to those of their bulk counterparts. In the case of ZTO, the sharpest peak found at 439 cm−1 is assigned to the E2 mode (Ehigh2), which is red shifted by 5 cm−1, compared to that of bulk ZnO. The observed band at 101 cm−1 is assigned to the non-polar optical phonon mode (Elow1) of the ZnO lattice. The peak observed at 333 cm−1 is the second-order Raman mode, arising from zone-boundary phonons, and can be assigned as Ehigh2–Elow1.27 The broad peak at around 582 cm−1 is attributed to the E1(LO) mode. The peak observed at 195 cm−1 is assigned to the 2Elow2 mode.28 It is generally accepted that the E1(LO) peak is caused by the defects due to the O-vacancy, Zn-interstitial defect states or these complexes and free carriers. Therefore, the observation of the E1(LO) peak indicates the presence of large structural defects in ZTO.29 The red shift of the Raman peaks of ZTO may be attributed to the relaxation of the phonon wave vector selection rule caused by the nanostructure of the doped sample.29–31 In addition, the presence of large amounts of structural defects in ZTO, which is also substantiated by FTIR and PL analyses (discussed in the later sections), is the cause of phonon localization. The absence of Raman characteristic peaks of any impurity phases in ZTO confirmed the substitution of Tm3+ ions in the lattice of ZnO. This result is also consistent with the Rietveld refinement of the XRD pattern and the analysis of HRTEM data, which also ruled out the presence of any impurity phase other than the desired phase of ZnO.
image file: c6ra16194d-f3.tif
Fig. 3 Raman spectra of ZTO recorded at RT.

3.4 Fourier transform infrared spectra (FTIR) studies

The FTIR spectra of ZTO are shown in Fig. 4a. The absorption peaks at around 3386 cm−1, 1404 cm−1, 886 cm−1 and 691 cm−1 are associated with the characteristic vibration of the –OH group, which is adsorbed on the surface of the zinc oxide particles due to its hygroscopic nature.32–34 The weak doublet at about 2400 cm−1 and a minor peak at 1494 cm−1 were observed due to the existence of CO2 molecules in the air. The sample might have trapped some CO2 from the atmosphere during FTIR measurement.35,36 The absorption peak at around 831 cm−1 can be attributed to the Zn–O vibration mode. Among the three infrared absorption bands in the range 400–600 cm−1 (enlarged in the inset of Fig. 4a), two strong absorption bands are observed at 443 and 482 cm−1, which are attributed to Zn–O stretching.37 The band observed at 531 cm−1 may be attributed to oxygen deficiency and/or oxygen vacancy (VO) present in the ZnO, which is naturally created, due to the annealing of the sample in a vacuum/inert atmosphere.38 However, the disparity between the ionic radii of Zn2+ (∼0.76 Å) and Tm3+ (∼0.94 Å) results in a greater number of structural/vacancy defects, such as oxygen vacancies, zinc interstitials, oxygen interstitials, and zinc vacancies in the host ZnO. Interestingly, no distinguishing features of any impurity phase, like Tm2O3, is found in the FTIR spectra, which is also in agreement with the findings of XRD, HRTEM and Raman analyses.
image file: c6ra16194d-f4.tif
Fig. 4 (a) FTIR, (b) PL spectra of ZTO recorded at RT.

3.5 Photoluminescence (PL) studies

The photoluminescence spectrum of ZTO at RT is displayed in Fig. 4b. Thus, in the case of ZTO, a sharp peak in the UV region at around 372 nm is observed. Here, the strong UV emission is due to the free exciton emission from the wide band gap of ZnO. Apart from this, three weak bands are observed at around 405, 467 and 523 nm, respectively. These peaks reflect the presence of the structural defects in our samples. Among them, the donor defects are oxygen vacancies and zinc interstitials, and the acceptor defects are zinc vacancies. Here, the observed peak at 405 nm may be attributed to the transition between the conduction band and zinc vacancy, and the peak recorded at 467 nm is due to the transition between the zinc interstitial and the zinc vacancy level.39,40 The peak observed at 523 nm can be attributed to the electron transition mediated by the defect level in the band gap, such as oxygen vacancies, which are generally formed during the annealing in the inert atmosphere. However, we did not observe any typical 4f–4f emissions of Tm3+ ions, due to the quenching effect of the defect-related transition. This may be due to the inappropriate energy level positions of Tm3+ in comparison to that of the host matrix.41 At the same time, the low concentration of Tm3+ in ZnO may result in a deficiency of energy transfer from the ZnO host to the dopant Tm3+ ions.

3.6 Magnetic studies

The magnetic susceptibility (χ) of pure ZnO in the temperature range of 300–14 K was measured in our homemade Faraday setup,19,20 as shown in Fig. 5. From the figure, it is evident that ZnO shows paramagnetic type behavior with a very low value of magnetic susceptibility of 9.78 × 10⁻⁷ emu g−1 Oe−1 at RT. As temperature decreases, the susceptibility of ZnO increases and reaches to 4.89 × 10⁻⁶ emu g−1 Oe−1 at 14 K. The measured susceptibility recorded at different temperatures was fit to the well-known Curie–Weiss law image file: c6ra16194d-t1.tif where C is the Curie constant and θ is the Curie temperature. The respective fittings, along with the observed data are shown in the inset of Fig. 5a, where it is evident that the χ vs. T curve of pure ZnO is well fitted by the Curie–Weiss law, which indicates that ZnO is purely paramagnetic with very feeble magnetization and will not show any type of magnetic ordering down to 14 K.
image file: c6ra16194d-f5.tif
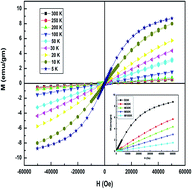
Fig. 5 (a) ZFC and FC curves of ZTO; inset shows χ vs. T curve for pure ZnO. (b) Magnetization vs. field curve (MH loop) of ZTO recorded at 300, 250, 200, 100, 50, 30, 20, 10 and 5 K.

Fig. 5a shows the variation of zero field cooled (ZFC) and field cooled (FC) magnetizations (M) of ZTO as a function of temperature. From these curves we do not see any significant difference between FC and ZFC magnetization. In case of ZTO, the magnetic susceptibility at RT is 1.08 × 10⁻⁵ emu g−1 Oe−1 and reaches to 1.02 × 10⁻⁴ emu g−1 Oe−1 as temperature decreases to 14 K. Thus, the considerable increase in magnetization is attributed to the successful doping of the Tm3+ ion in the host ZnO. To estimate the effective magnetic moment (Peff) of ZTO from the measured values of susceptibility, we used the relation 2.828 × (χm × temperature in K)0.5, where χm is the molar susceptibility. The calculated value of Peff at RT is 6.52 μB (μB is the Bohr magnetron) and the error in the calculation of the effective magnetic moment is estimated as ±0.01 μB. The estimated value is lower than the free ion value of Tm3+, which is 7.49 μB.

To confirm the presence of the magnetic phase transition, if any, we observed the magnetization vs. field (MH) curves of ZTO at various temperatures, from 300 K down to 5 K, where the maximum applied field was ∼5 T. MH curves were recorded at 300, 250, 200, 100, 50, 30, 20, 10 and 5 K, and the corresponding curves are shown in Fig. 5b. Among all these curves, MH curves recorded at 300, 250, 200, 100, 50 K are paramagnetic type, but a distinct non-linearity was found in the case of the MH curve recorded at 30 K. Thus, the paramagnetic to ferromagnetic phase transition is initiated at ∼30 K. To check the non-linearity, we have depicted the initial MH curves, down to 5 K, as shown in Fig. 6a, where it is seen that the data points recorded down to 50 K are perfectly linear, while the data points recorded at 30 K deviate from the linearity. As temperature decreases, the loop becomes prominent and the maximum magnetization reaches 8.77 emu g−1 (5 T applied field) at 5 K. In our case, the hysteresis loops are not saturated, even at 5 K, with the applied field of 5 T. This certainly indicates that our sample is not purely ferromagnetic at low temperature, but is in the mixed state where both the paramagnetic (PM) and ferromagnetic (FM) phases coexist in ZTO, which can be explained using the BMP model, as discussed later. Our magnetic results show mainly the paramagnetic dominated behaviour of ZTO, which is very much consistent with the recent theoretical studies of another RE (Gd) doped ZnO system reported by Bantounas et al.42 According to their calculation, the Gd[thin space (1/6-em)]:[thin space (1/6-em)]ZnO will show PM dominated behaviour along with very weak FM coupling. The exchange coupling is weak, never exceeding 10 meV per magnetic ion pair. Thermal fluctuations can easily destroy the feeble magnetic ordering, which results in PM dominated behaviour at room temperature; thus, low temperature magnetic ordering in ZTO substantiates their theoretical prediction.


image file: c6ra16194d-f6.tif
Fig. 6 (a) Initial magnetization vs. field curve at 300, 250, 200, 100, 50, 40, 30, 10 and 5 K. (b) Initial magnetization vs. field curve fitted by the BMP model at 5 K.

It is well recognized that magnetic properties/magnetic ordering of the nanocrystalline diluted magnetic system is governed by the various factors viz., particle sizes and their distribution, the shape of the particles, grain boundary, annealing temperature, intrinsic properties of the doped ions, oxygen vacancies, secondary phase/impurities, etc. Here, we have used Tm3+ as the dopant ion. The most likely impurity that may appear in the synthesis is Tm2O3, which is paramagnetic down to 5 K.43 However, the cause of the introduction of the ferromagnetism by impurities can be easily ruled out, since no signature due to any impurity/contaminations has been found in the Rietveld analysis of the XRD pattern and this fact is also substantiated by HRTEM, Raman, FTIR analyses of the ZTO. Considering the paramagnetic phase of Tm2O3 down to 5 K, the ferromagnetism in ZTO is most likely induced by the Tm3+ incorporated into the ZnO matrix. Although there are different explanations behind the observed ferromagnetism/paramagnetism in the 4f-ion doped diluted system, its exact cause is still under debate.

The structural defects have a crucial role in determining the magnetic behavior of ZnO. The results of Raman, FTIR and PL observations also indicate the presence of defects in the sample. Shi et al. used first principles to simulate rare-earth (Gd, Nd) doped ZnO systems. The results revealed that oxygen vacancies (VO) contributed much more than zinc vacancies (VZn) for the diluted ferromagnet, as the doping of trivalent ions would induce more VO.44 In addition, the coupling between s and f states of ZnO and RE3+ ions also favors the onset of magnetic ordering in the present sample.45 Considering the low dopant density and unsaturated hysteresis loop of ZTO, the ferromagnetic behavior may be explained by the BMP model by Coey et al., which is applicable for high resistive (as evident from dielectric behavior of ZTO) samples because their carriers are localized.46 In our case, an electron locally trapped in VO has an important function in the spin orientations of neighboring Tm3+ ions. In ZTO, the electrons are locally trapped by VO with occupying an orbital, overlapping with the 4f shells of Tm3+ neighbours and forming BMPs. When the polarons are of sufficient size and concentration, then their overlapping produces longer polarization. If oxygen vacancies are absent, neighboring Tm3+ ions that were coupled via a VO (ferromagnetic exchange) are now being coupled by an oxygen bond (super exchange interaction), causing the destruction of magnetic ordering.

According to Coey's model, the measured magnetization due to interactions between BMPs can be described as follows:47

M = M0L(x) + χmH

The details of fitting and the symbols are explained in the previous paper.47 Thus, net magnetization is the additive effect of both correlated [FM] and isolated [PM] spins.48 The sample is envisioned as the distribution of BMPs, where localized charge carriers strongly interact with doped RE ions (correlated spin). The fraction of doped RE ions that does not take part in the BMP interaction are expected to behave like an independent paramagnetic part and contribute towards the paramagnetism (isolated spin).

We analyzed the initial MH curve recorded at 30, 20, 10 and 5 K by the BMP model, as in these cases, the magnetic moments show strong variation from linearity and one fitting at 5 K is shown in Fig. 6b. The value of the spontaneous moment M0, number of BMP/volume and the effective moment/BMP (meff in emu) estimated from the fittings are respectively, 9.55 emu g−1, 1.13 × 10²⁰, 8.45 × 10⁻²⁰ (5 K); 6.59 emu g−1, 7.35 × 10¹⁹, 8.96 × 10⁻²⁰ (10 K); 6.16 emu g−1, 5.38 × 10¹⁹, 1.14 × 10⁻¹⁹ (20 K); and 3.78 emu g−1, 2.49 × 10¹⁹, 1.52 × 10⁻¹⁹ (30 K). From the results extracted from the fitting, it is evident that M0 is found to increase but meff is found to decrease with a decrease in temperature. The increase M0 in could be due to the interaction between BMPs and the paramagnetic matrix. The possible reason for low meff at lower temperature may be due to the reduced size of the BMPs.49 It is worth noting that the calculated concentrations of BMPs is of the order of ∼1020 cm−3 at 5 K, which is sufficient for the percolation of BMPs to mediate long range FM ordering.50 This is the main reason for the high value of magnetization of ZTO below 10 K. Thus at higher temperature (above ∼30 K) the Tm-ions are distributed as uncoupled spin or isolated BMPs which results in paramagnetic behavior, and below 30 K only a fraction of BMPs can overlap and lead to the FM phase mixed with the dominant PM phase. As temperature decreases further, the polaron concentration increases and BMPs randomly associate with the oxygen vacancies overlap, leading to long range ferromagnetic ordering, and hysteresis loops become prominent. Our result is consistent with previous results obtained by other researchers. For example, Liu et al., obtained similar result for V doped ZnO, where magnetic contribution was due to dominant PM parts coming from isolated BMPs and weak FM phases, due to overlapping BMPs.51 Jing et al. also reported the co-existence of PM and FM phases in an Er doped ZnO system.52 Thus, it can be concluded that low temperature ferromagnetism in ZTO is purely intrinsic and caused by structural defects. In the present case, the value of magnetization (8.77 emu g−1 at 5 T) is very high compared to most of the doped ZnO diluted systems reported previously in literature.13,14

It is worth noting that most of the magnetic orderings at room temperature are reported in thin film systems, whereas the powder samples lack any magnetic ordering, except for Gd3+ doped ZnO. For example, Akyol et al., did not observe any type of magnetic ordering down to 10 K in Ho3+ and Dy3+ doped ZnO powder samples with different concentrations.53,54 Low temperature (∼5 K) magnetic ordering was reported in Ho3+ and Tb3+ and Eu3+ doped ZnO nanocrystals.18,55,56 In all three cases, the magnetizations at 5 K were ∼0.12, 0.004 and 0.040 emu g−1, respectively. Thus, in the case of ZTO, we are not only able to raise the ordering temperature up to 30 K, but also the magnetization was remarkably enhanced to 8.75 emu g−1 at 5 K. This robust magnetization was achieved by the creation of oxygen vacancies within the sample by annealing in an inert atmosphere. We are also able to successfully explain the origin of the magnetic ordering and high magnetization by the bound magnetic polaron model.

3.7 Dielectric studies

The variations of the real parts of the dielectric constant (ε) and dielectric loss (tan[thin space (1/6-em)]δ) as a function of frequency with range of 1 kHz to 1 MHz at RT for both ZTO and pure ZnO are shown in Fig. 7. The value of ε decreases rapidly from a high value, with the increase in frequency, and finally it becomes saturated at a small value, showing a strong dependency of dielectric constant on frequency, which is a clear indication of Debye-like relaxation. In the high frequency region, the contribution comes from the electronic and ionic polarizations. In the low frequency region, the permanent dipoles of the sample are able to align themselves with the field and consequently, contribute fully to the dielectric properties. However, in the high frequency region, the dipoles are unable to align themselves with the rapid changing of the field, and so the dielectric constant drops in this region. Fig. 7b shows the variation of the corresponding dielectric loss (tan[thin space (1/6-em)]δ) values of ZTO as a function of frequency. Loss tangent, i.e. tan[thin space (1/6-em)]δ, represents the energy dissipation in the dielectric system. It can be seen that tan[thin space (1/6-em)]δ decreases with the increase of frequency, which might be due to the space charge polarization. At RT, the dielectric constant of ZTO in the low frequency region is very high (∼1300), which attains a low, but constant value (∼42) in the high frequency region (above 1 kHz). On the other hand, the dielectric constant of pure ZnO, as obtained from the graph, is ∼190 in the low frequency region and reaches to a constant value of ∼36 in the high frequency region. Thus, the dielectric constant is considerably enhanced in ZTO, compared to that of the pure ZnO. In addition, the measured value of the dielectric constant of ZTO is also higher than the other reported values for ZnO nanoparticles. For example, the reported values for the dielectric constants of ZnO nanoparticles are in the range of 10 to 15, at about 1 MHz frequency and increase steadily to relatively higher values of 40 to 70 at 1 kHz.18,57 However, in the present doped sample of ZTO, the dielectric constant is ∼45 (at 1 MHz) and ∼147 (at 1 kHz), which indicates the enhancement of the dielectric properties. The higher ε of ZTO correlates to a higher oxygen vacancy concentration, due to annealing in an inert atmosphere.58 Thus, positive oxygen vacancies, together with the negative oxygen ions, enhance the net dipole moment of the system. These enhanced dipole moments contribute to the better dielectric response.57 On the other hand, nanostructured materials have about 1019 interfaces per cm3, which is much greater than those of their bulk counterparts. Thus, the increase of the interfaces leads ZTO to be more insulating in nature. Therefore, it can be concluded that the Tm3+ doped ZnO also poses good dielectric properties and has potential for application in high frequency devices, where substantial dielectric response is needed.
image file: c6ra16194d-f7.tif
Fig. 7 Dielectric behavior of ZTO and pure ZnO (a) variation of dielectric constant (b) variation of loss tangent as a function of frequency.

4. Conclusions

Tm3+ doped ZnO (Zn0.95Tm0.05O) and pure ZnO were successfully prepared by a simple co-precipitation method. FESEM and HRTEM micrographs of the doped sample show the formation of rectangular/rod-like structures with a good size distribution. EDX analysis indicates the doping of Tm3+ ion in the host ZnO lattice. It was found that the doping of Tm3+ results in the increase of many different intrinsic defects, which also affects the corresponding structural, optical, magnetic and dielectric properties of ZTO. A magnetic phase transition from paramagnetic to ferromagnetic in Zn0.95Tm0.05O is achieved at and below ∼30 K. The observed hysteresis loops were not saturated, which indicates the coexistence of the paramagnetic and ferromagnetic phases; this fact is also supported by the BMP model. Interestingly, the bulk magnetization of Zn0.95Tm0.05O is considerably high, which is achieved due to the high magnetic moment of Tm3+ (7.49 μB) and this would be helpful for applications in electronic devices. The ferromagnetic behavior is attributed to the correlation of the BMP, and these polarons are generated by the oxygen vacancies present in the sample. The creation of oxygen vacancies is also substantiated by Raman, PL and FTIR spectra, which are very sensitive, for the detection of defects in the sample. The high value of the dielectric constant of Zn0.95Tm0.05O, compared to that of the pure ZnO would be helpful for future application. The dielectric and magnetic properties of ZnO are enhanced by doping with Tm3+ ions, which is quite interesting from both theoretical and experimental points of view.

Acknowledgements

The authors wish to acknowledge the financial support provided by the UGC-DAE-CSR-KC, Govt of India (UGC-DAE-CSR-KC/CRS/13/MS04/Ext/2015 dated: 23.09.2015) and the financial support provided by the UGC, Govt of India, through the CAS program.

References

  1. S. A. Chambers and B. Gallagher, New J. Phys., 2008, 10, 055004–055012 CrossRef.
  2. T. Dietl, Nat. Mater., 2010, 9, 965–974 CrossRef CAS PubMed.
  3. Y. Wang, F. X. Xiu, Y. Wang, X. F. Kou, A. P. Jacob, K. L. Wang and J. Zou, J. Alloys Compd., 2010, 508, 273–277 CrossRef CAS.
  4. D. Soundararajan, P. Peranantham, D. Mangalaraj, D. Nataraj, L. Dorosinskii, J. Santoyo-Salazar and J. M. Ko, J. Alloys Compd., 2011, 509, 80–86 CrossRef CAS.
  5. H. Munekata, H. Ohno, S. Von Molnar, A. SegmÄuller, L. L. Chang and L. Esaki, Phys. Rev. Lett., 1989, 63, 1849–1852 CrossRef CAS PubMed.
  6. H. Ohno, A. Shen, F. Matsukura, A. Oiwa, A. Endo, S. Katsumoto and Y. Iye, Appl. Phys. Lett., 1996, 9, 363–365 CrossRef.
  7. A. Kaushal and D. Kaur, J. Alloys Compd., 2011, 509, 200–205 CrossRef CAS.
  8. D. C. Kundaliya, S. B. Ogale and S. E. Lofland, Nat. Mater., 2004, 3, 709–714 CrossRef CAS PubMed.
  9. K. Rode, A. Anane, R. Mattana, J. P. Contour, O. Durand and R. Le Bourgeois, J. Appl. Phys., 2003, 93, 7676–7678 CrossRef CAS.
  10. J. H. Shim, T. Hwang, S. Lee, J. H. Park, S. J. Han and Y. H. Jeong, Appl. Phys. Lett., 2005, 86, 082503 CrossRef (3pp).
  11. P. Sharma, A. Gupta, K. V. Rao, F. J. Owens, R. Sharma, R. Ahuja, J. M. O. Guillen, B. Johansson and G. A. Gehring, Nat. Mater., 2003, 2, 673–677 CrossRef CAS PubMed.
  12. S. Thota, T. Dutta and J. Kumar, J. Phys.: Condens. Matter, 2006, 18, 2473–2486 CrossRef CAS.
  13. J. Anghel, A. Thurber, D. A. Tenne, C. B. Hanna and A. Punnoose, J. Appl. Phys., 2010, 107, 09E314 CrossRef (3pp).
  14. D. A. Schwartz, N. S. Norberg, Q. P. Nguyen, J. M. Parker and D. R. Gamelin, J. Am. Chem. Soc., 2003, 125, 13205–13218 CrossRef CAS PubMed.
  15. S. Sadhu, T. Sen and A. Patra, Chem. Phys. Lett., 2007, 440, 121–124 CrossRef CAS.
  16. M. Hee Choi and T. Young Ma, Mater. Lett., 2008, 62, 1835–1838 CrossRef.
  17. A. A. Dakhel and M. El-Hilo, J. Appl. Phys., 2010, 107, 123905 CrossRef.
  18. S. Singh, J. N. DivyaDeepthi, B. Ramachandran and M. S. Ramachandra Rao, Mater. Lett., 2011, 65, 2930–2933 CrossRef CAS.
  19. A. Bandyopadhyay, A. K. Deb, K. Mukhopadhyay, S. K. Roy and P. K. Chakrabarti, J. Mater. Sci., 2012, 47, 2284–2289 CrossRef CAS.
  20. A. Bandyopadhyay, S. Modak, S. Acharya, A. K. Deb and P. K. Chakrabarti, Solid State Sci., 2010, 4, 448–453 CrossRef.
  21. F.-Y. Lo, Y.-C. Ting, K.-C. Chou, T.-C. Hsieh, C.-W. Ye, Y.-Y. Hsu, M. YauChern and H.-L. Liu, J. Appl. Phys., 2015, 117, 07B5231–07B5233 CrossRef.
  22. S. Cho, J. Alloys Compd., 2011, 509, 6321–6324 CrossRef.
  23. L. Lutterotti and P. Scardi, J. Appl. Crystallogr., 1990, 23, 246–252 CrossRef CAS.
  24. A. K. Deb, P. Chatterjee and S. P. Sengupta, J. Appl. Crystallogr., 2007, 40, 33–40 CrossRef CAS.
  25. A. Arguello, D. L. Rousseau and S. P. S Porto, Phys. Rev., 1969, 181, 1351–1363 CrossRef.
  26. H. Zhong, J. Wang, X. Chen, Z. Li, W. Xu and W. Lu, J. Appl. Phys., 2006, 99, 103905 CrossRef (5 pp).
  27. R. Zamirin, A. Kaushal, A. Rebelo and J. M. F. Ferreira, Ceram. Int., 2014, 40, 1635–1639 CrossRef.
  28. M. K. Gupta, N. Sinha and B. Kumar, J. Appl. Phys., 2012, 112, 014303 CrossRef (4pp).
  29. V. A. Fonoberov and A. A. Balandin, Phys. Rev. B: Condens. Matter Mater. Phys., 2004, 70, 233205 CrossRef (4pp).
  30. K. A. Alim, V. A. Fonoberov, M. Shamsa and A. A. Balandin, J. Appl. Phys., 2005, 97, 124313 CrossRef (5pp).
  31. M. S. Samuel, A. Chandan and K. C. George, Indian J. Pure Appl. Phys., 2010, 48, 703–708 Search PubMed.
  32. S. Muthukumaran and R. Gopalakrishnan, Opt. Mater., 2012, 34, 1946–1953 CrossRef CAS.
  33. J. Coates, Interpretation of Infrared Spectra, A Practical Approach in Encyclopedia of Analytical Chemistry, ed. R. A. Meyers, John Wiley & Sons Ltd, Chichester, 2000, p. 10815 Search PubMed.
  34. P. Joshi, S. Chakraborti, P. Chakrabarti, D. Haranath, V. Shanker, Z. A. Ansari, S. P. Singh and V. Gupta, J. Nanosci. Nanotechnol., 2009, 9, 6427–6433 CrossRef CAS PubMed.
  35. W. M. H. Oo, M. D. Mccluskey, A. D. Lalonde and M. G. Norton, Appl. Phys. Lett., 2005, 86, 73111 CrossRef (4pp).
  36. M. A. Gondal, Q. A. Drmosh, Z. H. Yamani and T. A. Saleh, Appl. Surf. Sci., 2009, 256, 298–304 CrossRef CAS.
  37. S. Chauhan, M. Kumar, S. Chhoker, S. C. Katyal and V. P. S. Awana, J. Mater. Sci.: Mater. Electron., 2013, 24, 5102–5110 CrossRef CAS.
  38. G. Xiong, U. Pal, J. G. Serrano and K. B. Ucer, Phys. Status Solidi C, 2006, 10, 3577–3581 CrossRef.
  39. K. Vanheusden, C. H. Seager, W. L. Warren, D. R. Tallant and J. A. Voigt, J. Appl. Phys., 1996, 79, 7983–7986 CrossRef CAS.
  40. P. K. Samanta and A. K. Bandyopadhyay, Appl. Nanosci., 2012, 2, 111–117 CrossRef CAS.
  41. Y.-P. Du, Y.-W. Zhang, L.-D. Sun and C.-H. Yan, J. Phys. Chem. C, 2008, 112, 12234–12241 CAS.
  42. I. Bantounas, V. Singaravelu, I. S. Roqan and U. Schwingenschlogl, J. Mater. Chem. C, 2014, 2, 10331–10336 RSC.
  43. Ł. Gondek, D. Kaczorowski, A. Szytuła, D. Kaczorowski and A. Szytuła, Solid State Commun., 2010, 150, 368–370 CrossRef.
  44. H. L. Shi, P. Zhang, S. S. Li and J. B. Xia, J. Appl. Phys., 2009, 106, 0239101 Search PubMed (5 pp).
  45. J. H. Zheng, J. L. Song, Z. Zhao, Q. Jiang and J. S. Lian, Cryst. Res. Technol., 2012, 47, 713–718 CrossRef CAS.
  46. J. M. D. Coey, M. Venkatesan and C. B. Fitzgerald, Nat. Mater., 2005, 4, 173–179 CrossRef CAS PubMed.
  47. A. Bandyopadhyay, S. Sutradhar, B. J. Sarkar, A. K. Deb and P. K. Chakrabarti, Appl. Phys. Lett., 2012, 100, 25241 Search PubMed (5 pp).
  48. A. Bandyopadhyay, A. K. Deb, S. Kobayashi, K. Yoshimura and P. K. Chakrabarti, J. Alloys Compd., 2014, 611, 324–328 CrossRef CAS.
  49. T. Bora, B. Samantaray and S. Mohanty, IEEE Trans. Magn., 2011, 47, 3991–3994 CrossRef CAS.
  50. B. K. Santara, B. Pal and P. K. Giri, J. Appl. Physiol., 2011, 110, 114322 CrossRef , (7pp).
  51. S. H. Liu, H. S. Hsu, C. R. Lin, C. S. Lue and J. C. Huang, Appl. Phys. Lett., 2007, 90, 222505 CrossRef (3pp).
  52. J. Qi, D. Gao, J. Liu, W. Yang, Q. Wang, J. Zhou, Y. Yang and J. Liu, Appl. Phys. A, 2010, 100, 79–82 CrossRef CAS.
  53. M. Akyol, A. Ekicibil and K. Kiymaç, J. Supercond. Novel Magn., 2013, 26, 3257–3262 CrossRef CAS.
  54. M. Akyol, T. Fırat and K. Kıymaç, J. Supercond. Novel Magn., 2013, 26, 2439–2445 CrossRef CAS.
  55. G.-R. Li, X.-H. Lu, C.-Y. Su and Y.-X. Tong, J. Phys. Chem. C, 2008, 112, 2927–2933 CAS.
  56. J. Hua Wu, J. Hyun Min, J. Sung Lee, J.-S. Ju and Y. K. Kim, J. Appl. Phys., 2012, 111, 07B523 Search PubMed (3pp).
  57. A. S. Lanje, S. J. Sharma, R. S. Ningthoujam, J. S. Ahn and R. B. Pode, Adv. Powder Technol., 2013, 24, 331–335 CrossRef CAS.
  58. M. A. Pires, C. Israel, W. Iwamoto, R. R. Urbano, O. Agüero, I. Torriani, C. Rettori and P. G. Pagliuso, Phys. Rev. B: Condens. Matter Mater. Phys., 2006, 73, 224404 CrossRef (6 pp).

This journal is © The Royal Society of Chemistry 2016