Localized delivery and enhanced osteogenic differentiation with biodegradable galactitol polyester elastomers

Janeni Natarajana, Giridhar Madrasb and Kaushik Chatterjee*c
aCentre for Nano Science and Engineering, Indian Institute of Science, Bangalore-560012, India
bDepartment of Chemical Engineering, Indian Institute of Science, Bangalore-560012, India
cDepartment of Materials Engineering, Indian Institute of Science, Bangalore-560012, India. E-mail: kchatterjee@materials.iisc.ernet.in; Fax: +91-80-23600472; Tel: +91-80-22933408

Received 3rd May 2016 , Accepted 18th June 2016

First published on 20th June 2016


Abstract

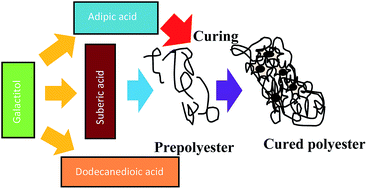
Given that a large fraction of the population suffers from orthopaedic diseases, the research in developing polymeric biomaterials for bone tissue regeneration applications is witnessing an exponential growth rate. We present a spectrum of novel polyesters synthesized by the reaction of galactitol with dicarboxylic acids, namely adipic acid, suberic acid and dodecanedioic acid. Fourier transform infrared spectroscopy and nuclear magnetic resonance spectroscopy confirmed the chemical structure of the polymers. Thermal characterization revealed that these polyesters were semi-crystalline. The molecular weight of the polyesters showed an increase with increase in the chain length of the diacid and the molar ratio of galactitol[thin space (1/6-em)]:[thin space (1/6-em)]diacid. Dynamic mechanical analysis showed that the polymers were elastomeric in nature with the increase in chain length and molar ratio of galactitol[thin space (1/6-em)]:[thin space (1/6-em)]diacids. Surface hydrophobicity and the swelling ratio increase with increase in the chain length and molar ratio of galactitol[thin space (1/6-em)]:[thin space (1/6-em)]diacids. Hydrolytic degradation studies demonstrated that the kinetics of the degradation followed first order. Dye release studies indicated that the rate of release followed Higuchi kinetics. In vitro studies confirmed the cytocompatible nature of these polymers. Mineralization by osteoblasts in vitro suggests that these polymers support osteogenic differentiation, thus elucidating that these polymers are promising candidate materials for bone tissue engineering. Thus, this study presents a significant advance in which the mechanical properties, degradation and release rates of the polyesters may be tuned by manipulating the process parameters.


1. Introduction

Despite the robust regenerative traits of bone, the occurrence of functional loss in certain compromised circumstances is unavoidable.1 Owing to the shortcomings associated with autografts and allografts, developing new strategies for bone regeneration is fueled by the pain associated with bone defects.2 One trending strategy is the application of materials as guiding templates enabling tissue regeneration. These materials are also designed to function as delivery vehicles contributing to the controlled release of bioactive factors3 and also as matrices providing a suitable micro-environment for the cells.1 The last few decades have witnessed scientists pursuing the paradigm of creating biodegradable polymeric scaffolds that orchestrate the cells to form the original tissue replacing the defective ones.4

Polyesters are universally preferred among biodegradable polymers for both drug delivery and regenerative medicine due to their innumerable advantages, in particular, their hydrolytic cleavage in the aqueous environment in vivo.5–7 Thermoset polymers undergo degradation by a combination of bulk and surface erosion mechanism where the structure predominantly remains unaltered throughout the degradation process.8 Monomers based on animal or plant based sources can potentially also be used to synthesize polymers. These polymers and the degradation products from these polymers are likely to be non-toxic.

It is postulated that crystallinity may improve the mechanical strength of the resulting polymers9 and aid in the formation of bone. It is believed that the higher modulus of the biomaterial can more efficiently direct cells towards osteogenic lineage.10 In this work, galactitol was chosen since it imparts crystalline nature to crosslinked polyesters that are generally amorphous.11,12

Galactitol based analogues have been previously used in the synthesis of polyesters.12 However, pure galactitol has not been used in the synthesis of polymers. The dicarboxylic acids used in this work were adipic, suberic and dodecanedioic acids that have been shown to be cytocompatible.13,14 The aforesaid acids have been used in the synthesis of various polymers such as polyesters, poly(ester amides), poly(anhydride esters) etc.15–18 Galactitol, derived from galactose, is excreted from our body via urine19 while the dicarboxylic acids are usually eliminated via β-oxidation pathway.20 Thus these polymers are expected to be cytocompatible.

In this study, galactitol based polyesters were synthesized with different acids with linearly increasing chain lengths and varying molar stoichiometric ratios. It was envisaged that the change in the monomer and their ratios will yield differences in the hydrophobicity and modulus and thus it is possible to independently tailor the mechanical properties, degradation and release. The physical properties, degradation, release, cytocompatibility and mineralization properties of the polymers were investigated towards their potential use in biomedical applications.

2. Materials and methods

2.1 Materials

The chemicals such as galactitol (98% pure), the dicarboxylic acids (adipic (99.5% pure)), suberic (98% pure) and dodecanedioic (99% pure) and solvent, N,N dimethyl formamide (N,N-DMF) were obtained from TCI chemicals (Japan), Sigma Aldrich (USA) and Merck (India) respectively.

2.2 Synthesis

The synthesis of polyesters was performed by facile one-pot melt-condensation without any catalyst. Different molar ratios of 1[thin space (1/6-em)]:[thin space (1/6-em)]1, 1[thin space (1/6-em)]:[thin space (1/6-em)]2, 1[thin space (1/6-em)]:[thin space (1/6-em)]3 were chosen for the reactions between galactitol and dicarboxylic acids of adipic, suberic and dodecanedioic. The reaction conditions were 180 °C with 2 h of mixing the monomers under nitrogen atmosphere. In all cases, the obtained yields for the prepolymers were approximately 80–90%. Further curing of polymers at 120 °C under vacuum for 72 h was performed.

2.3 Nomenclature

The names of the polyesters are designated as follows: P for polymer, G for galactitol, A for adipic acid, Su for suberic acid, D for dodecanedioic acid. The molar ratios such as 1[thin space (1/6-em)]:[thin space (1/6-em)]1, 1[thin space (1/6-em)]:[thin space (1/6-em)]2, and 1[thin space (1/6-em)]:[thin space (1/6-em)]3 are indicated as 11, 12 and 13 followed by the letters. For instance, the polyester formed by reacting galactitol and adipic acid in the ratio of 1[thin space (1/6-em)]:[thin space (1/6-em)]1 is mentioned as PGA 11. Similarly, the polyester formed by reacting galactitol and dodecanedioic acid in the ratio of 1[thin space (1/6-em)]:[thin space (1/6-em)]3 is referred as PGD 13. The plausible reaction scheme is depicted in Scheme 1 where galactitol and dicarboxylic acids were reacted to form polyesters with the elimination of water molecules.
image file: c6ra11476h-s1.tif
Scheme 1 Plausible reaction scheme for the synthesis of the polyesters in the ratio of 1[thin space (1/6-em)]:[thin space (1/6-em)]1. Red dots indicate that these –OH groups might also be involved in esterification since it is a random polymerization.

2.4 Characterization of polyesters

All characterization studies were performed only on the cured polymers unless mentioned otherwise. NMR (proton-nuclear magnetic resonance) and MALDI TOF MS (matrix-assisted laser desorption/ionization spectroscopy) were performed for the prepolymers because the cured polymers do not dissolve in solvents.
2.4.1 FTIR spectroscopy. The chemical structures of the polyesters were confirmed by performing Fourier transform infrared spectroscopy (attenuated total reflectance mode, FTIR-ATR) on the cured polymers. The range of scans was 4000 to 600 cm−1 with a resolution of 4 cm−1. An average of twelve scans was performed every time.
2.4.2 1H-NMR spectroscopy. 1H-NMR was performed on the representative polymers of PGA 13, PGSu 13, PGD 12 and PGD 13 using 400 MHz Bruker NMR Spectrometer. The prepolymers were dissolved in the deuterated solvent of DMSO. PGA 13, PGSu 13 and PGD 13 were selected since they were the highest crosslinked polyester of representative acid while PGD 12 was chosen to check for the variations among the different molar stoichiometric ratios.
2.4.3 Differential scanning calorimetry. Differential scanning calorimetry (DSC) was performed to analyze the thermal properties of the polyesters using TA instruments, Q 2000. The aluminum pans were filled with 3 to 5 mg of the polymers. Subsequently, they were made to undergo two cycles of heating and one cycle of cooling in the range of −50 to 200 °C under nitrogen flow with the ramp rate of 10 °C min−1. The second heating cycle was considered for analysis.
2.4.4 Matrix-assisted laser desorption/ionization spectroscopy (MALDI TOF MS). MALDI TOF MS was performed to find the molecular weight of the polymers (UltrafleXtreme MALDI Bruker Daltonics). The prepolymers of PGA 13, PGSu 13, PGD 11, PGD 12 and PGD 13 were dissolved in DMF/acetonitrile mixture before analysis. Polymers were selected based on the highest reacted and further crosslinked polymers and to check the differences in molecular weights between ratios.
2.4.5 Dynamic mechanical analysis. Dynamic mechanical analysis (DMA) (TA instruments, Q 800) was used to investigate the mechanical properties of the polymer. By employing a film/fiber tension clamp, the samples were subjected to 0.01 preload, isothermal frequency sweep of 0.1 to 10 Hz and 15 μm amplitude.
2.4.6 Surface water wettability. Surface water wettability was examined by measuring the contact angle using contact angle goniometer (Data Physics). 1 μL droplet was dropped on the surface of the flat polymer and allowed to attain equilibrium. Three independent measurements were noted and the data are presented in the form of mean ± standard deviation.
2.4.7 Measurement of % swelling ratio. The polymers were allowed to swell and deswell, and measurements were made for the calculation of swelling ratio. Circular polymer discs (4.5 mm × 1 mm) were punched and their weights were noted as W1. These discs were dipped in the solvent (DMF) for % sol content calculation and non-solvent (hexane) for the determination of swelling ratio for 12 h at 37 °C. Followed by considerable swelling, their wet weights (W2) were noted. The discs were left for drying (deswelling) which yielded W3. It is to be noted that W3 will be same as W1.

The swelling ratio can be given by,

 
% swelling ratio = (W2W3)/W3 × 100 (1)

2.4.8 In vitro hydrolytic degradation. The polymer discs similar to swelling studies were weighed (W0) before covering by nylon meshes. Water wash was performed at 60 °C for 2 h to facilitate the removal of the unreacted monomers. These meshes containing the discs were soaked in PBS (phosphate buffered saline) maintaining the pH of 7.4 at 37 °C. The samples were given a gentle perturbation of 100 rpm continuously in an incubator shaker. The samples were removed at fixed time intervals and was followed by drying to constant weight (Wt). It is to be noted that constant replacement of PBS was made every 24 h to avoid the pH effect. The percentage weight loss was determined by
 
% weight loss = (W0Wt)/W0 × 100 (2)
2.4.9 In vitro dye delivery studies. Dye delivery studies were performed to explore the potential of the polymer to act as a delivery vehicle. To accomplish this, two dyes belonging to a similar family (rhodamine B and rhodamine B base) as model compounds were chosen to simulate the release of bioactive compounds. The difference between the dyes is in the hydrophilicity where the rhodamine B is hydrophilic and rhodamine B base is hydrophobic. The prepolymers were dissolved in DMF. 5 wt% of the dye was then dissolved in this solution. The prepolymer–dye mixture was cured followed by punching to prepare the samples. Similar to degradation studies, the discs contained in the nylon meshes were placed in PBS and the conditions such as 37 °C, 100 rpm and pH 7.4 were maintained. PBS replenishment was performed every 24 h and the media containing dye (100 μL) was aliquoted at set time points and read at the 553 nm wavelength to determine the absorbance values. The concentrations and the cumulative release profiles of the dyes were acquired based on the calibration curves prepared using solution of known concentration.
2.4.10 Biological studies. MC3T3-E1 (mouse pre-osteoblasts, subclone 4, ATCC, USA) were employed for the evaluation of cytocompatibility. The cells belonging to twentieth passage were cultured using complete culture medium made up of α-MEM (alpha-Minimum Essential Medium, Sigma, USA) supplemented with fetal bovine serum (10% v/v, Gibco, Life technologies), 10 U mL−1 penicillin and 10 μg mL−1 streptomycin (Sigma) in an incubator where humidified atmosphere containing 5% CO2 and 37 °C conditions were maintained. Upon reaching required confluency, trypsin (0.25%) was employed in harvesting the cells.

The cells were used with the seeding density of 2000 cells and 0.2 mL media per well of 96 well plate. Required time of 12 h was provided for the cell adhesion and proliferation to take place. Meanwhile, the polymer discs (similar to degradation studies) in quadruplicates were sterilized with UV for 1 h and immersed in 5 mL media and subsequently moved to incubator with 5% CO2 and 37 °C. PGA 13, PGSu 13 and PGD 13 polymers were chosen since they were considered to be suitable for tissue engineering applications as they degraded slower. The polymers were allowed to degrade for 24 h. Later, this media (conditioned media) was added to the cells by replacing the culture media. Fresh media was added to the control wells. Followed by this, cell viability and cell morphology was assessed on day 1 and day 3.

WST assay was employed for assessing cell viability. 100 μL media and 10 μL WST reagent was added to each well and incubated for 1 h. A color change of media to yellow was noticed followed by obtaining the absorbance values at 440 nm. Cell morphology was analyzed after fixing the cells with 3.7% formaldehyde (Merck) for 15 min. Later the fixative was removed and the cells were washed with PBS before imaging the cells using a bright field microscope.

2.4.11 Mineralization studies. In vitro mineralization studies were performed to test the potential use of these polymers in bone tissue engineering. MC3T3-E1 cells were cultured on PGSu 13 and PGD 13 polymer discs in a 48 well plate. These polymers were chosen based on the optimal mechanical strength and degradation as evident from the previous studies. The cells were cultured with media similar to that for WST assay but with the additional supplements including β glycerol phosphate (10 mM) and ascorbic acid (25 μM) (Sigma) that are known to induce osteogenic differentiation as reported before.21 Calcium phosphate minerals were studied on day 7, day 14 and day 21. At these time intervals, the cells were fixed with 3.7% formaldehyde for 20 min at 37 °C. Alizarin red staining (ARS, Sigma) was used to quantify calcium deposits in quadruplicates. The filtered dye of 0.2 mL was added after removing formaldehyde and the samples were kept for 25 min in room temperature allowing the dye to bind to the calcium deposits. Later, the dye that was unbound was removed by a number of water washes till a clear transparent solution was obtained. This was followed by adding 0.2 mL 5% SDS in 0.5 HCl to the samples to dissolve the AR dye for 25 min. The absorbance values were obtained at 405 nm.

Calcium phosphate deposition was further confirmed by using EDX (energy dispersive X-ray) with SEM. Additionally, ATR-FTIR was also used to examine the mineral deposition qualitatively.


Statistical analysis. One way ANOVA was performed using Tukey's test for evaluating the differences across the samples and control. p < 0.05 were considered for differences.

3. Results and discussion

3.1 Synthesis of polymer

The synthesized prepolymers were soluble in a number of solvents such as ethanol, DMF and DMSO. NMR and MALDI TOF MS were performed only for the prepolymers since it requires the compound to be dissolved in any solvent to perform the studies. After the curing process, the polymers became insoluble. Other studies such as FTIR, DSC, DMA, contact angle, % swelling, degradation, dye release and biological studies were performed only for the cured polymers.

3.2 Polymer characterization

3.2.1 FTIR spectroscopy. The FTIR spectra obtained were similar to many of the earlier reported studies22,23 (Fig. 1a–c). A prominent peak of ester (carbonyl –C[double bond, length as m-dash]O stretching) can be observed at 1730 cm−1 in all spectra of polyesters. The peaks belonging to –OH are visible in the regions of 1410 cm−1 (bending) and 3410 cm−1 (stretching). Asymmetric and symmetric stretching of –CH can also be observed around 2960 cm−1 and 2870 cm−1. These data demonstrated that ester was formed in all cases.
image file: c6ra11476h-f1.tif
Fig. 1 FTIR spectra of (a) PGA 11, PGA 12 and PGA 13 (b) PGSu 11, PGSu 12 and PGSu 13 (c) PGD 11, PGD12 and PGD 13.
3.2.2 1H-NMR spectroscopy. 1H-NMR spectroscopy (Fig. 2a–d) further verified the FTIR data. The peaks reported matched with the previously reported similar studies.24,25 All peaks present between 3.3–5.5 ppm could be attributed to the proton groups of galactitol. The peaks present around 3.9 ppm could be attributed to protons adjacent to HO–CH2 on both sides of galactitol. The peaks around 3.6 ppm can be attributed to the rest of the other protons present. The peaks observed in the regions of 2–3 ppm could be assigned to the protons present adjacent to the –COOH groups of dicarboxylic acids (HOOC–CH2). The peaks around 1.5 ppm could be attributed towards the proton groups of –CH2 present next to the –CH2 group near carboxylic acids (HOOC–CH2–CH2). The peaks present around 1.3 ppm belongs to the next –CH2 group protons (HOOC–CH2–CH2–CH2–CH2). It is to be noted that this peak is completely absent in the case of PGA 13 (Fig. 2a) since these protons are absent in adipic acid. A decrease in integrals has been observed regarding the protons of PGD 13 (Fig. 2d) when compared to PGD 12 (Fig. 2c) which could be due to the increased involvement of acid groups in esterification process when the molar ratio of acid increases. A decrease in integrals corresponding to 1.5 ppm has also been observed in PGSu 13 (Fig. 2b) when compared to PGD 13 which clearly indicates that there is an increase in methylene groups in the case of PGD 13.
image file: c6ra11476h-f2.tif
Fig. 2 1H-NMR spectra of (a) PGA 13 (b) PGSu 13 (c) PGD 12 (d) PGD 13.
3.2.3 Differential scanning calorimetry (DSC). The thermal properties of the cured polymers were analyzed using DSC. DSC results showed that the synthesized polyesters are semi-crystalline (Table 1). It had been reported that polyesters based on sugar alcohols such as sorbitol and adipic acid were completely amorphous.26 However, galactitol based polyesters reported previously were semi-crystalline.12 These polyesters showed glass transition temperatures (Tg). Some polyesters also showed crystalline peaks (Tc). The cold crystallization temperatures (Tc) were almost similar for all polyesters in the range of 3.5–7 °C.
Table 1 Physical properties, degradation and dye release rate coefficients, kd and k of the synthesized polyesters
Polyesters Tg (°C) ± 1 °C Contact angle (°) % swelling Degradation, rate coefficient (h−1) (kd) (×10−3) RB release, k, hn (×10−3) R2 values RBB release, k, hn (×10−3) R2 values
PGA 11 25 79 ± 1 1.0 10.7 34.3 0.999 32.8 0.999
PGA 12 17 83 ± 2 0.9 6.6 30.2 0.998 20.0 0.997
PGA 13 −3 87 ± 1 0.7 3.4 12.9 0.991 7.7 0.996
PGSu 11 12.9 85 ± 2 0.7 4.9 20.2 0.995 13.2 0.999
PGSu 12 1.2 92 ± 1 0.5 1.8 10.9 0.997 10.7 0.997
PGSu 13 0.1 104 ± 2 0.3 1.3 7.8 0.997 7.3 0.997
PGD 11 10.3 93 ± 2 0.5 1.9 5.9 0.999 5.4 0.998
PGD 12 −1.7 125 ± 1 0.4 1.6 4.6 0.999 4.4 0.994
PGD 13 −2.1 129 ± 1 0.2 1.2 3.5 0.999 3.4 0.999


A steady decrease was observed in Tg with an increase in chain lengths of dicarboxylic acids (Table 1). For example, considering 1[thin space (1/6-em)]:[thin space (1/6-em)]1 ratio, the Tg of PGA 11, PGSu 11 and PGD 11 were 25 °C, 12.9 °C, 10.3 °C. This trend could be explained based on the formation of rigid networks when the number of methylene groups are lesser. Increased glass transition temperature is required to make the polymers flexible when the networks are rigid and are in closer proximity. Similar trends were obtained when mannitol was reacted with succinic, adipic and sebacic acids with systematically increasing chain lengths along with citric acid.27

Tg also decreased with increase in molar ratios of galactitol[thin space (1/6-em)]:[thin space (1/6-em)]diacids (Table 1). The Tg of PGD 11, PGD 12 and PGD 13 were 10.3 °C, −1.7 °C and −2.1 °C. Thus, with regards to varying molar ratios, the polymers become increasingly hydrophobic in nature as the number of –COOH groups increases. Previous studies reported that Tg decreases with increase in hydrophobicity.28,29 When mannitol was reacted in different molar ratios along with citric acid, a decrease in Tg was observed.27 All Tg were below physiological temperature suggesting that these polymers were rubbery at 37 °C and thus are well suited for biomedical applications.30

3.2.4 Matrix associated laser desorption/ionization (MALDI TOF MS). MALDI TOF MS indicated that the molecular weights of the prepolymers were almost similar with minor increase of molecular weight with increase in chain lengths and the molar ratios of dicarboxylic acids. The molecular weight distribution of the prepolymers are shown (see ESI, Fig. S1a–e). In a previous study, an increase in the molecular weight was observed when 1,3-propanediol was reacted with sebacic acid when compared to its reaction with adipic acid. Furthermore, in the same reaction, molecular weight also increased with increase in ratio of adipic acid and sebacic acid.31
3.2.5 Dynamic mechanical analysis (DMA). The mechanical strength of these polyesters were analyzed using DMA. The Young's modulus for these polymers were calculated from the following formula:
 
image file: c6ra11476h-t1.tif(3)
where E* is the complex modulus, E′ is the storage modulus and E′′ is the loss modulus. The complex modulus can be approximately calculated as Young's modulus.32 DMA values exhibited that the values of Young's modulus increased and tan[thin space (1/6-em)]δ values decreased with increase in chain length of dicarboxylic acids (Table 1). Previous studies suggest that the modulus increases with increase in chain lengths of the dicarboxylic acids. For instance, when glycerol was reacted with sebacic acid, the Young's modulus was 0.28 MPa33 whereas the modulus value increased to 1.08 MPa when the same glycerol was reacted with dodecanedioic acid.14 The values of Young's modulus was the highest for PGD 11 which was 127 MPa and the lowest for PGA 11 which was 0.37 MPa. The modulus of PGSu 11 was 1.34 MPa whereas PGD 12 and PGD 13 exhibited modulus values of 111 MPa and 30 MPa, respectively. The modulus value of PGD 11 was thus more than 250 times higher than that of PGA 11. Similarly, the modulus value of PGSu 11 was roughly 3.5 times higher than that of PGA 11. The tan[thin space (1/6-em)]δ values showed a steady decrease from 0.72 to 0.69 and further to 0.1 in the case of PGA 11, PGSu 11 and PGD 11 respectively indicating that the polymers were becoming increasingly elastomeric in nature with increase in chain length of dicarboxylic acids. As it was explained in an earlier section, increase in hydrophobicity imparting flexibility resulted in decrease of tan[thin space (1/6-em)]δ values. The modulus values also decreased with the increase in molar ratios of galactitol[thin space (1/6-em)]:[thin space (1/6-em)]diacid for the same reason. As evident from Table 1, the modulus values decreased from 127 MPa to 110 MPa and 29 MPa in the case of PGD 11, PGD 12 and PGD 13 respectively.

Many sugar alcohols based polyesters showed a similar Young's modulus. For example, poly (mannitol citric dicarboxylates) showed a range of modulus values ranging from 10 to 660 MPa.27 Similarly, xylitol reacted with sebacic acid in the molar ratio of 1[thin space (1/6-em)]:[thin space (1/6-em)]1 and 1[thin space (1/6-em)]:[thin space (1/6-em)]2 yielded esters that showed modulus values of 0.8 and 5.3 MPa, respectively.23 It can be concluded that changing the monomers and molar ratios yielded an array of polymers with a wide variation in mechanical properties. The Young's modulus of cancellous bone is in the range of 50 to 100 MPa (ref. 34) indicating that these polyesters are applicable in the area of bone regeneration.

3.2.6 Contact angle analysis. The surface water wettability was studied by contact angle measurement. These polyesters were overall hydrophobic in nature (Table 1). In the aspect of different chain lengths, PGA 11 showed the least contact angle of 79°. With increasing chain lengths of different dicarboxylic acids, the contact angles increased to 85° and 93° for PGSu 11 and PGD 11 respectively. With respect to the variation in molar ratio of galactitol[thin space (1/6-em)]:[thin space (1/6-em)]diacids, the contact angle increased from 93° to 129° in the case of PGD 11 and PGD 13 respectively. The increase in methylene groups when the chain length of the dicarboxylic acids increases contribute to the increased hydrophobicity of the obtained polymers.35 In addition, the reduction in –OH groups with increase in molar ratios of galactitol[thin space (1/6-em)]:[thin space (1/6-em)]diacids occur when more –OH groups involve in the reaction with –COOH groups. This will decrease the hydrophilicity of the polymers.36 Similar contact angles were obtained when erythritol was reacted with a series of dicarboxylic acids. Contact angles between 58° and 80° were reported when erythritol was reacted with adipic, suberic, sebacic and dodecanedioic acids35 that are comparable to the ones obtained from these polymers.
3.2.7 Determination of % swelling. The determination of % swelling provides information about the hydrophobicity of the polymers. Swelling increases with increase in hydrophilicity of the polymers.37,38 As illustrated in the previous sections, the hydrophobicity increases due to increase in methylene groups with increasing chain lengths of diacids. In addition, –OH groups also decrease during the increase in the molar ratio of alcohol[thin space (1/6-em)]:[thin space (1/6-em)]diacid that will contribute to the increased hydrophobicity. This will result in the decrease of % swelling of the polymers. These polyesters followed the expected trend (Table 1). With respect to different chain lengths, PGA 11 showed the highest swelling of 1% whereas the least swelling was observed for PGD 13 with 0.3%. PGSu 11 and PGD 11 showed % swelling of 0.7 and 0.5 respectively. PGA 11 showed % swelling twice that of PGD 11. In the aspect of different molar ratio of galactitol[thin space (1/6-em)]:[thin space (1/6-em)]diacids, PGD 11 showed the highest % swelling of 0.5 followed by PGD 12 and PGD 13 which showed % swelling of 0.4 and 0.2, respectively. The % swelling of PGD 11 and PGD 12 were 2.5 times and two times higher than PGD 13, respectively. Comparable % swelling of 3% was observed for poly(erythritol dodecanedioate).35

3.3 In vitro degradation by hydrolysis

The driving force behind the development of these polyesters is to have materials that degrade in a time scale that is appropriate for their usage in bone regeneration. The in vitro hydrolytic degradation of these polyesters decreased with increase in chain length of dicarboxylic acids and molar ratio of galactitol[thin space (1/6-em)]:[thin space (1/6-em)]diacids (Fig. 3). In the aspect of varying chain lengths, PGA 11 showed the highest weight loss of 80% in one week whereas PGSu 11 and PGD 11 degraded only 44% and 27% in one week, respectively. With respect to different molar ratios of galactitol[thin space (1/6-em)]:[thin space (1/6-em)]diacids, for instance, considering PGD, PGD 11 showed the highest weight loss of 27% in one week whereas only 23% and 17% weight losses were observed in the case of PGD 12 and PGD 13 in one week, respectively. This trend was similar in the case of other dicarboxylic acids such as adipic acid and suberic acids. Furthermore, it is also similar in the other molar ratios of 12 and 13. Thus, the overall trend in the scenario of different dicarboxylic acids are PGA > PGSu > PGD, respectively. With regards to varying molar ratios of galactitol[thin space (1/6-em)]:[thin space (1/6-em)]diacids, the overall results can be presented as 11 > 12> 13. For example in the case of dodecanedioic acid, the results are obtained in the following manner: PGD 11 > PGD 12 > PGD 13. This was also alike in the case of PGA and PGSu.
image file: c6ra11476h-f3.tif
Fig. 3 In vitro hydrolytic degradation profiles of different polyesters in 20 mL PBS solution (pH = 7.4). The inset shows the variation of −ln(Mt/M0) with time. (a) PGA (b) PGSu (c) PGD.

Hydrolytic degradation of these polyesters is influenced by hydrophobicity. Given the surrounding medium being hydrophilic, the fastest degrading material was PGA 11 which is the most hydrophilic polymer studied here. The slowest degrading polymer was PGD 13 which is the most hydrophobic of all polymers. These facts are also corroborated by contact angle and % swelling analysis. The presence of more methylene groups in dodecanedioic acid make the PGD polymers more hydrophobic and hence responsible for the slowest degradation.35 Similarly, the reduction of free –OH groups present in the molar ratio of 1[thin space (1/6-em)]:[thin space (1/6-em)]3 of galactitol[thin space (1/6-em)]:[thin space (1/6-em)]diacids make this ratio comparatively more hydrophobic than others as more functional groups are introduced.23 This resulted in the slowest degradation of 1[thin space (1/6-em)]:[thin space (1/6-em)]3 ratio. Based on the above reasons of hydrophobicity, the degradation followed the expected trend. When erythritol was reacted with adipic and suberic acids, the polymers exhibited 35% and 25% weight losses approximately in 3 weeks.35

The degradation rates were calculated and modeled using power law kinetics,

 
image file: c6ra11476h-t2.tif(4)

In the above equation, M indicates mass, t signifies time, kd denotes the rate coefficient corresponding to degradation and n represents the degradation order.39 First order degradation was observed in all polyesters studied. This signifies that the rate of the degradation is controlled by the concentration of esters since the amount of water is in excess. Substituting 1 for n gives a linear plot of −ln(Mt/M0) versus time in the above equation (insets of Fig. 3). kd values for all the polymers are tabulated in Table 1. They were calculated based on the initial slopes with intercept being zero.

From the kd values (Table 1), it can be inferred that the rate of PGA 11 is approximately 2.5 times and 5.5 times higher than that of PGSu 11 and PGD 11, respectively. It is also evident that PGD 11 and PGD 12 had rates 1.6 times and 1.3 times higher than that of PGD 13, respectively. The values of kd also followed a similar trend to that of degradation based on hydrophobicity. It can be illustrated that by varying the chain lengths of the dicarboxylic acids and molar ratios of galactitol[thin space (1/6-em)]:[thin space (1/6-em)]dicarboxylic acids, the rate of the degradation of the obtained polymers can be widely modulated based on the versatile applications in the field of drug delivery and tissue engineering.

3.3.1 In vitro degradation by hydrolysis in different pH. The physiological system maintains different pH milieu in different organ systems. For example, a pH of around 2 is maintained in stomach40 and an alkaline milieu of 8.4 pH is maintained in chronic wounds.41 This makes the study of degradation in different pH essential. Ester hydrolysis takes place at an accelerated rate in basic pH.42 PGA 12, PGSu 12 and PGD 12 were opted as examples to study the degradation of 3.4 and 9.4. They were selected based on the optimal degradation. These polymers degraded at a faster rate in basic media when compared to acidic media as expected (Fig. 4). In the case of PGA 12, complete degradation was observed in 48 h in pH 9.4 whereas only 13% weight loss was observed in pH 3.4. Similarly, for PGSu 12, nearly complete weight loss occurred in 48 h in the basic media whereas only 11% weight loss was observed in the acidic media. In the case of PGD 12, complete degradation occurred in 72 h in basic media but only 5% weight loss was exhibited in acidic media.
image file: c6ra11476h-f4.tif
Fig. 4 In vitro hydrolytic degradation profiles of different polyesters in 20 mL PBS solution in different pH (pH = 3.4, 9.4). The inset shows the variation of −ln(Mt/M0) with time. (a) PGA 12 (b) PGSu 12 (c) PGD 12.

Degradation at different pH also followed first order kinetics (insets of Fig. 4). The rate coefficients of PGA 12 in pH 3.4 and 9.4 were 86.2 × 10⁻³ and 2.8 × 10⁻³ h−1. Similarly, the values of kd for PGSu 12 in pH 3.4 and 9.4 were 63.3 × 10⁻³ and 2.3 × 10⁻³ h−1. kd values for PGD 12 were 43.3 × 10⁻³ and 0.7 × 10⁻³ h−1 in the pH of 3.4 and 9.4. The rate coefficients observed in pH 3.4 were roughly 30 times faster as observed for the degradation at pH 9.4.

3.4 In vitro dye release studies

Dye release data substantiated degradation data. Concomitant with the degradation of the polymers, the release of the dyes was studied (Fig. 5 and 6). Considering the scenario of different dicarboxylic acids, for 1[thin space (1/6-em)]:[thin space (1/6-em)]1 ratio, 45% of release of RB was observed for PGA 11 whereas only 27% and 7% RB release was obtained for PGSu 11 and PGD 11 in one week respectively. In the case of RBB, 47% release was observed for PGA 11. On the other hand, only 18% and 7% release was noted for PGSu 11 and PGD 11 in one week respectively. In the aspect of different molar ratios, for example, in the case of dodecanedioic acid, 7% release of RB was obtained in one week for PGD11. Whereas, only 5% and 3% release of RB was observed in one week for PGD 12 and PGD 13, respectively. Similarly, for RBB, 7%, 6% and 4% release was observed in the case of PGD 11, PGD 12 and PGD 13 in one week, respectively. Identical to the degradation studies, the trend for variation in dicarboxylic acids for both RB and RBB was PGA > PGSu > PGD. Similarly, the trend for varying molar ratios of galactitol[thin space (1/6-em)]:[thin space (1/6-em)]diacids was 11 > 12 > 13. This trend was similar for all dicarboxylic acids in the case of both RB and RBB.
image file: c6ra11476h-f5.tif
Fig. 5 In vitro release of hydrophilic RB dye from (a) PMA (b) PMS (c) PMD. The inset of all the plots show the variation of (Mt/M) with t1/2 (h1/2) and the release exponent.

image file: c6ra11476h-f6.tif
Fig. 6 In vitro release of hydrophobic RBB dye from (a) PMA (b) PMS (c) PMD. The inset of all the plots show the variation of (Mt/M) with t1/2 (h1/2) and the release exponent.

The overall trend could be ascribed to the hydrophobicity and the degradation rate of the polymers.43 As elucidated in the degradation section, the increase in chain length of the dicarboxylic acids and the increase in molar ratios of galactitol[thin space (1/6-em)]:[thin space (1/6-em)]diacids are responsible for the increase in hydrophobicity of the resulting polymers. This is the contributing factor for the slower degradation and lower dye release from the polymers.

By comparing the release between RB and RBB, predominantly, the release of RB will be faster than that of RBB. It is intuitive that the release of RBB will be slower since it is a hydrophobic dye and the surrounding medium is hydrophilic. Furthermore, the affinity of RBB towards the polymer will be higher as the polymer is hydrophobic in nature. The release of both the dyes was slower than the degradation of the polymer. Comparison between the FTIR spectra of before and after cured polymer revealed that the –COOH group of the dye reacted with the –OH group of the polymer to form esters during curing. Therefore, the rate of the dye release was slower than that of the polymer degradation. This has been observed previously in a different study.44

Korsmeyer–Peppas model was used to calculate the release rates of RB and RBB45 and is given by the following relation,

 
image file: c6ra11476h-t3.tif(5)

In the eqn (5), Mt and M denote the concentration of the dyes released at the specific time interval and the initial amount of dye loaded, t signifies time, k represents the release rate coefficient and n is the release exponent. The release exponent (n) of the Korsmeyer–Peppas model could be used to characterize different release mechanisms. n < 0.5 represents quasi-Fickian diffusion, n > 1 represents case 2 transport, n = 1 represents zero order release while n = 0.5 represents Fickian diffusion (Higuchi kinetics). The release rates of all polymers in this study for both dyes follow Higuchi kinetics with n = 0.5 (Table 1). Thus the plots of ln(Mt/M) versus ln(time) is linear with a slope of 0.5. Therefore, linear plots are obtained when Mt/M is plotted against t1/2 (h1/2), as shown in the insets of Fig. 5 and 6. The release rate constant (k) was obtained from the slope of the linear plot (Table 1). According to the k values, considering different diacids, the release of RB from PGA 11 was approximately 1.5 times and 3.5 times faster than PGSu 11 and PGD 11, respectively. Similarly, in the case of RBB, the release from PGA 11 was approximately 2.5 times and 6 times faster than that of PGSu 11 and PGD 11, respectively. In the aspect of different molar ratios, the release of RB from PGD 11 was 1.3 times and 1.7 times faster than that of PGD 12 and PGD 13, respectively. Similarly, the release of RBB from PGD 11 was 1.2 times and 1.6 times faster than that of PGD 12 and PGD 13, respectively. It can be concluded based on the k values (the release rate coefficient in Table 1) that a library of polyesters were synthesized yielding tuned release appropriate for a multitude of biomedical applications. All polyesters showed optimal release ranging from 47% to 4% in a week. For example, PGD 13 showing 4% release may befit sustained release applications. These polymers are suitable materials for synergistic applications of drug delivery apart from being employed as tissue engineering scaffolds. Further, these materials can be made bioactive by incorporating molecules that may be released over a course of time to achieve enhanced tissue regeneration.

3.5 Cytocompatibility studies

As these polyesters were developed for biomedical applications, testing the cytocompatibility of these polymers becomes a prerequisite. Because these polyesters show potential for bone regeneration, MC3T3-E1 was used. WST assay was used to evaluate the cell viability since only live cells are capable of converting tetrazolium salts to water soluble formazan crystals. Hence, the obtained absorbance values are directly proportional to the amount of live cells present. PGA 13, PGSu 13 and PGD 13 were chosen based on their slow degradation. WST assay (Fig. 7) revealed that all polymers were cyto-friendly in nature. On day 1, the cells were well attached on all polymers. On day 3, the absorbance values increased from day 1 to day 3 indicating that the cells have proliferated. These results state that these polymers are non-toxic in nature and hence may prove to be appropriate materials for biomedical applications.
image file: c6ra11476h-f7.tif
Fig. 7 Cell viability of various polyesters determined by WST assay for day 1 and day 3. * above the bars indicate that the samples are statistically significant when compared to control.

Analyzing cell morphology is essential since reports suggest that the cell morphology is directly correlated with cell function.46 Optical micrographs (Fig. 8a and b) displayed that the cells of both the samples and control displayed their characteristic “spindle shaped morphology” upon exposure to media containing degradation products. This suggests that the degradation products pose no toxic effects and did not affect the morphology or viability of cells. The cells appeared to be healthy, adhered, well proliferated and spread. Therefore, it is logical to conclude that these materials can be used for tissue engineering in vivo.


image file: c6ra11476h-f8.tif
Fig. 8 Optical micrographs of MC3T3 E1 cells on the surface of the TCPS treated with (a) with fresh media at 10× magnification (b) media containing the degradation products of PGD 13 at 10× magnification. Scale bar indicates 20 μm.

3.6 Osteogenic differentiation studies

The capability of these polymers to direct the cells towards osteogenic lineage was evaluated by studying the mineralization (calcium phosphate deposition). The mineral deposits were quantified by ARS staining (Fig. 9). It was proven from ARS staining that cells cultured on PGSu 13 showed more calcium deposition. The absorbance values increased from 0.3 to 0.5 from day 7 to day 21 in the case of PGSu 13. In the case of PGD 13, the calcium deposition was comparably lower which was 0.2 to 0.3 from day 7 to day 21. Statistically significant differences were observed between PGSu 13 and PGD 13 only on day 21. Despite the lower deposition of calcium, the absorbance values increased from day 7 to day 21 signifying that both the polymers showed positive response for osteogenic differentiation.
image file: c6ra11476h-f9.tif
Fig. 9 Quantification of mineral deposition on PGSu 13 and PGD 13 surfaces at day 7, day 14 and day 21. * above the bars indicate that the samples are statistically significant when compared to each other.

SEM micrographs showed that the morphology of the cells were round that could be attributed towards the hydrophobicity of the polymer surface47 (Fig. 10a and c). Despite the round morphology, it is note-worthy mentioning that the cell viability and proliferation remained unaffected suggesting that these are the promising candidates for bone regeneration. The number of cells were higher on PGSu 13 when compared to PGD 13. The presence of calcium and phosphate was confirmed and quantified based on EDS analysis (Fig. 10b and d). Higher calcium deposits were found in PGSu 13 whereas both calcium and phosphate deposition was seen only on PGD 13.


image file: c6ra11476h-f10.tif
Fig. 10 SEM micrographs coupled with EDS spectra of mineral deposited polymer discs (a) SEM micrograph of PGSu 13 (b) EDS spectra of PGSu 13 (c) SEM spectra of PGD 13 (d) EDS spectra of PGD 13 (magnification = 1.24k×, scale bar = 20 μm).

The phosphate deposition was additionally supported by FTIR analysis on PGD 13 (Fig. 11). The presence of 1344 cm−1 and 1052 cm−1 correspond to P[double bond, length as m-dash]O (phosphate bond) stretching.


image file: c6ra11476h-f11.tif
Fig. 11 FTIR spectra of the mineralized PGD 13.

4. Summary and conclusions

A spectrum of polymers were synthesized based on galactitol and dicarboxylic acids by modifying the monomers and their molar stoichiometric ratios. As a result, a family of tailored polymers exhibiting variations in mechanical properties, degradation and release profiles were obtained. These polymers can be utilized for various biomedical applications depending on the specific need. For example, PGD 12 possesses a modulus of 110 MPa but displays a weight loss of 23% in a week. Similarly, PGD 13 also degrades 19% in a week which is closer to PGD 12 but showed a lower modulus of 29 MPa. It can be seen that an individual property (mechanical) can be tuned without influencing other properties (degradation). Other polymers such as PGS 11 which showed a weight loss of 44% and modulus of approximately 1 MPa can find applications in soft tissue engineering such as blood vessels, cartilage etc.48 The degradation rate followed first order while the dye release followed Higuchi kinetics based on Fick's diffusion. The profiles for all polymers were widely heterogeneous. A systematic variation explains that PGSu 13 and PGD 13 showed favorable degradation, optimal modulus and high osteogenic differentiation properties. Although this strategy is applied for this study, this can be leveraged for many polymeric systems to obtain materials befitting specific biomedical applications.

Acknowledgements

This work was funded by the Department of Biotechnology (DBT), India (BT/PR5977/MED/32/242/2012). K. C. is grateful for Ramanujan fellowship from the Department of Science and Technology (DST), India. G. M. acknowledges J. C. Bose fellowship from DST. We acknowledge Ms Queeny Dasgupta for DSC and DMA analysis. We thank Mr Shubham Jain and Dr Jafar Hasan for technical assistance regarding cell studies. We also thank NMR Research Centre, IISc for access to research facilities.

References

  1. T. H. Qazi, D. J. Mooney, M. Pumberger, S. Geißler and G. N. Duda, Biomaterials, 2015, 53, 502–521 CrossRef CAS PubMed.
  2. M. M. Stevens, Mater. Today, 2008, 11, 18–25 CrossRef.
  3. N. Ajellal, C. M. Thomas, T. Aubry, Y. Grohens and J.-F. Carpentier, New J. Chem., 2011, 35, 876–880 RSC.
  4. E. S. Place, J. H. George, C. K. Williams and M. M. Stevens, Chem. Soc. Rev., 2009, 38, 1139–1151 RSC.
  5. C. Vilela, A. F. Sousa, A. C. Fonseca, A. C. Serra, J. F. Coelho, C. S. Freire and A. J. Silvestre, Polym. Chem., 2014, 5, 3119–3141 RSC.
  6. K. Narendran and R. Nanthini, New J. Chem., 2015, 39, 4948–4956 RSC.
  7. N. Killi, V. L. Paul and R. V. N. Gundloori, New J. Chem., 2015, 39, 4464–4470 RSC.
  8. Y. Wang, Y. M. Kim and R. Langer, J. Biomed. Mater. Res., Part A, 2003, 66, 192–197 CrossRef PubMed.
  9. A. El-Hadi, R. Schnabel, E. Straube, G. Müller and S. Henning, Polym. Test., 2002, 21, 665–674 CrossRef CAS.
  10. S. Even-Ram, V. Artym and K. M. Yamada, Cell, 2006, 126, 645–647 CrossRef CAS PubMed.
  11. J. P. Bruggeman, B.-J. de Bruin, C. J. Bettinger and R. Langer, Biomaterials, 2008, 29, 4726–4735 CrossRef CAS PubMed.
  12. F. Zamora, K. Hakkou, A. Alla, M. Rivas, I. Roffé, M. Mancera, S. Muñoz-Guerra and J. A. Galbis, J. Polym. Sci., Part A: Polym. Chem., 2005, 43, 4570–4577 CrossRef CAS.
  13. J. Heller, Adv. Drug Delivery Rev., 2005, 57, 2053–2062 CrossRef CAS PubMed.
  14. F. Migneco, Y.-C. Huang, R. K. Birla and S. J. Hollister, Biomaterials, 2009, 30, 6479–6484 CrossRef CAS PubMed.
  15. A. Domb and R. Langer, J. Polym. Sci., Part A: Polym. Chem., 1987, 25, 3373–3386 CrossRef CAS.
  16. T. Zhang, B. A. Howell, A. Dumitrascu, S. J. Martin and P. B. Smith, Polymer, 2014, 55, 5065–5072 CrossRef CAS.
  17. K. Whitaker-Brothers and K. Uhrich, J. Biomed. Mater. Res., Part A, 2006, 76, 470–479 CrossRef PubMed.
  18. A. Rodríguez-Galán, L. Fuentes and J. Puiggalí, Polymer, 2000, 41, 5967–5970 CrossRef.
  19. M. E. Ensminger and A. H. Ensminger, Foods & Nutrition Encyclopedia, Two Volume Set, CRC Press, Boca Raton, Florida, 1993 Search PubMed.
  20. G. Mingrone, L. Castagneto-Gissey and K. Macé, Br. J. Clin. Pharmacol., 2013, 75, 671–676 CrossRef CAS PubMed.
  21. S. Kumar, S. Raj, E. Kolanthai, A. K. Sood, S. Sampath and K. Chatterjee, ACS Appl. Mater. Interfaces, 2015, 7, 3237–3252 Search PubMed.
  22. J. Coates, Encyclopedia of analytical chemistry, John Wiley & Sons, Chichester, 2000 Search PubMed.
  23. J. P. Bruggeman, C. J. Bettinger, C. L. Nijst, D. S. Kohane and R. Langer, Adv. Mater., 2008, 20, 1922–1927 CrossRef CAS.
  24. N. E. Jacobsen, NMR spectroscopy explained: simplified theory, applications and examples for organic chemistry and structural biology, John Wiley & Sons, Hoboken, New Jersey, 2007 Search PubMed.
  25. G. Barbiroli, C. Lorenzetti, C. Berti, M. Fiorini and P. Manaresi, Eur. Polym. J., 2003, 39, 655–661 CrossRef CAS.
  26. H. Fu, A. S. Kulshrestha, W. Gao, R. A. Gross, M. Baiardo and M. Scandola, Macromolecules, 2003, 36, 9804–9808 CrossRef CAS.
  27. S. Pasupuleti, A. Avadanam and G. Madras, Polym. Eng. Sci., 2011, 51, 2035–2043 Search PubMed.
  28. R. Rai, M. Tallawi, A. Grigore and A. R. Boccaccini, Prog. Polym. Sci., 2012, 37, 1051–1078 CrossRef CAS.
  29. O. Prucker, S. Christian, H. Bock, J. Rühe, C. W. Frank and W. Knoll, Macromol. Chem. Phys., 1998, 199, 1435–1444 CrossRef CAS.
  30. R. Yoda, J. Biomater. Sci., Polym. Ed., 1998, 9, 561–626 CrossRef PubMed.
  31. U. Witt, R.-J. Müller and W.-D. Deckwer, J. Environ. Polym. Degrad., 1995, 3, 215–223 CrossRef.
  32. D. Montalvão, R. Cláudio, A. Ribeiro and J. Duarte-Silva, Compos. Struct., 2013, 97, 91–98 CrossRef.
  33. Y. Wang, G. A. Ameer, B. J. Sheppard and R. Langer, Nat. Biotechnol., 2002, 20, 602–606 CrossRef CAS PubMed.
  34. K. S. Anseth, V. R. Shastri and R. Langer, Nat. Biotechnol., 1999, 17, 156–159 CrossRef PubMed.
  35. D. G. Barrett, W. Luo and M. N. Yousaf, Polym. Chem., 2010, 1, 296–302 RSC.
  36. D. L. Schmidt, R. F. Brady, K. Lam, D. C. Schmidt and M. K. Chaudhury, Langmuir, 2004, 20, 2830–2836 CrossRef CAS PubMed.
  37. J. Kim, K.-W. Lee, T. E. Hefferan, B. L. Currier, M. J. Yaszemski and L. Lu, Biomacromolecules, 2007, 9, 149–157 CrossRef PubMed.
  38. D. Dakshinamoorthy, A. K. Weinstock, K. Damodaran, D. F. Iwig and R. T. Mathers, ChemSusChem, 2014, 7, 2923–2929 CrossRef PubMed.
  39. J. Natarajan, S. Rattan, U. Singh, G. Madras and K. Chatterjee, Ind. Eng. Chem. Res., 2014, 53, 7891–7901 CrossRef CAS.
  40. W. Hong, W. Jiao, J. Hu, J. Zhang, C. Liu, X. Fu, D. Shen, B. Xia and Z. Chang, J. Biol. Chem., 2005, 280, 27029–27034 CrossRef CAS PubMed.
  41. L. A. Schneider, A. Korber, S. Grabbe and J. Dissemond, Arch. Dermatol. Res., 2007, 298, 413–420 CrossRef PubMed.
  42. L. Erdmann and K. Uhrich, Biomaterials, 2000, 21, 1941–1946 CrossRef CAS PubMed.
  43. K. S. Soppimath, T. M. Aminabhavi, A. R. Kulkarni and W. E. Rudzinski, J. Controlled Release, 2001, 70, 1–20 CrossRef CAS PubMed.
  44. J. Natarajan, G. Madras and K. Chatterjee, RSC Adv., 2016, 6, 40539–40551 RSC.
  45. P. Costa and J. M. Sousa Lobo, Eur. J. Pharm. Sci., 2001, 13, 123–133 CrossRef CAS PubMed.
  46. J. V. Shah, J. Cell Biol., 2010, 191, 233–236 CrossRef CAS PubMed.
  47. J. Wei, T. Igarashi, N. Okumori, T. Igarashi, T. Maetani, B. Liu and M. Yoshinari, Biomed. Mater., 2009, 4, 045002 CrossRef PubMed.
  48. B. Amsden, Soft Matter, 2007, 3, 1335–1348 RSC.

Footnote

Electronic supplementary information (ESI) available: MALDI TOF MS spectra of prepolymers available. See DOI: 10.1039/c6ra11476h

This journal is © The Royal Society of Chemistry 2016