Deprotonation routes of anthocyanidins in aqueous solution, pKa values, and speciation under physiological conditions

Jorge Rafael León-Carmonaa, Annia Galano*b and Juan Raúl Alvarez-Idaboy*a
aFacultad de Química, Departamento de Física y Química Teórica, Universidad Nacional Autónoma de México, México DF 04510, Mexico. E-mail: jidaboy@unam.mx
bDepartamento de Química, Universidad Autónoma Metropolitana-Iztapalapa, San Rafael Atlixco 186, Col. Vicentina. Iztapalapa, C. P. 09340, México D. F, Mexico. E-mail: agal@xanum.uam.mx

Received 27th April 2016 , Accepted 26th May 2016

First published on 27th May 2016


Abstract

Anthocyanidins are water-soluble flavonoids that have numerous beneficial effects to human and animal health. At the same time, they present multiple acid–base equilibria that under physiological conditions may lead to a rather wide distribution of species. This particular feature might influence the activity and mechanism of action of anthocyanidins in living systems, depending on the pH of the environment. Therefore, detailed knowledge of the acid–base behavior of these compounds is crucial to fully understand their ways of action. In this work, theoretical calculations within the frame of Density Functional Theory (DFT) were carried out to investigate several aspects or the equilibria for 12 anthocyanidins. Their most likely deprotonation routes were elucidated, and most of their pKa values are reported here for the first time. Their reliability was confirmed by comparison with the available experimental data, which led to a mean unsigned error of 0.31. The obtained pKa values allowed the estimation of the populations of the different species depending on the pH, and particular attention was paid to pH = 7.4. Hopefully, the data provided here may contribute to gain better understanding on the complex processes involving anthocyanidins, under physiological conditions.

Introduction

Anthocyanidins (Scheme 1) are water-soluble pigments that belong to the flavonoid family and constitute the aglycon counterparts of anthocyanins. Both, anthocyanins and anthocyanidins, are widely distributed in the plant kingdom, and are frequently responsible for the bright colors of fruits, flowers and vegetables. The most distinctive structural feature of this kind of flavonoid is the presence of flavylium ions, while they mainly differ in the number and position of the OH groups. There are at least 23 naturally occurring anthocyanidins identified so far,1 with cyanidin (Cyn), pelargonidin (Plg), peonidin (Pnd), delphinidin (Dlp), petunidin (Ptn) and malvidin (Mlv), the most common ones.
image file: c6ra10818k-s1.tif
Scheme 1 General structure of anthocyanidins.

There is abundant evidence on the beneficial effects of anthocyanidins. For example, they have been found to be effective for protecting against the genotoxic damage induced by some chemotherapeutic drugs,2 for preventing bone loss in post-menopausal osteoporosis,3 and for inhibiting angiogenesis.4 Anthocyanidins also offer protection against cardiovascular diseases,5–8 light-induced retinal damage9,10 and ultraviolet induced DNA damage.11 In addition, they also have anticarcinogenic12,13 and antioxidant1,14–16 effects.

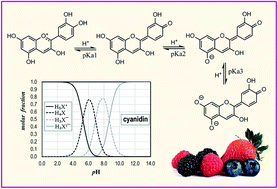
At the same time, they present various hydroxyl groups in their structure, which are susceptible to deprotonation in aqueous solution, depending on the pH. The corresponding acid-dissociation constants (Ka) characterize the acidity of these compounds, which influence their chemical behavior. The Ka values – usually reported as pKa – are related to numerous properties of drugs and nutrients, such as solubility and rate of absorption.17 In addition, for compounds with more than one acid site, different deprotonation routes are possible. Let us use cyanidin (R3 = R5 = R7 = R′3 = R′4 = OH) to illustrate this point. Formally it can have up to 5 acid-dissociation equilibria, i.e., up to 5 pKa, one per each phenolic OH:

image file: c6ra10818k-t1.tif

However, while species H5Cyn+ and Cyn4− are unambiguous, there are – in principle – 5, 10, 10, and 5 possible different species for H4Cyn, H3Cyn, H2Cyn2−, H3Cyn, respectively, depending on which sites are deprotonated. Thus, elucidating which of them are the most likely ones becomes a crucial task in order to identify the dominant species at each pH of interest.

Such speciation may influence, at least, some of the beneficial effects attributed to polyphenols. For example, there are previous reports indicating that the chromatic properties18 and antioxidant activity19,20 of these compounds may change depending on the dominant acid–base species. In the particular case of the antioxidant activity, this would affect not only the extension of the activity but also the main reaction mechanisms contributing to it. In addition, to our best knowledge the information gathered so far on the pKa values of anthocyanidins is still limited (Table 1). It comprises the first pKa values of 5 anthocyanidins that were experimentally obtained from absorption spectra, and the theoretical estimation of the second pKa values for the same compounds. These estimations were made using a quantitative structure activity relationship that relates the experimental pKa values of the OH groups in hydroxyflavones to the theoretically calculated deprotonation energies.21

Table 1 Previously reported pKa values of anthocyanidins studied19
Anthocyanidins pKa1a pKa2b
a Experimental values.b Estimated using a quantitative structure activity relationship.
Cyanidin 5.48 6.39
Delphinidin 5.30 6.30
Malvinidin 6.02 7.40
Pelargonidin 5.79 7.05
Peonidin 5.93 7.37


Accordingly, the main goals of the present work are: (i) to identify the most like species for the first three deprotonations of a large series of anthocyanidins, and (ii) estimate their pKa1, pKa2, and pKa3 values. Subsequent deprotonations were not included in this investigation, because they are assumed to be unimportant under physiological conditions. Thus, the results provided here are expected to contribute to a better characterization of the investigated compounds under such conditions, and hopefully to interpret their experimental behavior.

Computational details

All the electronic calculations were performed with Gaussian 09 package of programs.22 Geometry optimizations and frequency calculations have been carried out using the M05-2X functional23 and the 6-311++G(d,p) basis set, in conjunction with the SMD continuum model24 using water as solvent to mimic the aqueous environment. Local minima were identified by the absence of imaginary frequencies.

Deprotonation routes

Thermodynamic corrections at 298.15 K were included in the calculation of relative energies, which have been computed for the 1 M standard state. To identify the most likely deprotonation routes, we started by investigating which first deprotonation has the lowest energy cost. Based on this information the most likely structure for H4Cyn is proposed. Using this structure as a starting point, the second deprotonation is analyzed in a similar manner to identify H3Cyn, and from this species the third deprotonation is investigated. This strategy allowed to reduce the number of possible structures. For example, for H3Cyn and H2Cyn2− instead of 10 there are 4 and 3, respectively. Computational protocols have been previously used to successfully elucidate deprotonation routes of chemical compounds with multiple acid sites.25–30

pKa calculations

Three pKa calculation strategies were evaluated in the present work, using the available experimental data (Table 1) as reference values. The first one is the isodesmic method, also known as the proton exchange method, or the relative method.31 It is based on the following reaction scheme:
HA + Ref ⇌ A + HRef
with HRef/Ref being an acid/base pair of a reference compound. Then the pKa can be calculated as:
 
image file: c6ra10818k-t2.tif(1)

The isodesmic method has been previously recommended to predict reliable pKa values for phenolic deprotonations of relative large systems,32 and has been successfully used to that purpose.33,34 It has been effective not only for estimating pKas of pure organic molecules, but also for metal containing systems.35 Further details on pKa calculations using the isodesmic method, and continuum model solvents, can be found elsewhere.36,37

The second strategy for calculating the anthocyanidins pKa was the direct scheme:

HA ⇌ A + H+

This was done because it is the most frequently used, probably due to its simplicity. One of the disadvantage of this scheme is that it involves the proton. It is known that computational methods poorly reproduce the solvation energies of this particular species. Therefore, the ΔGg(H+) and ΔGsolv(H+) values used to calculate the Gibbs free energy of the deprotonation reactions are derived from experiments. However, the variations on the reported experimental values of the solvation free energy of the proton are rather large, with values ranging from −259 to −266 kcal mol−1.36 Such a variation is an important source of error in the calculated pKas, i.e. it alone represents about 3 pKa units. In this work we have used ΔGg(H+) = −4.39 kcal mol−1 and ΔGsolv(H+) = −265.89 kcal mol−1, based on the recommendation of Camaioni and Schwerdtfeger.38 In this case the pKa is calculated as:

 
image file: c6ra10818k-t3.tif(2)

The third strategy was previously proposed to avoid using the experimental data of the proton.39,40 Here it is referred to as the parameters fitting method. It consist of using the experimental pKa values of a set of small reference molecules to obtain two empirical parameters (k and C0) by fitting the following linear equation, that is derived from eqn (2):

 
pKaexp = kΔGBA + C0 (3)
where ΔGBA is the difference in Gibbs energy between the conjugated base and the corresponding acid (Gcalc(A−)Gcalc(HA)), calculated at the same level of theory than the investigated molecules, here M05-2X/6-311++G(d,p) and SMD (solvent = water). The reference set is chosen based on the kind of acid chemical group involved, in our case phenols (Table 1S, ESI). After obtaining parameters k and C0, they are used to calculate the pKa of the molecule of interest. Their values in this work are k = 0.298 and C0 = −76.22, with R2 = 0.973. Similar strategies have been successfully used to estimate pKa values of other compounds,28,41–45 and after identify the calculation strategy in best agreement with the experimental data, it was used to estimate the pKa values of the studied anthocyanidins that have not been previously reported.

Results and discussion

The structural features of the 12 anthocyanidins studied in this work are shown in Table 2. In addition to the six most frequently found in nature, another six were also considered including some methoxylated anthocyanidins and two 6-hydroxylated anthocyanidins. The molecules in the set differ not only in the number of phenolic OH, but also on the hydroxylated sites. This variety is expected to allow a detailed analysis on the influence of structural features on the acidity and deprotonation order of anthocyanidins.
Table 2 Anthocyanidins studied in this work, for all of them R′4 = OH. The site labels corresponds to those shown in Scheme 1
Anthocyanidin Acronym R′3 R′5 R3 R5 R6 R7
Aurantinidin Arn H H OH OH OH OH
Capensinidin Cpn OH OCH3 OH OCH3 H OCH3
Cyanidin Cyn OH H OH OH H OH
Delphinidin Dlp OH OH OH OH H OH
Europinidin Erp OCH3 OH OH OCH3 H OH
Luteolinidin Ltl OH H H OH H OH
Malvidin Mlv OCH3 OCH3 OH OH H OH
Pelargonidin Plg H H OH OH H OH
Peonidin Pnd OCH3 H OH OH H OH
Petunidin Ptn OH OCH3 OH OH H OH
Rosinidin Rsn OCH3 H OH OH H OCH3
6OH-delphinidin 6Dlp OH OH OH OH OH OH


Deprotonation routes

Different deprotonation steps, up to three, were included for the studied anthocyanidins since they all have at least 3 acid sites. The acid dissociation equilibria were analyzed in the same order that they would follow in actual systems, as the pH increases. All the hydroxyl groups, at each deprotonation degree, were considered as potential acid sites. The relative Gibbs energies for the first deprotonations are shown in Table 2S, ESI. To facilitate comparisons, the lowest energy for each anthocyanidin was set to zero and the other values in the table are reported with respect to them. It was found that the first deprotonation can involve rings A or B, depending on the particular anthocyanidin and the groups in each ring. The most acidic site is R′4 for Cyn, Dlp, Erp, Ltl, and Rsn; R5 for Mlv and Ptn; and R7 for Arn, Cpn, Plg, Pnd and 6Dlp. In general, within each anthocyanidin, the larger the number of OH groups next to an acid site, the easier the deprotonation from that site. In addition, analyzing compound 6Dlp – which presents pyrogallol-like structures in rings A and B – it seems that when similar groups are in the vicinity of the acid sites, deprotonation from ring A requires lower energy, albeit the difference is small.

The relative energies corresponding to the subsequent second and third deprotonation are provided in Tables 3S and 4S (ESI), respectively. For those anthocyanidins with the first deprotonation taking place from ring A the second one is most likely to involve ring B, while for those anthocyanidins first deprotonated from ring B the second one takes place from rings A or C. For both, the second and the third deprotonation, a common feature is that the most likely deprotonation site is never next to a site already deprotonated in a previous acid–base equilibria.

For the three investigated acid–base equilibria there are some cases for which the relative deprotonation energies associated with more than one acid site are lower than 1 kcal mol−1. Accordingly, in addition to the main deprotonation product, other species might be present to a non-negligible extent. The percent population, per site, of each possible conjugated base yield by the 3 first deprotonation reactions of each investigated anthocyanidin (H4A, H3A and H2A2− for the first, second, and third deprotonation respectively) was estimated using the Maxwell–Boltzmann distribution (Fig. 1).


image file: c6ra10818k-f1.tif
Fig. 1 Percent population, per site, of the deprotonated forms (H4A for the first deprotonation, H3A for the second deprotonation, and H2A2− for the third deprotonation).

The first deprotonation yield mainly one conjugated base for Arn, Cpn, Cyn, Dlp, Erp, Mlv and Ptn, while more than one H4A may be present in significant amounts for Ltl, Plg, Pnd, Rsn and 6Dlp. For the second deprotonation Cyn, Erp, Mlv, Plg, Ptn and 6Dlp yield mainly one H3A, while Arn, Cpn, Dlp, Ltl, Pnd and Psn tautomeric equilibria involving more than one conjugated base are expected. The third deprotonations yielding mainly one product are those involving Cpn, Erp, Ltl and Rsn; while for Arn, Cyn, Dlp, Mlv, Plg, Pnd, Ptn, and 6Dlp more than one H2A2− may coexist. Therefore the deprotonation routes (Schemes 2 and 3) proposed here correspond to the main pathways, but it should be kept in mind that other routes might also contribute – to a minor extent – to the acid base equilibria of the studied anthocyanidins.


image file: c6ra10818k-s2.tif
Scheme 2 Main deprotonation routes for the studied anthocyanidins most frequently found in nature.

image file: c6ra10818k-s3.tif
Scheme 3 Main deprotonation routes for the studied anthocyanidins that are not among the most frequently found in nature.

pKa calculations

For the anthocyanidins investigated in this work, there are only 5 experimental pKa values previously reported (Table 1). They have been used to assess the accuracy of three calculating strategies, namely (i) the isodesmic method, (ii) the direct method, and (iii) the fitting parameters method. The pKa values calculated using these methods are reported in Table 3. For the isodesmic method to be reliable there are two key factors to keep in mind. HRef should be structurally similar to the system of interest, and its experimental pKa should be known. Therefore Cyn has been chosen as HRef here.
Table 3 Calculated pKa values using the isodesmic (i), direct (ii) and fitting parameters (iii) methods for anthocyanidins with known experimental pKa1 values
  Calc.(i) Calc.(ii) Calc.(iii)
Cyn   4.74 5.28
Dlp 6.23 4.10 4.97
Mlv 5.70 4.59 5.19
Plg 4.22 5.82 5.78
Pnd 4.36 5.70 5.73


The mean unsigned errors (MUE) and the maximum absolute error (MAE) obtained with the used strategies are shown in Fig. 2. The best agreement with the experimental data was found for the fitting parameters method (iii), with MUE = 0.31 and MAE = 0.83 pKa units, which are significantly lower than those obtained for the direct (MUE = 0.73, MAE = 1.43) and the isodesmic strategies (MUE = 1.10, MAE = 1.57). The performance of the fitting parameters method (using SMD, this work) is consistent with that previously found for other charged acids when using PCM and the Pauling cavity.45 It should be noted, though, that UFF and UAKS cavities were reported to lead to larger errors.


image file: c6ra10818k-f2.tif
Fig. 2 Mean unsigned errors (MUE) and maximum absolute errors (MAE) for the three tested pKa calculation strategies, i.e., isodesmic (i), direct (ii) and fitting parameters (iii).

According to the above discussed results, the fitting parameters method has been chosen to estimate the first pKa values of the rest of the investigated anthocyanidins, as well as for the calculation of the second and third pKa values of the whole set. In addition, it seems important to call attention to the fact that pKa calculations still represent a challenging task. In fact, it has been proposed that methodologies yielding MUE ∼ 2 can be considered as reasonably accurate.36 Thus, the agreement with the experimental data obtained here, when using the fitting parameters method, is actually very good.

However, since the validation of this method was tested only for first pKas, because they are the only ones already estimated using experimental techniques for anthocyanidins, an additional test was performed. It consisted on testing the reliability of the fitting parameters method for other polyphenols (quercetin and kaempferol) for which there is experimental data available on their first, second and third pKas. In fact, there are several values of pKa1, pKa2 and pKa3 previously reported for these compounds, thus here we use the average values as references (Table 5S, ESI).

It is important to note that regarding the charge of the acid–base species pKa1 and pKa2 of quercetin and kaempferol are the most similar ones to pKa2 and pKa3 of anthocyanidins, i.e., in the first case the acid is neutral and the conjugated base is mono-anionic, and in the second case the acid is mono-anionic and the conjugated base is di-anionic. The agreement of the data calculated using the fitting parameters method with the experimental values of quercetin and kaempferol – considering pKa1, pKa2, and pKa3 altogether – was found to be good with MUE = 0.54 and MAE = 0.85. Therefore, it is expected that the fitting parameters method would be reliable for predicted not only the first pKas of anthocyanidins but also the second and the third ones. In addition, the values of the second pKas calculated here are in good agreement with those previously estimated using a quantitative structure activity relationship.19

The values of pKa1, pKa2 and pKa3 proposed here, using the fitting parameters method, for the whole set of investigated anthocyanidins are reported in Table 4. The first pKa ranges from 4.75 to 6.19, with the lowest value corresponding to Arn and the largest to Rsn. The acidity, corresponding to the first deprotonation, decreases in the following order: Arn, 6Dlp, Dlp, Mlv, Cyn, Ptn, Cpn, Erp, Ltl, Pnd, Plg, Rsn. The three first present the pyrogallol moiety, which seems to increase the acidity of the investigated compounds, especially when it is in the A ring. In general, the larger the number of OH groups, and the lower the number of OCH3 substituents, the most acid the compound. In addition, the presence of an OH group at site R3 decreases the acidity of the anthocyanidins that first deprotonate from ring A.

Table 4 Proposed pKa1, pKa2 and pKa3 values for the studied anthocyanidins
  pKa1 pKa2 pKa3
Arn 4.75 7.83 8.59
Cpn 5.50 7.83 8.40
Cyn 5.28 6.91 8.67
Dlp 4.97 6.81 8.08
Erp 5.64 7.35 8.44
Ltl 5.69 6.92 8.31
Mlv 5.19 7.26 8.73
Plg 5.79 7.20 8.91
Pnd 5.73 7.53 8.51
Ptn 5.38 6.99 8.27
Rsn 6.19 7.74 7.88
6Dlp 4.89 6.27 8.11


The second pKa for the set of investigated anthocyanidins ranges from 6.27 (Dlp) to 7.83 (Arn ≈ Cpn), while the third one ranges from 7.88 (Rsn) to 8.91 (Plg). The second pKa increases according to 6Dlp, Dlp, Cyn, Ltl, Ptn, Plg, Mlv, Erp, Pnd, Rsn, Cpn, Arn. Again the molecule that after the first deprotonation still has the pyrogallol moiety is the one that deprotonates the easiest in the second acid–base equilibria. For the third pKa, the acidity in decreasing order is: Rsn, Dlp, 6Dlp, Ptn, Ltl, Cpn, Erp, Pnd, Arn, Cyn, Mlv, Plg.

Using the pKa values estimated here, the distribution diagrams of the investigated anthocyanidins were constructed in the 0 to 14 interval of pH (Fig. 3). The values of the molar fractions at physiological pH (pH = 7.4) are reported in Table 5, since this pH is particularly important in biological systems. Protonated anthocyanidins (H5A+) are only the dominant species at acid pHs. However, their molar fractions rapidly decreases at pH ≥ 4, thus their biological importance in most of the human body regions, with the exception of the stomach, is expected to be negligible. The most deprotonated species considered in this work (H2A2−) are only the main ones at basic pHs (higher than 8.5–9.0), but contrary to H5A+ they can be present to a non-negligible extent at pHs significant for biological processes.


image file: c6ra10818k-f3.tif
Fig. 3 Distribution diagrams of the investigated anthocyanidins, including the species H5A+ (solid black lines), H4A (dotted black lines), H3A (dotted gray lines), and H2A2− (solid gray lines).
Table 5 Molar fractions of H5A+, H4A, H3A, and H2A2− at physiological pH (pH = 7.4) for the whole set of investigated anthocyanidins
  H2A2− H3A H4A H5A+
Arn 0.017 0.266 0.715 0.002
Cpn 0.026 0.262 0.702 0.009
Cyn 0.039 0.726 0.233 0.002
Dlp 0.142 0.682 0.175 0.001
Erp 0.046 0.500 0.447 0.008
Ltl 0.084 0.687 0.225 0.004
Mlv 0.026 0.561 0.410 0.003
Plg 0.018 0.595 0.377 0.009
Pnd 0.032 0.406 0.550 0.012
Ptn 0.089 0.655 0.254 0.002
Rsn 0.091 0.272 0.600 0.037
6Dlp 0.153 0.789 0.058 0.000


At pH values in the vicinity of the physiological one, there is more than one acid–base species with significant population for all the investigated anthocyanidins. The most significant cases in this context are Mlv and Pnd for which it is expected that H4A and H3A would be present in similar amounts at pH = 7.4. For Cyn, Dlp, Ltl, Plg, Ptn and 6Dlp the main species is predicted to be H3A with populations ranging from 60 to 80%; while for Arn, Cpn and Rsn H4A is the most abundant one. The dianion (H2A2−) is predicted to be in amounts larger than 5%, at this pH, for Dlp, Ltl, Ptn, Rsn and 6Dlp.

In addition, it should be pointed out that sometimes species existing in rather low molar fractions are responsible for some biological activities. One example is the free radical scavenging activity of resveratrol and piceatannol.33 This is a dramatic example where albeit the molar fraction of anionic resveratrol is as low as 0.017 at physiological pH, it is still responsible for almost the whole protection against peroxyl radicals exerted by this antioxidant in water solution at this pH. In the case of the anthocyanidins investigated here, the lowest molar fraction found is also 0.017 (Table 5). Accordingly, the possible role of the H2A2− species in biological processes, such as the antioxidant protection, cannot be ruled out just yet.

The estimated values of the molar fractions indicate that several acid base species should be considered regarding the potential biological roles of anthocyanidins. Moreover, the rather wide distribution of acid–base species predicted for this family of compounds suggests that their mechanism of action, for example as antioxidants, should be complex and influenced by the pH of the environment. It is expected that the data provided here for the first time help interpreting the experimental behavior of anthocyanidins under conditions similar to those relevant to biological systems.

Conclusions

The 3 first acid–base equilibria of 12 anthocyanidins were investigated using theoretical calculations within the frame of the Density Functional Theory (DFT). Their most likely deprotonation routes were elucidated, and proposed here for the first time.

Three computational methodologies for predicting pKa values were tested using the available experimental data as reference. They are the isodesmic method, the direct method and the fitting parameters method. The latter was found to be the one leading to the best agreement with the experiments, with MUE = 0.31 and MAE = 0.83 pKa units. Therefore, it was chosen to calculate the whole set of pKa values.

pKa1, pKa2 and pKa3 were calculated for the investigated anthocyanidins and used to estimate their molar fractions in the 0 to 14 pH range. It was found that at physiological pH more than one acid base species are present to a significant extent for all the studied molecules. The population of H5A+ is proposed to be negligible at this pH, while the most abundant species are expected to be H4A and H3A. However, due to the usual higher reactivity of more deprotonated species in some biological activities, such as the antioxidant protection, H2A2− cannot be neglected.

Hopefully, the data provided here may contribute to gain better understanding on the complex processes involving anthocyanidins, under physiological conditions.

Acknowledgements

This work was carried out using a NES supercomputer, provided by Dirección General de Cómputo y Tecnologías de Información y Comunicación (DGTIC). This work was partially supported by projects SEP-CONACyT 167491 and 167430, and DGAPA PAPIIT-IN220215. J. R. L.-C. acknowledges the financial support to CONACyT in the form of postdoctoral fellowship.

References

  1. H. M. Ali, W. Almagribi and M. N. Al-Rashidi, Food Chem., 2016, 194, 1275–1282 CrossRef CAS PubMed.
  2. N. Khandelwal and S. K. Abraham, Planta Med., 2014, 80, 1278–1283 CrossRef CAS PubMed.
  3. S. Moriwaki, K. Suzuki, M. Muramatsu, A. Nomura, F. Inoue, T. Into, Y. Yoshiko and S. Niida, PLoS One, 2014, 9, e97177 Search PubMed.
  4. N. Matsunaga, K. Tsuruma, M. Shimazawa, S. Yokota and H. Hara, Phytother. Res., 2010, 24, S42–S47 CrossRef PubMed.
  5. H. M. Hügel, N. Jackson, B. May, A. L. Zhang and C. C. Xue, Phytomedicine, 2016, 23, 220–231 CrossRef PubMed.
  6. M. J. Kruger, N. Davies, K. H. Myburgh and S. Lecour, Food Res. Int., 2014, 59, 41–52 CrossRef CAS.
  7. T. C. Wallace, Adv. Nutr., 2011, 2, 1–7 CrossRef CAS PubMed.
  8. P. J. Mink, C. G. Scrafford, L. M. Barraj, L. Harnack, C. P. Hong, J. A. Nettleton and D. R. Jacobs Jr, Am. J. Clin. Nutr., 2007, 85, 895–909 CAS.
  9. H. Jia, W. Chen, X. Yu, X. Wu, S. Li, H. Liu, J. Liao, W. Liu, M. Mi, L. Liu and D. Cheng, J. Vet. Sci. Technol., 2013, 14, 345–353 CrossRef.
  10. J. Tanaka, T. Nakanishi, K. Ogawa, K. Tsuruma, M. Shimazawa, H. Shimoda and H. Hara, J. Agric. Food Chem., 2011, 59, 528–536 CrossRef CAS PubMed.
  11. W. Liu, X. Lu, G. He, X. Gao, M. Li, J. Wu, Z. Li, J. Wu, J. Wang and C. Luo, Biotechnol. Lett., 2013, 35, 491–498 CrossRef CAS PubMed.
  12. H. Kausar, J. Jeyabalan, F. Aqil, D. Chabba, J. Sidana, I. P. Singh and R. C. Gupta, Cancer Lett., 2012, 325, 54–62 CrossRef CAS PubMed.
  13. C. P. Hsu, Y. T. Shih, B. R. Lin, C. F. Chiu and C. C. Lin, J. Agric. Food Chem., 2012, 60, 3686–3692 CrossRef CAS PubMed.
  14. H. S. Barcena, P. Chen and A. Tuachi, SpringerPlus, 2015, 4, 499 CrossRef PubMed.
  15. R. A. Mosquera, L. Estévez and M. G. Bugarín, Methods Mol. Biol., 2015, 1208, 257–276 CAS.
  16. J. Azevedo, I. Fernandes, A. Faria, J. Oliveira, A. Fernandes, V. D. Freitas and N. Mateus, Food Chem., 2010, 119, 518–523 CrossRef CAS.
  17. T. N. Brown and N. Mora-Diez, J. Phys. Chem. B, 2006, 110, 9270–9279 CrossRef CAS PubMed.
  18. F. J. Heredia, E. M. Francia-Aricha, J. C. Rivas-Gonzalo, I. M. Vicario and C. Santos-Buelga, Food Chem., 1998, 63, 491–498 CrossRef CAS.
  19. T. Borkowski, H. Szymusiak, A. Gliszczyńska-Świgło, I. M. C. M. Rietjens and B. Tyrakowska, J. Agric. Food Chem., 2005, 53, 5526–5534 CrossRef CAS PubMed.
  20. L. Estévez, N. Otero and R. A. Mosquera, J. Phys. Chem. B, 2010, 114, 9706–9712 CrossRef PubMed.
  21. K. Lemańska, H. Szymusiak, B. Tyrakowska, R. Zieliński, A. E. M. F. Soffers and I. M. C. M. Rietjens, Free Radicals Biol. Med., 2001, 31, 869–881 CrossRef.
  22. M. J. Frisch, G. W. Trucks, H. B. Schlegel, G. E. Scuseria, M. A. Robb, J. R. Cheeseman, G. Scalmani, V. Barone, B. Mennucci, G. A. Petersson, H. Nakatsuji, M. Caricato, X. Li, H. P. Hratchian, A. F. Izmaylov, J. Bloino, G. Zheng, J. L. Sonnenberg, M. Hada, M. Ehara, K. Toyota, R. Fukuda, J. Hasegawa, M. Ishida, T. Nakajima, Y. Honda, O. Kitao, H. Nakai, T. Vreven, J. A. Montgomery Jr, J. E. Peralta, F. Ogliaro, M. J. Bearpark, J. Heyd, E. N. Brothers, K. N. Kudin, V. N. Staroverov, R. Kobayashi, J. Normand, K. Raghavachari, A. P. Rendell, J. C. Burant, S. S. Iyengar, J. Tomasi, M. Cossi, N. Rega, N. J. Millam, M. Klene, J. E. Knox, J. B. Cross, V. Bakken, C. Adamo, J. Jaramillo, R. Gomperts, R. E. Stratmann, O. Yazyev, A. J. Austin, R. Cammi, C. Pomelli, J. W. Ochterski, R. L. Martin, K. Morokuma, V. G. Zakrzewski, G. A. Voth, P. Salvador, J. J. Dannenberg, S. Dapprich, A. D. Daniels, Ö. Farkas, J. B. Foresman, J. V. Ortiz, J. Cioslowski and D. J. Fox, Gaussian 09, Gaussian, Inc., Wallingford, CT, USA, 2009 Search PubMed.
  23. Y. Zhao, N. E. Schultz and D. G. Truhlar, J. Chem. Theory Comput., 2006, 2, 364–382 CrossRef PubMed.
  24. A. V. Marenich, C. J. Cramer and D. G. Truhlar, J. Phys. Chem. B, 2009, 113, 6378–6396 CrossRef CAS PubMed.
  25. A. Golius, L. Gorb, A. Michalkova Scott, F. C. Hill and J. Leszczynski, Struct. Chem., 2015, 26, 1281–1286 CrossRef CAS.
  26. C. Caicedo, C. Iuga, R. Castañeda-Arriaga and J. R. Alvarez-Idaboy, RSC Adv., 2014, 4, 38918–38930 RSC.
  27. R. Liu, J. Zhang, X. Sun, C. Huang and B. Chen, Comput. Theor. Chem., 2014, 1027, 5–10 CrossRef CAS.
  28. R. Álvarez-Diduk, M. T. Ramírez-Silva, A. Galano and A. Merkoçi, J. Phys. Chem. B, 2013, 117, 12347–12359 CrossRef PubMed.
  29. T. R. Heera and L. Cindrella, J. Mol. Model., 2010, 16, 523–533 CrossRef CAS PubMed.
  30. S. Corona-Avendaño, G. Alarcón-Angeles, G. A. Rosquete-Pina, A. Rojas-Hernández, A. Gutierrez, M. T. Ramírez-Silva, M. Romero-Romo and M. Palomar-Pardavé, J. Phys. Chem. B, 2007, 111, 1640–1647 CrossRef PubMed.
  31. J. Ho and M. L. Coote, Theor. Chem. Acc., 2010, 125, 3–21 CrossRef CAS.
  32. A. M. Rebollar-Zepeda, T. Campos-Hernández, M. T. Ramírez-Silva, A. Rojas-Hernández and A. Galano, J. Chem. Theory Comput., 2011, 7, 2528–2538 CrossRef CAS PubMed.
  33. M. Cordova-Gomez, A. Galano and J. R. Alvarez-Idaboy, RSC Adv., 2013, 3, 20209–20218 RSC.
  34. A. Galano, J. R. Alvarez-Idaboy and M. Francisco-Márquez, J. Phys. Chem. B, 2011, 115, 13101–13109 CrossRef CAS PubMed.
  35. R. Casasnovas, J. Ortega-Castro, J. Donoso, J. Frau and F. Muñoz, Phys. Chem. Chem. Phys., 2013, 15, 16303–16313 RSC.
  36. J. Ho and M. L. Coote, Theor. Chem. Acc., 2010, 125, 3–21 CrossRef CAS.
  37. R. Casasnovas, J. Ortega-Castro, J. Frau, J. Donoso and F. Muñoz, Int. J. Quantum Chem., 2014, 114, 1350–1363 CrossRef CAS.
  38. D. M. Camaioni and C. A. Schwerdtfeger, J. Phys. Chem. A, 2005, 109, 10795–10797 CrossRef CAS PubMed.
  39. T. Matsui, T. Baba, K. Kamiya and Y. Shigeta, Phys. Chem. Chem. Phys., 2012, 14, 4181–4187 RSC.
  40. T. Baba, T. Matsui, K. Kamiya, M. Nakano and Y. Shigeta, Int. J. Quantum Chem., 2014, 114, 1128–1134 CrossRef CAS.
  41. S. Zhang, J. Baker and P. Pulay, J. Phys. Chem. A, 2010, 114, 425–431 CrossRef CAS PubMed.
  42. S. Zhang, J. Baker and P. Pulay, J. Phys. Chem. A, 2010, 114, 432–442 CrossRef CAS PubMed.
  43. S. Zhang, J. Comput. Chem., 2012, 33, 517–526 CrossRef CAS PubMed.
  44. S. Zhang, J. Comput. Chem., 2012, 33, 2469–2482 CrossRef CAS PubMed.
  45. T. Matsui, A. Oshiyama and Y. Shigeta, Chem. Phys. Lett., 2011, 502, 248–252 CrossRef CAS.

Footnote

Electronic supplementary information (ESI) available: Experimental pKa and calculated ΔG0 values for the set of phenols used to obtain the k and C0 parameters. Relative Gibbs energies of the possible deprotonation reactions. pKa values of quercetin and kaempferol. Cartesian coordinates of the optimized geometries. See DOI: 10.1039/c6ra10818k

This journal is © The Royal Society of Chemistry 2016