DOI:
10.1039/C6RA04306B
(Paper)
RSC Adv., 2016,
6, 33821-33827
Eco-friendly synthesis of ZnO nanopencils in aqueous medium: a study of photocatalytic degradation of methylene blue under direct sunlight†
Received
17th February 2016
, Accepted 25th March 2016
First published on 30th March 2016
Abstract
Synthesis of monodispersed nanostructures would be attractive if the synthesis is simple, one step and cost effective. In this work, an eco-friendly approach for the synthesis of ZnO nanostructures using the aqueous extract of pomegranate peel has been described. ZnO nanoflakes were formed initially upon 15 min sunlight irradiation of an aqueous solution of Zn acetate in the presence of pomegranate peel extract. We observed that the nanoflakes formed are converted to ZnO nanopencils upon mild heating. The nanopencils have been characterized by diffused reflectance spectroscopy, X-ray diffraction analysis, photoluminescence spectroscopy, FT-Raman spectroscopy, X-ray photoelectron spectroscopy, scanning electron microscopy, and transmission electron microscopy. Furthermore, we examined the photocatalytic activity of the ZnO nanopencils and compared the performance with commercial ZnO and TiO2 (P25) nanoparticles towards the photocatalytic degradation of methylene blue under direct sunlight irradiation. The total carbon removal efficiency of the ZnO nanopencils for methylene blue is 95% which was achieved by 4.5 h.
Introduction
ZnO nanoparticles (NPs) are considered as an important material for catalysis,1 solar cells,2 optoelectronic devices,3 sensors,4 and antimicrobial agents5 due to its wide band gap (3.37 eV), large exciton binding energy (60 meV), UV filter characteristics, size dependent luminescence, low cost, high stability and non-toxic nature. Also, ZnO nanoparticle based materials have been used as promising candidates for photocatalytic degradation of many organic pollutants.6–12 In photocatalyst applications, ZnO nanoparticles have exhibited a remarkable catalytic activity and quantum yield compared to widely used TiO2 nanoparticles.6
It is known that the performance of ZnO NPs is highly depended on their morphology, size, surface area and defects. ZnO nanoparticles with various size and morphologies such as rods,13 2D sheets,14 wire,15 rings,16 tetrapods,17 tetragonal pyramid,18 hexagonal cone, hexagonal plate,19 spherical,20 belt,21 dumbbell,22 dandelion,23 spindle,24 mulberry,25 swords and nano pills,26 nails,27 flower28 etc. have been reported. There are large number of methods of preparation are available to make ZnO nano structures, namely oxidation,13 hydrothermal,22–24,26 solvothermal,14 physical vapor deposition,15 template based synthesis,16,19 evaporation,17,27 chemical methods,18 precipitation,20 vapor transport process,21 and microwave irradiation.25
A few reports are available in the literature regarding the synthesis and properties of ZnO nanopencils. For example, flower shaped homocentric ZnO nano structures are made of ZnO nano-pencils by hydrothermal method at 110 °C for 16 h and at pH 9.7.29 In another attempt, ZnO pencil was synthesized in a micro and nano scale using hydrothermal method at 180 °C for 4 h in pH 13.30 Photo luminescent ZnO nano pencil by solvothermal method has been reported.31 ZnO nano wires on amorphous carbon with pencil heads has been prepared, using thermal chemical vapor transport and condensation method.32 However, in almost all the methods available regarding the synthesis of ZnO nanopencils involve high temperature, long hours of heating and alkaline conditions.28,33,34,35
Here, we report direct sunlight irradiation at ambient conditions as a method for the preparation of ZnO nanopencils under aqueous conditions using pomegranate peel extract as a stabilizing and reducing agent. The attractive findings in the current method is that it is simple, fast, eco-friendly approach which eliminates organic solvents, stringent conditions like inert atmosphere, high temperatures, sophisticated instrumentation and constraints based on variable pH conditions. The biosynthesized nanoparticles were characterized by diffused reflectance spectroscopy (DRS), X-ray diffraction spectroscopy (XRD), photoluminescent spectroscopy (PL), FT-Raman spectroscopy, X-ray photo electron spectroscopy (XPS), scanning electron microscopy (SEM), and transmission electron microscopy (TEM). Further, we utilized these ZnO nanopencils for the photocatalytic degradation of methylene blue (MB) under direct sunlight irradiation. The activity of ZnO nanopencils were compared with commercial ZnO and TiO2 nanoparticles.
Experimental
Materials
All the chemicals were purchased from Sigma-Aldrich (USA) and used as received without further purification. Doubly distilled water was used for the experiments. Fresh and ripened pomegranate was purchased from the local market at Chennai (TN, India).
Synthesis of ZnO nanostructure
ZnO nanoparticles were synthesized by adopting a biosynthesis method by using pomegranate (Punica granatum) peel extract.36 Zinc acetate solution was prepared by dissolving 3 g of Zn(O2CCH3)2·2H2O into 30 mL of distilled water. About, 1.5 mL of pomegranate peel extract was added dropwise into the well dissolved precursor solution under vigorous shaking using glass rod. The solution was kept under the sunlight for 15 min. The formed precipitate was collected from the reaction vessel simply by decanting the upper solution. The precipitate was washed thrice with distilled water to remove the excess capping agent and unreacted Zn ions from the solution. The sample was kept in the oven for drying at 120 °C for 2 h which was our as-synthesized products. In order to get the pure substance, the as-synthesized compound was calcined at 300, 450 and 600 °C in air atmosphere.
Characterization
Diffused reflectance spectra (DRS) of the samples were recorded on a Shimadzu UV-vis spectrophotometer (UV-2550) fitted with ISR-2200 DRS accessory. Solid-state photoluminescence (PL) spectra were recorded on Shimadzu RF-5301 spectroflurophotometer. Fluoromax-4 (HORIBA Jobin Yvon) spectrofluorometer was used for photoluminescence measurement of liquid sample. Bruker D8 advance powder X-day diffractometer with Cu Kα radiation was used for X-ray diffraction analysis. X-ray photoelectron spectroscopy (XPS) measurements were conducted to analyse elemental and chemical state of elements in the sample using Al Kα radiation as the source (Omicron model). ASAP2020 Micromeritics surface area analyzer was employed for measuring the surface area of the sample. FT-Raman spectra have been recorded from Bruker RFS 27 spectrometer. The size and morphology of ZnO NPs were examined using transmission electron microscopy (TEM) (Philips Tecnai 12). Energy dispersive X-ray spectroscopy (EDAX) was performed by TEM, equipped with an EDAX attachment. Scanning electron microscopy (SEM) images were taken by FEI Quanta FEG 200. The photocatalytic degradation of methylene blue (MB) was followed spectrophotometrically using UV-vis absorption spectroscopy (UV-3100 Hitachi). Total organic carbon content (TOC) of the reaction mixture was determined by total organic carbon analyzer (Shimadzu TOC-VCPH model). We measured the intensity of sunlight (measured between 10.00 am to 2.00 pm in the month of April to June in TN, India) using digital Lux meter (Metravi 1332).
Evaluation of photocatalytic activity
Photocatalytic activity of ZnO nanoparticles towards the degradation of methylene blue (MB) as a model dye was performed under sunlight. The intensity of observed sun light radiation was 95 mW cm−2. A known amount of photocatalysts were added into 150 mL of desired concentration of MB solution and stirred for about 30 min in dark for reaching adsorption–desorption equilibrium prior to the sunlight irradiation. The concentration of MB in the bulk solution at this condition (measured from the absorbance of MB at its λmax = 663 nm) was taken as the initial concentration (C0). 3 mL of aliquots were withdrawn after a certain period of irradiation of the suspension and the catalyst was removed by filtration using a 0.2 μL PVDF syringe filter and then the concentration of MB in the filtrate was determined using UV-vis spectroscopy. The concentration obtained at certain irradiation time (t) is denoted as Ct. Triplicate experiments were conducted at optimized conditions and the mean values of the results are presented. The catalyst is removed from the solution, washed in distilled water, and dried at 100 °C for 2 h for recycling process. We followed the similar reaction conditions for testing the photocatalytic performance of commercial TiO2 (P25) and ZnO NPs.
Results and discussion
Characterization of ZnO nanostructures
ZnO nano flakes were prepared by treating Zn acetate and aqueous pomegranate peel extract, and was calcined in air to achieve the nano-pencil and nano-rod morphology (Scheme 1).
 |
| | Scheme 1 Synthesis of ZnO nano structures using aqueous pomegranate peel extract. | |
The SEM images of as synthesized ZnO nano flake is given in Fig. 1a. The change in morphology is found to be depended on the calcined temperature (Fig. 1b–d).37,38 The pencil like morphology was very much evident from the TEM images (inset in Fig. 1b and e). The width of formed nano pencil is ∼20 nm. The high resolution TEM image of nano pencil clearly shows the distance between the two lattice fringes as 0.24 nm which correspond to the (101) planes in the crystal (Fig. 1d).39 This indicates the crystalline nature of the particle. The inset in Fig. 1c shows the selected area electron diffraction pattern of crystalline ZnO nano pencil. The presence of Zn and O in ZnO nanoparticles were further confirmed by EDAX (Fig. S1†) and mapping obtained from EDAX analysis (Fig. S2†). The SEM and TEM images revealed that, the calcination temperature has a strong influence on the size and morphology of the particles. These results, taken together, indicate the formation of ZnO nanoparticles via a biogenic route. The pomegranate peel extract contains phytochemicals such as punicalagin and punicalin.40,41 These biomolecules acted as a reducing and stabilizing agent for the formation of ZnO nanoparticles in aqueous solution.36
 |
| | Fig. 1 (a) SEM image of as-synthesized ZnO nano flakes, (b) ZnO nanopencils calcined at 300 °C {(inset i) TEM image of the tip of the ZnO nano pencil, (inset ii) photographic image of pencils}, (c) TEM images of ZnO nanopencils (inset is the corresponding SAED pattern), (d) HR-TEM image of ZnO nano pencil, (e and f) TEM images of ZnO nano structures calcined at 450 °C and 600 °C. | |
Fig. 2a shows the X-ray diffraction pattern of biosynthesized ZnO nano structures calcined at different temperatures (300, 450 and 600 °C). The peaks 2θ at 31.7, 34.4, 36.2, 47.5, 56.6, 62.8 and 67.8 are indexed as (100), (002), (101), (102), (110), (103), (200), (112), (201), (004) and (202). The pattern indicates the hexagonal structure of ZnO (wurtzite).30 The diffraction peaks became sharper with increasing the calcination temperature, which suggests that the crystallinity of formed nanosystems is enhanced and no impurities are present in the system. We also observed that the relative peak intensities (e.g., intensities of (002) to (100)) changes during the calcination of the sample. While the intensity of the peaks increased when the temperature is changed from 300 °C to 450 °C, there was little change for the peak intensity when the temperature is changed from 450 °C to 600 °C. This implies that the significant morphological evolution of the sample takes place between 300 °C to 450 °C during calcination42 Fig. 2b shows the diffused reflectance spectra (DRS) of the ZnO structures calcined at different temperatures, along with that of commercial ZnO nanoparticles. We calculated the direct band gap energies of the biosynthesized ZnO nanoparticles using Tauc's plot. The estimated values are 3.1, 3.15 and 3.18 eV for the nano systems calcined at 300, 450 and 600 °C, respectively (Fig. 2c–e). The observed band gap values are depended on the size and morphologies of the nanostructures, as expected.43 The room temperature fluorescence spectra of calcined samples are shown in Fig. 3a (λexc = 320 nm).36 The peak at 380 and 530 nm indicates the near band gap excitonic emission and singly ionized oxygen vacancies in ZnO structures. The spectra clearly indicates that, the intensity of near band edge emission (380 nm) drops dramatically and the intensity of the green emission (530 nm) increases as the processing temperature is decreased from 600 to 300 °C.44 The reduced intensity at near band emission indicates a lower electron–hole recombination rate which indicates that the nano-pencils may act as a better photo catalyst as compared to the other two ZnO nano structures formed.36
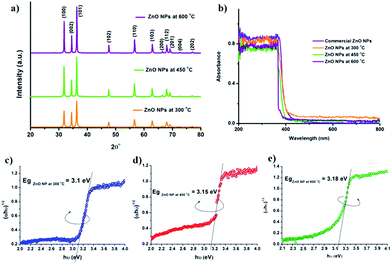 |
| | Fig. 2 (a) XRD pattern (b) DRS of ZnO nano structures calcined at different temperatures (300, 450 and 600 °C) and Tauc's plot shows the band gap of ZnO nanoparticles calcined at (c) 300 °C (d) 450 °C (e) 600 °C. | |
 |
| | Fig. 3 (a) Photoluminescence spectra of ZnO nano structures calcined at different temperature (λexc = 320 nm), (b) FT-Raman spectra of ZnO nano structures calcined at different temperature and (c) survey XPS spectrum of ZnO nano pencil and the corresponding high resolution spectrum of Zn 2p and O 1s. | |
Fig. 3b shows the Raman spectra of ZnO nanostructures calcined at different temperatures. The peaks were observed at 331, 380, 435 and 580 cm−1. These peaks are corresponding to Raman active phonon modes of wurtzite ZnO with C6v symmetry. The two non-polar Raman active modes are assigned as E2 (high) corresponding to oxygen atoms and E2 (low) corresponding to zinc.45 The peak at 331 cm−1 (E2 high and E1 low) is due to the enhancement of Raman active and inactive phonons with lattice symmetry.36 The degeneracy of infrared active optical phonons into transverse branch caused peak at 380 cm−1. The peaks at 435 belong to E2 (high) vibrational mode which is a characteristic band of wurtzite. As the temperature is increased, the intensity of peak at 435 cm−1 decreases, while the peak intensity at 331 cm−1 increases.44 This is because of transformation in the vibrational properties of ZnO nano structures due to change in size and shape at different calcined temperature.46 The peak at 583 cm−1 corresponds to E2 mode and the deficiency of oxygen in ZnO. The peak at 580 cm−1 is disappeared for the samples calcined at 450 and 600 °C, presumably due to the disappearance of the impurity states at high temperature.47 The survey scan of the XPS spectrum of ZnO nano pencil is shown in Fig. 3d. It shows that the material contains Zn and O. The high resolution Zn 2p spectrum with peaks at 1021.5 eV for 2p3/2 and 1044.3 eV for 2p1/2 indicate the oxidation state of Zn2+ in the form of ZnO in the sample. The O 1s spectra of ZnO nano pencil can be described as the superposition of three peaks by Gaussian distribution, located around 529.2 eV, 530.4 eV and 531.3 eV (Fig. S3†). The peak at 529.2 eV is attributed to the O2− ions in wurtzite structure of hexagonal Zn2+ ion array.48 The peaks at 530.4 eV and 531.3 eV are related to O2− in the oxygen deficient region and the presence of loosely bounded oxygen on the surface of ZnO.49 Furthermore, the surface area of ZnO nanostructures calcined at 300 °C, 450 °C and 600 °C were evaluated from BET isotherm, and the values were found to be 23 m2 g−1, 19 m2 g−1 and 17 m2 g−1 respectively, this suggest that the nanoparticles calcined at 300 °C may perform as a better catalyst due to the relatively high surface area.
Photocatalytic degradation of methylene blue
The photocatalytic mechanism contains three process: (1) light absorption, (2) charge separation and (3) photocatalytic reaction on the semiconductor surfaces.50,51 The presence of surface hydroxyl groups facilitates the trapping of photoinduced electrons and holes, which enhances the photocatalytic degradation process.52 We examined the photocatalytic degradation of methylene blue (MB) under sunlight irradiation by pomegranate peel extract stabilized ZnO nano structures, commercial ZnO and TiO2 (P25) nanoparticles. We monitored the changes in the absorbance of MB ([0.02 mM]) at 663 nm in presence of catalyst ([0.6 g L−1]) by UV-vis spectroscopy. The decolorization of MB in presence of ZnO nano pencil, ZnO nano systems at 450 °C and ZnO NPs at 600 °C was occurred in 90, 110 and 120 min respectively, under sunlight irradiation (Fig. 4a–c). The photocatalytic degradation process complies with first-order kinetics, C = C0![[thin space (1/6-em)]](https://www.rsc.org/images/entities/char_2009.gif) exp(−kt), where C is the concentration of MB after irradiation, C0 is the initial concentration of MB, constant k represents the reaction rate constant and t is the irradiation time. Fig. 4d shows the photocatalytic degradation of MB as a function of time in presence of different catalysts, which clearly indicate the better performance of the present ZnO nanopencils. We performed a control experiment which consists of MB solution exposed to sunlight in the absence of any catalyst. The result indicates that no degradation of MB in the absence of catalyst under sunlight irradiation. Conversely, the intensity of MB is decreased in presence of catalysts with time (Fig. 4a–d). We observed that ZnO nano pencil has shown a better catalytic activity compared to other ZnO nano systems (Fig. 4d). The better photo catalytic efficiency of ZnO nano pencil can be attributed to smaller size, uniform morphology,36 the efficient movement of photo generated electron–hole pair to the surface,30 and the high absorption of radiation due to oxygen vacancy. The oxygen vacancy narrows the band gap and provides a temporary energy state for the photo generated electron, which reduce the electron–hole recombination rate. As a result, the photo catalysis efficiency increases.53–55 Further, the high surface oxygen vacancies (Fig. 3a) lead to absorb more oxygen from water resulting in the formation of higher number of reactive radicals such as OH˙ and O2˙ as compared to other catalysis.29
exp(−kt), where C is the concentration of MB after irradiation, C0 is the initial concentration of MB, constant k represents the reaction rate constant and t is the irradiation time. Fig. 4d shows the photocatalytic degradation of MB as a function of time in presence of different catalysts, which clearly indicate the better performance of the present ZnO nanopencils. We performed a control experiment which consists of MB solution exposed to sunlight in the absence of any catalyst. The result indicates that no degradation of MB in the absence of catalyst under sunlight irradiation. Conversely, the intensity of MB is decreased in presence of catalysts with time (Fig. 4a–d). We observed that ZnO nano pencil has shown a better catalytic activity compared to other ZnO nano systems (Fig. 4d). The better photo catalytic efficiency of ZnO nano pencil can be attributed to smaller size, uniform morphology,36 the efficient movement of photo generated electron–hole pair to the surface,30 and the high absorption of radiation due to oxygen vacancy. The oxygen vacancy narrows the band gap and provides a temporary energy state for the photo generated electron, which reduce the electron–hole recombination rate. As a result, the photo catalysis efficiency increases.53–55 Further, the high surface oxygen vacancies (Fig. 3a) lead to absorb more oxygen from water resulting in the formation of higher number of reactive radicals such as OH˙ and O2˙ as compared to other catalysis.29
 |
| | Fig. 4 UV-vis spectra of MB after sunlight irradiation for different time intervals in the presence of (a) ZnO nano pencil, (b) ZnO nano systems at 450 °C, (c) ZnO NPs at 600 °C. Photocatalytic degradation of methylene blue (d) in the presence of different photocatalysts ([catalyst] = 0.6 g L−1, [MB] = 0.02 mM) and (e) at various concentration of ZnO nano pencil under sunlight irradiation ([MB] = 0.02 mM). | |
Upon irradiation of ZnO nano pencil by sunlight, there is a possibility of both direct band gap excitation and sensitization mechanism. In the case of direct band gap excitation method, the sunlight excites the electron in valance band of ZnO nano pencil in to the conduction band. The holes in the valance band will react with water and generate ˙OH radicals and electrons in the conduction band will produce superoxide anion radical (O2˙−).36 The successive formation of these radicals leads the efficient photocatalytic degradation of MB. Alternatively, sunlight excites the MB absorbed on the catalyst, which inject the electrons into the conduction band of ZnO nanopencils. These electrons are consumed by the dissolved oxygen in the solution to generate reactive oxidative species, which degrades MB molecules.56–58 Fig. 5 provides a cartoon representation of the overall mechanism for the photocatalytic degradation of methylene blue in the presence of ZnO nano pencil under sunlight irradiation. The various steps involved in the process are summarized below.36,59,60
| |
 | (1) |
| | |
ZnO nano pencil (e−(CB)) + O2 → O2˙−
| (2) |
| | |
MB+˙ + O2˙−/O2 → CO2 + H2O
| (3) |
| |
 | (4) |
| | |
ZnO nano pencil (e−(CB)) + O2 → ZnO nano pencil + O2˙−
| (5) |
| | |
HO2˙ + H+ + O2 → H2O2 + O2
| (7) |
| | |
O2˙− + H2O2 → ˙OH + −OH + O2
| (8) |
| | |
ZnO nano pencil (h−(VB)) + −OH → ZnO nano pencil + ˙OH
| (9) |
| | |
˙OH + methylene blue (MB) → CO2 + H2O
| (10) |
 |
| | Fig. 5 Proposed mechanism for the electron transfer events occurred in ZnO nano-pencil during the degradation of MB upon sunlight irradiation. | |
The photocatalytic reaction is highly depended on the concentration of the catalyst in the reaction medium. As we found ZnO nanopencils show better catalytic activity compared to that formed at 450 and 600 °C, we optimized the quantity of ZnO nano pencil required for an efficient photocatalytic degradation of MB under sunlight irradiation. The quantity of catalyst is varied from 0.1 to 0.7 g L−1. The results suggest that, the upper bound concentration of the catalyst which gives the maximum rate is 0.6 g L−1 (Fig. 4e). The decrease in the catalytic activity in presence of catalyst above 0.6 g L−1 could be due to the light scattering by the catalyst in the reaction mixture.36,54
The formation of ˙OH radical on the surface of ZnO nanoparticles under sunlight irradiation was studied by fluorescence technique using terephthalic acid as a probe molecule. The non-fluorescent terephthalic acid reacts with ˙OH radical to form fluorescent 2-hydroxy terephthalic acid.60 The fluorescent intensity is directly proportional to the formation of ˙OH radicals in the reaction mixture.60 The results revealed that the generation of ˙OH radical is higher in the case of ZnO nanopencils compared to other catalyst (Fig. 6a). It is to be noted that the fluorescent was not observed either with ZnO nanopencil in the absence of light or with terephthalic acid in the presence of light.60 We observed the fluorescent intensity of terephthalic acid in presence of ZnO nanopencils at different irradiation time (Fig. 6b). The maximum intensity was observed at 90 min of sunlight irradiation. The mineralization efficiency of ZnO nanopencils was measured through total organic carbon analysis (TOC).36 It was found that, the complete mineralization was happened with 4.50 h of irradiation by sunlight (Fig. 6c). Further, we investigated the reusability of ZnO nanopencil towards the degradation of methylene blue. The result revealed that, the catalyst is stable up to five consecutive cycles which clearly indicates the stability of the catalyst (Fig. 6d). The activity is reduced after fifth cycle due to the change in the size and shape of the nanoparticles caused by continuous usage (Fig. S4†).
 |
| | Fig. 6 (a) Fluorescence spectra of terephthalic acid (excited at 315 nm) in the presence of different photocatalysts under sunlight irradiation ([TA] = 0.5 mM), (b) fluorescence spectra of terephthalic acid (excited at 315 nm), in the presence of ZnO nanopencils at various irradiation time under sunlight ([TA] = 0.5 mM), (c) mineralization of MB in presence of ZnO nanopencil under sunlight irradiation and (d) photocatalytic degradation of MB using recycled ZnO nanopencils under sun light irradiation. | |
Conclusions
ZnO nanopencils have been synthesized using a simple, cost effective, and rapid technique through an eco-friendly approach. The morphology of the nano-structures plays an important role in determining the efficiency of the photocatalytic degradation of methylene blue. ZnO nanopencils show better photocatalytic degradation ability compared to other ZnO nano-structures under sunlight irradiation. The photocatalytic degradation of methylene blue under direct sunlight irradiation was followed both sensitization and direct band gap mechanism in presence of the catalyst. The photocatalytic activity of ZnO-nano pencil was reproducible and re-cycled up to five cycles with identical efficiency. Further studies using the eco-friendly nano-systems for biomedical applications are currently being investigated in our laboratory and the results will be published in due course.
Acknowledgements
S. Kaviya thanks for the INSPIRE fellowship from DST, Govt. of India. We thank the financial support from DST Nano Mission {Ref. No. SR/NM/MS-115/2010 (G)}. We thank SAIF, IITM for SEM analysis.
Notes and references
- A. Kumar, D. Saxena and M. K. Gupta, Green Chem., 2013, 15, 2699–2703 RSC.
- W. J. E. Beek, M. M. Wienk and R. A. J. Janssen, Adv. Mater., 2004, 16, 1009–1013 CrossRef CAS.
- J. H. Lim, C. K. Kang, K. K. Kim, I. K. Park, D. K. Hwang and S. J. Park, Adv. Mater., 2006, 18, 2720–2724 CrossRef CAS.
- C. L. Hsu, K. C. Chen, T. Y. Tsai and T. J. Hsueh, Sens. Actuators, B, 2013, 182, 190–196 CrossRef CAS.
- K. R. Raghupathi, R. T. Koodali and A. C. Manna, Langmuir, 2011, 27, 4020–4028 CrossRef CAS PubMed.
- S. Sakthivel, B. Neppolian, M. V. Shankar, B. Arabindoo, M. Palanichamy and V. Murugesan, Sol. Energy Mater. Sol. Cells, 2003, 77, 65–82 CrossRef CAS.
- J. H. Sun, S. Y. Dong, Y. K. Wang and S. P. Sun, J. Hazard. Mater., 2009, 172, 1520–1526 CrossRef CAS PubMed.
- I. Kazeminezhad and A. Sadollahkhani, Mater. Lett., 2014, 120, 267–270 CrossRef CAS.
- R. Y. Hong, J. H. Li, L. L. Chen, D. Q. Liu, H. Z. Li, Y. Zheng and J. Ding, Powder Technol., 2009, 189, 426–432 CrossRef CAS.
- G. Kumar, R. Kumar, S. W. Hwang and A. Umar, J. Nanosci. Nanotechnol., 2014, 9, 7161–7166 CrossRef.
- S. Chakrabarti and B. K. Dutta, J. Hazard. Mater., 2004, B112, 269–278 CrossRef PubMed.
- Q. I. Rahman, M. Ahmad, S. K. Misra and M. Lohani, Mater. Lett., 2013, 91, 170–174 CrossRef CAS.
- Z. Gu, M. P. Paranthaman, J. Xu and Z. W. Pan, ACS Nano, 2009, 3, 273–278 CrossRef CAS PubMed.
- M. Yang, G. Pang, J. Li, L. Jiang, D. Liang and S. Feng, J. Phys. Chem. C, 2007, 111, 17213–17220 CAS.
- S. C. Lyu, Y. Zhang and C. J. Lee, Chem. Mater., 2003, 15, 3294–3299 CrossRef CAS.
- S. Jung, W. Cho, H. J. Lee and M. Oh, Angew. Chem., Int. Ed., 2009, 48, 1459–1462 CrossRef CAS PubMed.
- M. Y. Guo, A. M. C. Ng, F. Liu, A. B. Djurisic, W. K. Chan, H. Su and K. S. Wong, J. Phys. Chem. C, 2011, 115, 11095–11101 CAS.
- Z. Dai, K. Liu, Y. Tang, X. Yang, J. Bao and J. Shen, J. Mater. Chem., 2008, 18, 1919–1926 RSC.
- S. Y. Kim, I. S. Lee, Y. S. Yeon, S. M. Park and J. K. Song, Bull. Korean Chem. Soc., 2008, 29, 1960–1964 CrossRef CAS.
- C. H. Hsieh, J. Chin. Chem. Soc., 2007, 54, 31–34 CrossRef CAS.
- X. Xu, F. S. F. Brossard, D. A. Williams, D. P. Collins, M. J. Holmes, R. A. Taylor and X. Zhang, Appl. Phys. Lett., 2009, 94, 231103–231105 CrossRef.
- F. Wang, X. Qin, Z. Guo, Y. Meng, L. Yang and Y. Ming, Ceram. Int., 2013, 39, 8969–8973 CrossRef CAS.
- R. B. Kale and S. Y. Lu, J. Alloys Compd., 2013, 579, 444–449 CrossRef CAS.
- N. Kiomarsipour and R. S. Razavi, Ceram. Int., 2013, 39, 813–818 CrossRef CAS.
- J. Ma, J. Liu, Y. Bao, Z. Zhu, X. Wang and J. Zhang, Ceram. Int., 2013, 39, 2803–2810 CrossRef CAS.
- A. Moulahi and F. Sediri, Ceram. Int., 2014, 40, 943–950 CrossRef CAS.
- G. Shen, Y. Bando, B. Liu, D. Golberg and C. Lee, Adv. Funct. Mater., 2006, 16, 410–416 CrossRef CAS.
- H. J. Zhaia, W. H. Wub, F. Lub, H. S. Wangb and C. Wangb, Mater. Chem. Phys., 2008, 112, 1024–1028 CrossRef.
- D. Bhuyan, B. Malakar, S. S. Arbuj and L. Saikia, RSC Adv., 2014, 4, 8256–8259 RSC.
- A. Moulahi and F. Sediri, Mater. Res. Bull., 2013, 48, 3723–3728 CrossRef CAS.
- S. S. Arbuj, N. Rumale, A. Pokle, J. D. Ambekar, S. B. Rane, S. B. U. P. Mulik and D. P. Amalnerkar, Sci. Adv. Mater., 2014, 6, 269–275 CrossRef CAS.
- Y. H. Yang, X. Y. Chen, Y. Feng and G. W. Yang, Nano Lett., 2007, 7, 3879–3883 CrossRef CAS PubMed.
- P. K. Samanta and S. Mishra, Mater. Lett., 2013, 91, 338–340 CrossRef CAS.
- K. Dai, G. Zhu, Z. Liu, Q. Liu, Z. Chen and L. Lu, Mater. Lett., 2012, 67, 193–195 CrossRef CAS.
- V. G. Pol, J. M. C. Moreno and P. Thiyagarajan, Langmuir, 2008, 24, 13640–13645 CrossRef CAS PubMed.
- S. Kaviya and E. Prasad, RSC Adv., 2015, 5, 17179–17185 RSC.
- K. Lv, Q. Xiang and J. Yu, Appl. Catal., B, 2011, 104, 275–281 CrossRef CAS.
- S. Satapathy, A. Ahlawat, A. Paliwasl, R. Singh and M. K. Singha, CrystEngComm, 2014, 16, 2723–2731 RSC.
- J. M. Song, Z. Zhang, J. J. Ni, H. L. Niu, C. J. Mao, S. Y. Zhang and Y. H. Shen, CrystEngComm, 2014, 16, 2652–2659 RSC.
- M. Cam and Y. Hisil, Food Chem., 2010, 123, 878–885 CrossRef CAS.
- T. Ismail, P. Sestili and S. Akhter, J. Ethnopharmacol., 2012, 143, 397–405 CrossRef CAS PubMed.
- K. Lv, Q. Xiang and J. Yu, Appl. Catal., B, 2011, 104, 275–281 CrossRef CAS.
- A. K. Zak, M. E. Abrishami, W. H. A. Majid, R. Yousefi and S. M. Hosseini, Ceram. Int., 2011, 37, 393–398 CrossRef CAS.
- J. L. Yu, Y. F. Lai, S. Y. Cheng, Q. Zheng and Y. H. Chen, J. Lumin., 2015, 161, 330–334 CrossRef CAS.
- T. N. Duc, K. Singh, M. Meyyappan and M. M. Oye, Nanotechnology, 2012, 23, 194015–194019 CrossRef PubMed.
- H. K. Yadav, R. S. Katiyar and V. Gupta, Appl. Phys. Lett., 2012, 100, 051906–051911 CrossRef.
- K. Uma, S. Ananthakumar, R. V. Mangalaraja, T. Soga and T. Jimbo, Adv. Mater. Phys. Chem., 2013, 3, 194–200 CrossRef CAS.
- J. Wang, Z. Wang, B. Huang, Y. Ma, Y. Liu, X. Qin, X. Zhang and Y. Dai, ACS Appl. Mater. Interfaces, 2012, 4, 4024–4030 CAS.
- Y. Hong, C. Tian, B. Jiang, A. Wu, Q. Zhang, G. Tian and H. Fu, J. Mater. Chem. A, 2013, 1, 5700–5708 CAS.
- L. Han, P. Wang and S. Dong, Nanoscale, 2012, 4, 5814–5825 RSC.
- H. Tong, S. Ouyang, Y. Bi, N. Umezawa, M. Oshikiri and Y. Ye, Adv. Mater., 2012, 24, 229–251 CrossRef CAS PubMed.
- S. A. Ansari, M. M. Khan, M. O. Ansari, J. Lee and M. H. Cho, J. Phys. Chem. C, 2013, 117, 27023–27030 CAS.
- T. R. Gordon, M. Cargnello, T. Paik, F. Mangolini, R. T. Weber, P. Fornasiero and C. B. Murray, J. Am. Chem. Soc., 2012, 134, 6751–6761 CrossRef CAS PubMed.
- F. Zuo, L. Wang, T. Wu, Z. Zhang, D. Borchardt and P. Feng, J. Am. Chem. Soc., 2010, 132, 11856–11857 CrossRef CAS PubMed.
- S. Wang, L. Pan, J. J. Song, W. Mi, J. J. Zou, L. Wang and X. Zhnag, J. Am. Chem. Soc., 2015, 137, 2975–2983 CrossRef CAS PubMed.
- L. Pan, J. J. Zou, X. Zhang and L. Wang, J. Am. Chem. Soc., 2011, 133, 10000–10002 CrossRef CAS PubMed.
- C. Chen, W. Ma and J. Zhao, Chem. Soc. Rev., 2010, 39, 4206–4219 RSC.
- C. Nasr, K. Vinodgopal, L. Fisher, S. Hotchandani, A. K. Chattopadhyay and P. V. Kamat, J. Phys. Chem., 1996, 100, 8436–8442 CrossRef CAS.
- B. Subash, B. Krishnakumar, M. Swaminathan and M. Shanthi, Langmuir, 2013, 2, 939–949 CrossRef PubMed.
- N. Pugazhenthiran, S. Murugesan, P. Sathishkumar and S. Anandan, Chem. Eng. J., 2014, 241, 401–409 CrossRef CAS; E. Bizani, K. Fytianos, I. Poulios and V. Tsiridis, J. Hazard. Mater., 2006, 136, 85–94 CrossRef PubMed.
Footnote |
| † Electronic supplementary information (ESI) available. See DOI: 10.1039/c6ra04306b |
|
| This journal is © The Royal Society of Chemistry 2016 |
Click here to see how this site uses Cookies. View our privacy policy here. 


