Development of nanolaminated multilayer Ni–P alloy coatings for better corrosion protection
Liju Eliasa,
K. Udaya Bhatb and
A. Chitharanjan Hegde*a
aElectrochemistry Research Lab, Department of Chemistry, National Institute of Technology Karnataka, Surathkal, Mangalore-575025, India. E-mail: acrhegde@gmail.com; Fax: +91-824-2474033; Tel: +91-824-2473201 Tel: +91-9980360242
bDepartment of Metallurgical and Materials Engineering, National Institute of Technology Karnataka, Surathkal, Mangalore-575025, India
First published on 23rd March 2016
Abstract
Nanolaminated multilayer Nickel–Phosphorous (Ni–P) alloy coatings were developed on mild steel from a citrate bath using glycerol as an additive. Multilayer Ni–P alloy coatings having nanolaminated layers of alloys of alternatively different compositions have been developed using pulsed direct current (DC) by cyclic modulation of the cathode current density. The composition and number (hence thickness) of the layers were tailored by periodic modulation of the current density (c.d.) and time using a programmable power source. The deposition conditions were optimized for both the composition and thickness of the individual layers for the best performance of the coatings against corrosion. Electrochemical corrosion study, evaluated by potentiodynamic polarization and electrochemical impedance spectroscopy (EIS) demonstrated that the multilayer Ni–P alloy coating with 300 nanolaminated layers, represented as (Ni–P)1.0/4.0/300 showed several fold better corrosion resistance compared to its monolayer counterpart (deposited using regular DC) from the same electrolytic bath. Drastic improvement in the corrosion protection efficacy of the nanolaminated multilayer Ni–P alloy coatings were attributed to an increase in number of interfaces, separating layers of alloys having different morphologies, compositions and phase structures, which was supported by scanning electron microscopy (SEM), energy dispersive spectroscopy (EDS) and X-ray diffraction (XRD) analyses, respectively. The corrosion rates of the multilayer Ni–P alloy coatings were decreased with increasing number of layers, only up to an optimal level and then increased. The increase in corrosion rates at a higher degree of layering were attributed to the diffusion of layers, due to the very short deposition time of each layer.
Introduction
Alloys of Fe-group metals (Fe, Co, and Ni) incorporated with other metallic or nonmetallic elements, such as P, Mo, and W, are used widely in industrial applications owing to their unique properties such as high corrosion resistance,1,2 good hardness,3 excellent brightness,4 improved electrocatalytic activity5 and interesting magnetic properties, and magnetic–nonmagnetic transition.6 Many researchers have reported the role of incorporated elements in the unique properties of such alloys such as Fe–P,7 Co–W,8,9 Ni–Mo10 and Ni–W.11 Appealing appearance and, good corrosion and wear resistance made these coatings, especially the Ni–P alloy more attractive for many technological applications.4,7 Electroless and electrodeposition methods have been identified as the most practical and inexpensive route for the synthesis of these coatings.12,13 It is well known that elements, such as P, Mo and W, cannot be electrodeposited by themselves independently from their solution; however, these elements can be co-deposited with Fe-group metals. This phenomenon is called induced co-deposition, introduced first by Brenner.14 Brenner and his coworkers developed many electrolytic baths for the development of alloys of Fe-group metals with P, and succeeded in resolving the obvious limitations of electroless plating such as the use of expensive reducing agent, a high operating temperature and difficulty in controlling the deposition rate. An enormous number of publications on the electrodeposition of phosphorous alloys with Fe-group metals have been reported since 1930s.15 Narayan and Mungole proposed the reduction mechanism through hypophosphite, while explaining the effects of various plating variables, such as bath composition, temperature, pH, and current density, on Ni–P alloy deposition.16 Though an inconsistent relationship between the amount of P and crystallinity of Ni–P alloy coatings is reported,17,18 it was generally found that alloy coatings containing 0 to 10 wt% P are crystalline, between 10 and 15 wt% P are either crystalline or amorphous, and alloys containing more P were amorphous.19Today, in search of efficient surface coating materials for better corrosion protection, the focus has been on the development of compositionally nano-modulated multilayers, or simply nanolaminated alloy coatings in place of their conventional monolayer (monolithic, or homogeneous) coating. These coatings are popularly called composition modulated multilayer alloy (CMMA) coatings,20,21 consisting of a sequence of two metals/alloys, deposited alternately one above the other. They are developed by pulsing periodically the current/voltage during deposition.22 The nanolaminated alloy coating technique is gaining interest amongst the researchers due to genuine reason of low cost and greater flexibility to tailor the properties, such as the thickness of the coating and ability to control the texture and interfaces.23 There are two approaches to develop multilayer coatings electrolytically: the single bath technique (SBT) and double bath technique (DBT). In SBT, multilayer coating is accomplished by pulsing periodically the current/voltage, while keeping the substrate in same electrolyte.24 In DBT, substrate is alternately immersed first in one electrolyte and a deposit is laid down, then it is transferred to the second electrolyte wherein a different deposit is formed, then back to the first bath and so on. The DBT, due to its practical reason is suggested for relatively thick coatings (>50 nm layer thickness) and SBT is for coatings of thinner modulation thicknesses. Both techniques have their own advantages and disadvantages; however, the drawbacks of the DBT have been deemed to outweigh the benefits, so that the SBT approach is commonly used. In general, nanolaminated multilayer alloy coatings developed electrochemically exhibit better electrical, magnetic, optical, chemical and mechanical properties quite distinct from their monolayer alloy counterpart. They are, in effect, new materials and that they are difficult to form other than by electrodeposition and promise an exciting extension to the range of surface coatings and associated applications.25
Thus, inspired by bright appearance and good corrosion stability of electrodeposited Ni–P alloy coating, an effort has been made to improve it further by a nanolaminated multilayer approach. Experimental investigation in which the first part reports the optimization of conditions for deposition of bright Ni–P (monolayer) alloy by conventional method, using direct current (DC) and their characterization; and the second part details the optimization of coating configuration (in terms of composition and number of layers) of nanolaminated Ni–P alloy coatings, using square pulsed DC. A significant decrease in the corrosion rate (CR) found in nanolaminated Ni–P alloy coatings was attributed to alternatively changed chemical composition of the alloy layers, which was affected by the modulation of the current during deposition, and the experimental results are discussed.
Experimental
The aqueous electrolyte was prepared using Analytical Grade chemicals (Merck, Mumbai) and double distilled water. The electrolyte used for the electrodeposition of Ni–P alloys consists of nickel sulfate hexahydrate (NiSO4·6H2O; 28.2 g L−1) and sodium hypophosphite (NaPO2H2·H2O; 51.0 g L−1) as source of Ni and P ions. Tri-sodium citrate (Na3C6H5O7·2H2O; 56.2 g L−1), boric acid (H3BO3; 10.2 g L−1), ammonium chloride (NH4Cl; 20.5 g L−1) and glycerol (C3H8O3; 20.0 mL L−1) were added as complexing agent, buffer, conducting salt (supporting electrolyte) and additive, respectively. The pH of the bath was maintained by the addition of either H2SO4 or NH4OH. The optimal composition and operating parameters were set using conventional Hull cell method.23,25Mild steel panels with exposed area of 6.25 cm2 and pure nickel plate with same exposed surface area were employed as cathode and anode, respectively. Prior to plating, the substrates were polished to a mirror finish mechanically and then treated chemically in 10% HCl for 1 min. After pre-treatment, the substrates were cleaned with acetone and then rinsed in double distilled water. The space of separation between the cathode and anode was 5 cm to ensure uniform deposition. The applied current density (c.d.) for the electrodeposition of Ni–P alloys were varied from 1.0 A dm−2 to 6.0 A dm−2 at pH = 8.0. All deposition reported in this study are referring to 10 min plating duration (for both monolayer and multilayer), for comparison purpose. Monolayer and multilayer Ni–P alloy coatings were deposited using direct current (DC) and pulsed DC, respectively, using a DC Power Analyser (Agilent, N6705A). The current pulse used and coating patterns obtained are shown schematically in Fig. 1. The thickness and composition of the individual layers of the nanolaminated deposits are altered, as required precisely and conveniently by cyclic modulation of the c.d. The thickness of the individual layer was controlled by the duration of the current pulse and its composition was altered by changing the intensity of current density, i.e., Ni–P thin films having different wt% of P were laminated layers after layer by pulsing DC. The total number of layers were changed appropriately by adjusting the time for each layer and multilayer coatings of different configurations were produced; such multilayer coatings are hereafter represented as (Ni–P)1/2/n, where (Ni–P) represents alloy of Ni and P, 1 and 2 represent the cathode current density at which the alternate layers are made to form, and ‘n’ represents the total number of layers formed during total deposition time (T = 10 min).
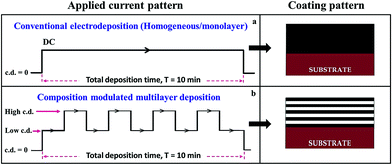 | ||
| Fig. 1 Schematic of the power patterns used for deposition of the monolayer and multilayer Ni–P alloy coatings (left) and the corresponding coatings developed (right). | ||
The developed Ni–P alloy coatings from the optimized bath were characterized for their compositional, morphological and electrochemical behaviors. All electrochemical tests were performed using an electrochemical workstation (Biologic SP-150, France) by the traditional three-electrode method. Ni–P alloy plated mild steel panels having a 1 cm−2 exposed surface area, Pt electrode and saturated calomel electrode (SCE) were used as the working, counter and reference electrodes, respectively. The reference electrode (SCE) was connected to the electrochemical system through a Luggin capillary prepared using saturated KCl solution and agar–agar. The open circuit potential (OCP) was recorded after a 600 s equilibration time, followed by a corrosion test at OCP, both by electrochemical impedance spectroscopy and Tafel's polarization methods. The surface and cross-sectional view of Ni–P alloy coatings were analysed by scanning electron microscopy (SEM, JSM-7610F from JEOL, USA) and an energy dispersive spectroscopy (EDS), respectively. The composition-dependent crystal structures of Ni–P alloy coatings were characterized by X-ray diffraction (XRD, JDX-8P, JEOL, Japan), with CuKλ radiation, λ = 1.5418 Å, as the X-ray source. The thickness of the coatings was calculated from Faradays law, while verifying it using Digital Thickness Tester (Coatmeasure M&C, ISO-17025). The hardness of the deposits was measured using the Vickers method, using Micro Hardness Tester (CLEMEX, CMT. HD, Canada). It should be noted that in pulsed DC deposition of nanolaminated multilayer Ni–P alloy coatings, at no time does the current decreases to zero unlike in regular pulse plating.
Results and discussion
Electrodeposition of monolayer Ni–P alloy
Bright, hard and adherent monolayer Ni–P alloy coatings were developed on mild steel at a known c.d. using direct current (DC), i.e., without modulation of the current pulse. The electrodeposited coatings were tested for their composition, hardness, thickness and corrosion behaviours and corresponding data are reported in Table 1.| c.d. (A dm−2) | wt% of P in deposit | CCE (%) | Vickers micro hardness (V100) (GPa) | Thickness (μm) | −Ecorr (mV vs. SCE) | icorr (μA cm−2) | CR (×10−2 mm per year) | Nature of the deposit |
|---|---|---|---|---|---|---|---|---|
| 1.0 | 1.93 | 75.3 | 2.34 | 7.9 | 551 | 38.51 | 40.65 | Bright |
| 2.0 | 4.26 | 76.1 | 2.43 | 11.4 | 532 | 29.43 | 32.85 | Bright |
| 3.0 | 6.38 | 78.1 | 2.47 | 14.1 | 496 | 25.34 | 26.84 | Bright |
| 4.0 | 9.03 | 80.3 | 2.67 | 18.3 | 513 | 12.05 | 14.24 | Bright |
| 5.0 | 12.19 | 81.1 | 2.59 | 19.4 | 456 | 17.41 | 18.7 | Bright |
| 6.0 | 13.59 | 82.1 | 2.53 | 19.8 | 505 | 23.01 | 24.12 | Bright |
The composition analysis reports shown in Table 1 evidences that the P content of the deposit increases with c.d. Furthermore, the thickness and Vickers micro hardness of the coatings were also found to increase with the c.d., as may be observed from the data in Table 1. The corrosion data showed that Ni–P coating, deposited at 4.0 A dm−2 is most protective with the least corrosion rate (CR), compared to those at other c.d.'s. Therefore, Ni–P alloy at 4.0 A dm−2 showing the least CR (14.24 × 10⁻² mm per year) was taken as the optimal coating from the proposed bath, and is represented as (Ni–P)4.0.
SEM study
The surface appearance of each electrodeposited coatings were initially inspected visually and checked for a satisfactory surface appearance with no pinhole and irregularities. The surface micrographs of the coatings were then examined by SEM. Fig. 2 shows the SEM images of Ni–P alloy coatings at different c.d.'s ranging from 1.0 to 6.0 A dm−2. It may be observed that the roughness of the coatings increased with c.d., which ended up with the formation of micro-cracks at a high c.d. The formation of micro-cracks in the deposit, characterized by high P content is due to the inherent brittle nature of P and internal stress in the deposits originated from co-deposition of hydrogen.26 Furthermore, the coatings were found to be more compact and nodular in structure with a rough surface, towards a high c.d.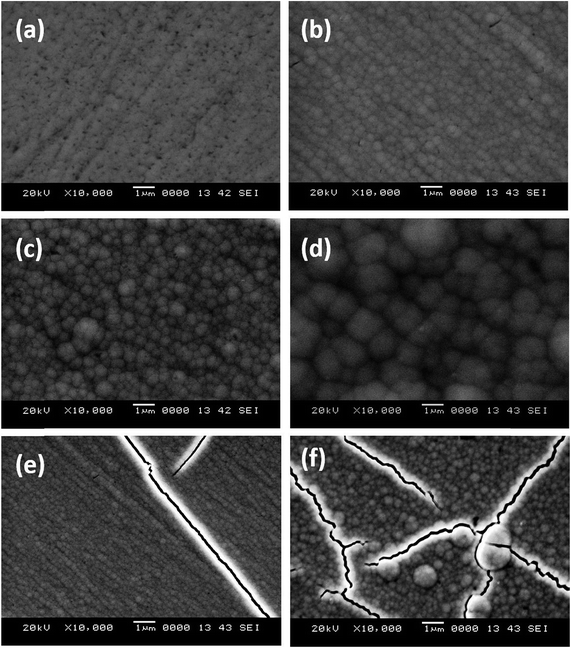 | ||
| Fig. 2 Surface morphology of Ni–P alloy coatings deposited at: (a) 1.0 A dm−2, (b) 2.0 A dm−2, (c) 3.0 A dm−2, (d) 4.0 A dm−2, (e) 5.0 A dm−2 and (f) 6.0 A dm−2. | ||
XRD
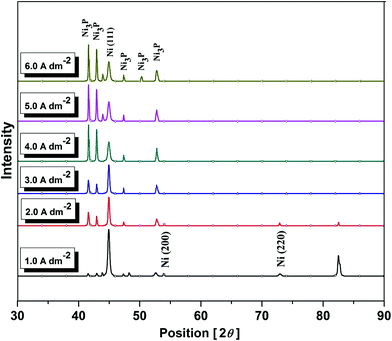
The phase structures of Ni–P coatings deposited at different c.d.'s were assessed by XRD. The phases corresponding to different c.d.'s were identified from the signals of peak profiles of the X-ray reflection plotted as a function of 2θ. Diffraction lines corresponding to both Ni and Ni3P were observed in the diffractogram, indicating the equilibrium existence of Ni and Ni3P phases in the deposits.12,16 It may be observed that as concentration of P in the deposit increased (in proportion of c.d.), the intensity of prominent Ni(111) peak in the diffraction patterns decreased gradually. The intensity of Ni(200) and Ni(220) planes, observed at low c.d. (2.0 A dm−2) were found to disappear as the c.d. increased, as observed in Fig. 3. Furthermore, the peak corresponding to mild steel (substrate) disappeared as the c.d. increased due to increased thickness of the coating. On the other hand, as the c.d. increased, more Ni3P peaks were found and their intensity increased with c.d. This is due to increased P content of alloy at which Ni(111) peak intensity disappears. This was attributed to increased stress during deposition, which resulted in precipitation of the Ni3P phase, caused by the increased P content.16,27Electrodeposition of multilayer Ni–P coatings
It is possible to control the composition and thickness of the coatings at the nano/micrometric level by regulating the c.d. and its duration. The pulsed current favour the formation of nano-laminated multilayer alloy coatings, having different compositions and grain sizes layer by layer. It should be noted that in the present study only pulsed DC is used (Fig. 1b), wherein the c.d. is cycling between two c.d.'s called cyclic cathode current densities (CCCD's), and it should not be confused with regular pulse plating wherein the current reduces to zero for every cycle, as explained in the literature.28Optimization of CCCD's
The electrodeposition and characterization of the Ni–P alloy coating showed that the proposed Ni–P alloy bath could develop coatings of different morphology, composition (62–86 wt% Ni) and phase structure over wide range of deposition c.d. (1.0–6.0 A dm−2). On the other hand, it is well known that many properties, including corrosion resistance of monolayer alloy coatings can be increased to many folds of its magnitude by the multilayer technique, despite of having same total coating thickness.29 It is due to the increased interfacial surface area affected by layering. The periodic modulation in mass transport at the cathode film (due to periodic change of c.d.) allows the growth of coating in layers, having different compositions and grain size. This leads to the formation of coatings with the number of layers separated by interfaces.Thus, guided by above mentioned facts, multilayer Ni–P alloy coatings were deposited at different sets of pulsed current densities. To optimize the CCCD's for the development of the most corrosion resistant coatings, they are developed at different sets of CCCD's with 10 layers (chosen arbitrarily), and their corrosion characters were evaluated (Table 2). It was found that CR's of multilayer Ni–P alloy coatings decreased substantially, when coatings were carried out at different sets of c.d.'s as may be observed in Table 2. Among the many sets of CCCD's tried, the least CR was observed in two sets of CCCD's, i.e., at 1.0 & 4.0 A dm−2 and 2.0 & 5.0 A dm−2. Therefore, these two sets of CCCD's have been selected for further study to determine the effects of nanolaminated coatings on the corrosion behavior.
| CCCD's (A dm−2) | −Ecorr (mV vs. SCE) | icorr (μA cm−2) | CR (×10−2 mm per year) |
|---|---|---|---|
| (Ni–P)4.0 | 513 | 12.05 | 14.24 |
![[thin space (1/6-em)]](https://www.rsc.org/images/entities/char_2009.gif) |
|||
| CMMA Ni–P coatings developed using dual pulses having difference of 3.0 A dm−2 | |||
| (Ni–P)1.0/4.0/10 | 502 | 8.15 | 10.31 |
| (Ni–P)2.0/5.0/10 | 542 | 11.21 | 12.64 |
Optimization of total number layers
The properties of electrodeposited coatings due to reduced grain size and large number of interfaces can lead to a substantial improvement in their corrosion resistance. The number of interfaces can be infinite in principle; however, they are usually up to an optimal limit.23 Therefore, by selecting 1.0 & 4.0 A dm−2 and 2.0 & 5.0 A dm−2, as two square current pulses, CMMA Ni–P alloy coatings having 10, 60, 120, 300 and 600 layers were developed. The corrosion behaviour of the multilayer Ni–P alloy at different coating configuration was studied and the experimental data are reported in Table 3.| Coating configuration | Time for each layer deposition (s) | −Ecorr (mV vs. SCE) | icorr (μA cm−2) | CR (×10−2 mm per year) |
|---|---|---|---|---|
| CMMA Ni–P coatings developed using a combination of dual pulses 1.0 and 4.0 A dm−2 | ||||
| (Ni–P)1.0/4.0/10 | 60 | 502 | 8.15 | 10.31 |
| (Ni–P)1.0/4.0/60 | 10 | 401 | 4.36 | 6.93 |
| (Ni–P)1.0/4.0/120 | 5 | 548 | 2.82 | 4.26 |
| (Ni–P)1.0/4.0/300 | 2 | 496 | 1.05 | 1.92 |
| (Ni–P)1.0/4.0/600 | 1 | 537 | 12.91 | 13.93 |
![[thin space (1/6-em)]](https://www.rsc.org/images/entities/char_2009.gif) |
||||
| CMMA Ni–P coatings developed using a combination of dual pulses 2.0 and 5.0 A dm−2 | ||||
| (Ni–P)2.0/5.0/10 | 60 | 542 | 11.21 | 12.64 |
| (Ni–P)2.0/5.0/60 | 10 | 560 | 9.13 | 10.86 |
| (Ni–P)2.0/5.0/120 | 5 | 538 | 5.83 | 8.97 |
| (Ni–P)2.0/5.0/300 | 2 | 419 | 2.13 | 4.46 |
| (Ni–P)2.0/5.0/600 | 1 | 412 | 13.12 | 14.18 |
It is important to note that corrosion rates of multilayer coatings, having (Ni–P)1.0/4.0/300 and (Ni–P)2.0/5.0/300 configurations are least compared to monolayer (Ni–P)4.0 coatings (Table 3). This indicates that layered coating has its effect in decreasing the corrosion rate. On the other hand, despite of having the same degree of layering (300 layers), the (Ni–P)1.0/4.0/300 coating showed a lower corrosion rate than the (Ni–P)2.0/5.0/300 coating (Table 3). It evidences the fact that not only the number of layers, but also their composition determines the performance of coatings. Thus, better corrosion protection of multilayer Ni–P alloy coating is a combined effect of both the thickness and composition of the individual layers.
It is interesting to note that the CR's of multilayer Ni–P alloy coatings decreased with the number of layers up to 300 layers in both sets of CCCD's, and then started increasing, as reported in Table 3. The increase of CR at a high degree of layering, i.e., at 600 layers (for (Ni–P)1.0/4.0/600 and (Ni–P)2.0/5.0/600), was attributed to the diffusion of nanolayer coatings. It may be explained as follows: as a larger numbers of layers are allowed to form in same time duration, the time for the deposition of each layer, for example (Ni–P)1.0 is small (as total time for deposition remains same, 10 min). Owing to short pulse duration (1 second), there is no sufficient time for metal ions to relax (against diffusion under applied c.d.) and to deposit on the cathode with a distinct interface.30,31 Therefore, at high degree of layering no modulation in composition is likely to happen. Therefore, at a higher degree of layering, the multilayer Ni–P alloy coating tends to become a monolayer. Therefore, the CR's of the multilayer coatings having 600 layers was found to be very high and almost the same as that of the monolithic coating developed at 4.0 A dm−2.
The experimental results showed that CMMA (Ni–P) coating deposited at 1.0 and 4.0 A dm−2 combination, having 300 layers, represented by (Ni–P)1.0/4.0/300 showed the least CR (1.92 × 10⁻² mm per year) in the 5% NaCl medium, compared to its monolayer (Ni–P)4.0 alloy coating (14.24 × 10⁻² mm per year), deposited from the same bath for the same duration of time. Therefore, the optimal coating configuration proposed for deposition of multilayer coating from the proposed bath is CMMA (Ni–P)1.0/4.0/300. The total thickness of the coating under optimal configuration, i.e., for (Ni–P)1.0/4.0/300, was found to be about 16 μm. Therefore, the average thickness of the individual layers was estimated to be in the range of 53 nm.
Corrosion study
The corrosion behaviour of multilayer Ni–P alloy coatings were studied by electrochemical methods, namely, Tafel's polarization and electrochemical impedance spectroscopy (EIS) methods, and the experimental observations are reported below.Tafel's polarization study
Tafel's extrapolation method was employed for determining the corrosion current density (icorr) and thereby the corrosion rates of the coatings. The potentiodynamic polarization behaviour of CMMA (Ni–P)1.0/4.0 coatings at different number of layers are shown in Fig. 4 (only representative) and their corrosion data are given in Table 3.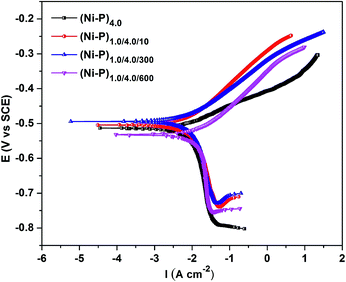 | ||
| Fig. 4 Potentiodynamic polarization behaviour of CMMA (Ni–P) alloy coatings having different degrees of layering in a 5% NaCl medium. | ||
Electrochemical impedance study
The Nyquist plots obtained for the CMMA coatings with different number of layers was studied in a 5% NaCl solution, as shown in Fig. 5. The Nyquist plots were obtained for all the CMMA coatings in the frequency range of 10 KHz–0.01 Hz. They were found to be a depressed semicircle in nature with one capacitive loop, as shown in Fig. 5. These depressed semicircles of impedance were attributed to the frequency dispersion of the interfacial impedance, and this anomalous flattening behavior is due to the inhomogeneity of the metal surface arising from surface roughness or interfacial phenomena arises during plating.32 The nature of the Nyquist response indicates that the same corrosion protection mechanism is followed in the coatings of all configurations. High polarization resistance (Rct) or charge transfer resistance corresponding to (Ni–P)1.0/4.0/300 coatings, with large capacitive loop indicates that it is the most corrosion resistant of all the coatings examined.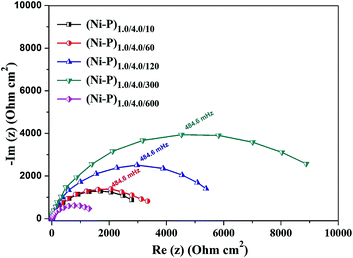 | ||
| Fig. 5 Nyquist plots of the CMMA (Ni–P)1.0/4.0 coatings with different degrees of layering showing increase of Rct with increasing number of layers. | ||
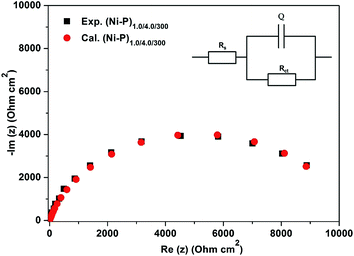
Electrical interface between the electrodeposit and corrosion medium, corresponding to the (Ni–P)1.0/4.0/300 configuration was modelled with an electrochemical equivalent (ECE) circuit, using Zsimpwin software. Good agreement between the experimental and simulated electrochemical responses was found, as shown in Fig. 6. An ECE circuit consisted of solution resistance (Rs), double layer capacitance (Q) and polarization resistance (Rct), in which the Q and Rct are parallel to each other was simulated and is shown in the inset of Fig. 6. The values of the circuit elements, namely, Rs, Rct and Q, were determined and are presented in Table 4. The solution resistance Rs was found to be almost constant, as shown in Table 4. This is because the same bath chemistry and cell configurations were used for the corrosion study. The value of Rct showed that the corrosion protection efficacy of the (Ni–P)1.0/4.0 coatings increased progressively with increasing number of layers only up to 300 layers and then decreased. The decreased capacitance, Q, due to layering, only up to 300 layers resulted in decreased electrical conductivity of the coatings.
| Coating configuration | Rs (Ohm) | Rct (Ohm) | Q (μF) |
|---|---|---|---|
| (Ni–P)1.0/4.0/10 | 0.9246 | 2786.4 | 75.5 |
| (Ni–P)1.0/4.0/60 | 0.9124 | 3356.2 | 35.2 |
| (Ni–P)1.0/4.0/120 | 0.8956 | 5432.0 | 32.1 |
| (Ni–P)1.0/4.0/300 | 0.9431 | 8864.1 | 23.7 |
| (Ni–P)1.0/4.0/600 | 0.8957 | 1431.0 | 178.2 |
SEM analysis of multilayer coating
The formation of laminar coatings having successive layers of alloys of different compositions was confirmed by scanning electron microscopy (SEM). Having been limited by the high resolution of SEM (for examining the formation of laminar coatings having a larger number of layers), the cross sectional view of multilayer coating having a (Ni–P)1.0/4.0/6 configuration is shown in Fig. 7. An inspection of the microscopic appearance of the coating confirmed the formation of 6 layers of alloys having alternatively different compositions, as shown in Fig. 7.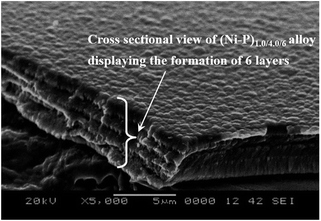 | ||
| Fig. 7 Cross-section SEM image of the (Ni–P)1.0/4.0/6 coating showing the formation of a laminar coatings having 6 layers of different compositions. | ||
Mechanism of corrosion
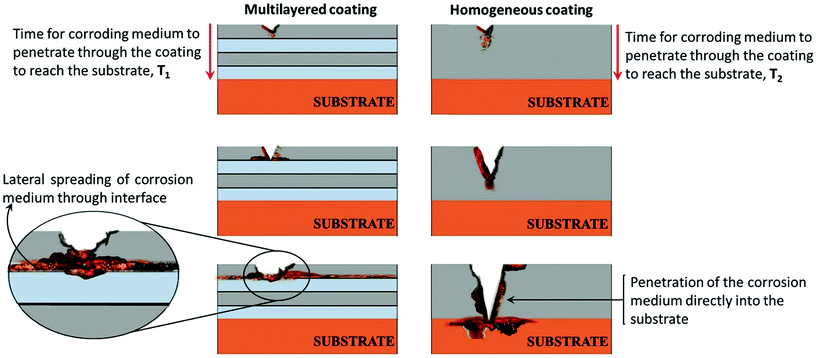
The increased corrosion protection of the CMMA (Ni–P)1.0/4.0/300 coatings in relation to its monolayer alloy coating was attributed to the selective dissolution of layers of different compositions, as envisaged by Fei and Wilcox.32 The mechanism of the increased corrosion protection of multilayer coatings, in relation to its monolayer coating can be explained by a pictorial representation shown in Fig. 8. Herein, multilayer coating having 4 layers and its monolayer coating represented as (Ni–P)1.0/4.0/4 and (Ni–P)4.0, respectively, are considered.In the schematic, it may be observed that a multilayer (Ni–P)1.0/4.0/4 coating having 2 layers of alloys with one composition (sky blue colour) alternated by 2 layers of alloys with a different composition (grey colour), gives better protection to the substrate than its monolayer alloy coating of the same thickness. The enhanced corrosion protection mechanism of CMMA coatings can be explained as follows. When the coating is carried out in multilayers, the number of interfaces, separating the alloys of the two different compositions also increases. In CMMA (Ni–P)1.0/4.0 coating, the (Ni–P)4.0 top layer corrodes slowly, than the beneath the layer (Ni–P)1.0. The variation in the composition of successive layers results a significant change in the phase structures; therefore, when top layer is exposed directly to the corrosion medium it corrodes first while protecting the underlying layer. The lower layers are safe until the breakdown of the uppermost layers occurs. This leads to the spreading of corrosion product laterally at the interface. Once the breakdown of top layer takes place, the second layer is exposed to the corrosive medium and this repeats layer after layer. As the number of layers increased, the corrosive agent requires more time to penetrate through the coating and then into the substrate. Owing to this process, the corrosive agent path is extended or blocked.30,33 However, in the case of a monolayer, or non-nanostructured/bulk coating, corrosion occurs unabatedly and the corrosive agent reaches the substrate very fast, as shown in Fig. 8b. Thus, the increased corrosion protection of the multilayer coating is due to increase in the number of interfaces formed due to layering, compared to its monolayer coating. The interfaces allows spreading of the corrosive medium laterally and delays the attacking of the substrate,29,34,35 as shown diagrammatically in Fig. 8a. It may also be concluded from the figure (Fig. 8) that the time required for the corroding medium to reach the substrate by penetrating through the multilayer coating (T1) is much greater than that through the monolayer coating (T2), i.e. T1 > T2.
Conclusions
Multilayer Ni–P alloy coatings were developed for better corrosion protection of mild steel and based on the experimental results following observations were made as conclusions.1. A new citrate bath was reported with optimal conditions for the electrodeposition of bright monolayer Ni–P alloy coatings on mild steel using glycerol as additive.
2. The corrosion resistance of the monolayer Ni–P alloy coatings was increased many fold by nanolaminated multilayer alloy coating technique using pulsed DC.
3. Electrochemical corrosion study demonstrated that multilayer Ni–P alloy coating having 300 layers, which is represented as (Ni–P)1.0/4.0/300, is showing the least CR compared to its monolayer (monolithic or homogenous) coatings, developed from the same bath using non pulsed DC.
4. The better corrosion protection of the multilayer Ni–P alloy coating compared to its monolayer counterpart is a combined effect of both the thickness and composition of individual layers.
5. The drastic improvement in the corrosion protection of the multilayer Ni–P alloy coatings were attributed to the increase in the number of interfaces, separating layers of alloys having different compositions and phase structures.
6. The corrosion protection efficacy of multilayer coatings were found to increase with increasing number of layers only up to the optimal level and then decreased.
Acknowledgements
Mr Liju Elias acknowledges the National Institute of Technology Karnataka (NITK), Surathkal, India for financial support in the form of Institute Fellowship.References
- T. S. N. Sankara Narayanan and S. K. Seshadri, Electro- and electroless plated coatings for corrosion protection, Narosa Publishing House, 2008, pp. 177–221 Search PubMed.
- S. S. Tulsi, Trans. Inst. Met. Finish., 1986, 64, 73–76 CAS.
- K. Parker, Plat. Surf. Finish., 1992, 79, 29–33 CAS.
- J. E. Williams and C. Davison, J. Electrochem. Soc., 1990, 137, 3260–3269 CrossRef CAS.
- I. Paseka and J. Velicka, Electrochim. Acta, 1997, 42, 237–242 CrossRef CAS.
- T. Burchardt, Int. J. Hydrogen Energy, 2001, 26, 1193–1198 CrossRef CAS.
- S. Armyanov, S. Vitkova and O. Blajiev, J. Appl. Electrochem., 1997, 27, 185–191 CrossRef CAS.
- S. Sakai, S. Nakanishi and Y. Nakato, J. Phys. Chem. B, 2006, 110, 11944–11949 CrossRef CAS PubMed.
- D. P. Weston, S. J. Harris, P. H. Shipway, N. J. Weston and G. N. Yap, Electrochim. Acta, 2010, 55, 5695–5708 CrossRef CAS.
- Y. Zeng, Z. Li, M. Ma and S. Zhou, Electrochem. Commun., 2000, 2, 36–38 CrossRef CAS.
- L. Elias and A. C. Hegde, Surf. Coat. Technol., 2015, 283, 61–69 CrossRef CAS.
- T. Mahalingam, M. Raja, S. Thanikaikarasan, C. Sanjeeviraja, S. Velumani, H. Moon and Y. D. Kim, Mater. Charact., 2007, 58, 800–804 CrossRef CAS.
- Y. Gao, Z. J. Zheng, M. Zhu and C. P. Luo, Mater. Sci. Eng., A, 2004, 381, 98–103 CrossRef.
- A. Brenner, Electrodeposition of alloys: principles and practice, Elsevier, New York, 1963, vol. 1–2 Search PubMed.
- R. K. Shervedani and A. Lasia, J. Electrochem. Soc., 1997, 144, 511–519 CrossRef.
- R. Narayan and M. N. Mungole, Surf. Coat. Technol., 1985, 24, 233–239 CrossRef CAS.
- A. Królikowski and P. Butkiewicz, Electrochim. Acta, 1993, 38, 1979–1983 CrossRef.
- U. Hofmann and K. G. Weil, Berichte der Bunsen-Gesellschaft für Physikalische Chemie, 1991, 95, 1482–1484 CrossRef CAS.
- K.-H. Hur, J.-H. Jeong and D. N. Lee, J. Mater. Sci., 1990, 25, 2573–2584 CrossRef CAS.
- M. R. Kalantary, G. D. Wilcox and D. R. Gabe, Br. Corros. J., 1998, 33, 197–201 CrossRef CAS.
- S. Yogesha and A. C. Hegde, J. Mater. Process. Technol., 2011, 211, 1409–1415 CrossRef CAS.
- D. M. Tench and J. T. White, J. Electrochem. Soc., 1990, 137, 3061–3066 CrossRef CAS.
- N. Kanani, Electroplating: basic principles, processes and practice, Elsevier, 2004 Search PubMed.
- S. Roy, in Electrochemistry at the Nanoscale, Springer, 2009, pp. 349–376 Search PubMed.
- N. V. Parthasaradhy, Practical Electroplating Handbook, Prentice-Hall, Inc., USA, 1989, p. 1444 Search PubMed.
- R. K. Shervedani and A. Lasia, J. Electrochem. Soc., 1997, 144, 511–519 CrossRef.
- A. M. Pillai, A. Rajendra and A. K. Sharma, J. Coat. Technol. Res., 2012, 9, 785–797 CrossRef CAS.
- M. S. Chandrasekar and M. Pushpavanam, Electrochim. Acta, 2008, 53, 3313–3322 CrossRef CAS.
- V. Thangaraj, N. Eliaz and A. C. Hegde, J. Appl. Electrochem., 2009, 39, 339–345 CrossRef CAS.
- P. Leisner, C. B. Nielsen, P. T. Tang, T. C. Dörge and P. Møller, J. Mater. Process. Technol., 1996, 58, 39–44 CrossRef.
- Y. Ullal and A. C. Hegde, Appl. Phys. A: Mater. Sci. Process., 2014, 116, 1587–1594 CrossRef CAS.
- J.-Y. Fei and G. D. Wilcox, Electrochim. Acta, 2005, 50, 2693–2698 CrossRef CAS.
- K. Venkatakrishna and A. C. Hegde, J. Appl. Electrochem., 2010, 40, 2051–2059 CrossRef CAS.
- C. Gu, J. Lian, G. Li, L. Niu and Z. Jiang, Surf. Coat. Technol., 2005, 197, 61–67 CrossRef CAS.
- C. Gu, J. Lian and Z. Jiang, Adv. Eng. Mater., 2005, 7, 1032–1036 CrossRef CAS.
| This journal is © The Royal Society of Chemistry 2016 |

