Fluorescence staining of salicylaldehyde azine, and applications in the determination of potassium tert-butoxide

Jinlai Yanga, Jian Ruia, Xu Xuabc, Yiqin Yangd, Jun Sua, Haijun Xuab, Yunyun Wanga, Nan Suna and Shifa Wang*ab
aCollege of Chemical Engineering, Nanjing Forestry University, Nanjing, Jiangsu 210037, People's Republic of China. E-mail: wangshifa65@163.com; Fax: +86 25 85427812; Tel: +86 25 85427812
bJiangsu Key Lab of Biomass-based Green Fuels and Chemicals, Nanjing 210037, People's Republic of China. E-mail: wangshifa65@163.com; Fax: +86 25 85427812; Tel: +86 25 85427812
cGuangxi Key Laboratory of Chemistry and Engineering of Forest Products, Nanning, Guangxi 530008, People's Republic of China
dInstitute of Light Industry Science and Engineering, Nanjing Forestry University, Nanjing, Jiangsu 210037, People's Republic of China

Received 13th January 2016 , Accepted 11th March 2016

First published on 18th March 2016


Abstract

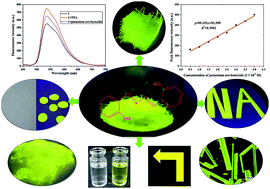
Salicylaldehyde azine (1), with an aggregation-induced emission (AIE) function, was synthesized from salicylaldehyde and characterized by Fourier transform infrared spectroscopy (FT-IR), nuclear magnetic resonance (NMR), high resolution mass spectrometry (HRMS), and X-ray single crystal diffraction. Compound 1 exhibited high thermal stability and good light-emitting behavior in the solid state. It could be preferably used to dye cellulose and KBr. No obvious changes in fluorescence intensity occurred when compound 1 was dissolved in different pH buffer solutions. The addition of TFA led to slight fluorescence quenching, and the fluorescence intensity gradually increased with increasing potassium tert-butoxide solution concentrations. The fluorescence intensity of compound 1 showed a good linear relationship with the concentration of potassium tert-butoxide (0.5–4.0 × 10⁻⁴ M), y = 99.193x + 93.599, R2 = 0.9902; the limit of detection (LOD) was 1.07 × 10⁻⁷ M. It could measure the content of potassium tert-butoxide with a relative standard deviation (RSD) value of 1.5%.

1. Introduction

In recent years, new organic fluorescent probes1–9 and solid light-emitting materials10–16 have been greatly described due to their good utility in fluorescence. Many fluorescent compounds with a fluorescence enhancement function in the solution state exhibit fluorescence quenching in the solid state. This has limited the development of fluorescence dyes.17 Some fluorescent compounds have been successfully synthesized to overcome this disadvantage such as polythiophene and its derivatives,18,19 as well as tetraphenylethene derivatives,20 1-methyl-1,2,3,4,5-pentaphenylsilole,21 and p-sexiphenyl.22

Concurrently, some studies on salicylaldehyde azines have been reported including pharmacological proprieties23,24 and optical properties.25,26 The AIE characteristic of salicylaldehyde azine was first fully studied by Tang.27 In addition, two-photon absorption and two-photon excitation fluorescence of salicylaldehyde azines were investigated.28 This was also used as a simple fluorescent probe for Zn(II).29 Next, some derivatives of salicylaldehyde azine were synthesized for optical application. A novel fluorescence turn-on detection method in human serum albumin (HSA) and bovine serum albumin (BSA) in aqueous solution was investigated with 2,4-dihydroxyl-3-iodo salicylaldehyde azine.30 Meanwhile, chloro-salicylaldehyde azine and bromo-salicylaldehyde azine exhibited AIEE properties and iodo-salicylaldehyde azine could be applied as a turn-on fluorescence probe for egg albumin detection.31

Anti-counterfeiting technologies in paper products (banknote) are very important.32,33 Fluorescent materials can identify the source information after being irradiated, and fluorescence plays a very important role in the field of anti-counterfeiting.34–36 Because of good light-emitting behavior, favorable permeability and adhesive force with cellulose, compound 1 could be used an anti-counterfeiting material and dye.

Potassium tert-butoxide is an important catalyst and can also be employed in organic synthesis for condensation, rearrangement, ring-opening, etc.37–40 However, the main method to detect the content of potassium tert-butoxide is titration.41 Thus, it would be useful to detect the content of potassium tert-butoxide. In this paper, compound 1 was used to fluorescently detect potassium tert-butoxide.

2. Experimental

2.1. Materials and instruments

All the raw materials and solvents were purchased from commercial suppliers and used without further purification. 1H-NMR and 13C-NMR spectra were recorded on a Bruker 500 MHz FT-NMR spectrometer in DMSO with TMS as internal standard, respectively. Fourier-transform infrared (FT-IR) spectra were recorded on a Nicolet 380 FT-IR spectrophotometer. Melting points were measured using an X-6 microscopic melting point apparatus. UV-vis absorption spectra were measured on a UV-2450 spectrophotometer (SHIMADZU) using a quartz cuvette with a 1 cm path length. Fluorescence emission spectra were determined on a Perkin Elmer LS 55 fluorescence spectrophotometer, excitation wavelength at 385 nm, scan from 450 nm to 750 nm with a 100 nm min−1 of scan speed. Fluorescence microscopic images were photographed with a fluorescence microscopic imaging system (BX51 Olympus). X-ray data were collected on a Bruker D8 Venture area diffractometer. Confocal fluorescence microscopic images were read on a LSM710 confocal laser scanning microscopy.

2.2. Synthesis of compound 1

A 250 mL dried three-necked flask equipped with a thermometer, stirrer and condenser was charged with salicylaldehyde (2.44 g, 20 mmol), and hydrazine hydrate (0.63 g, 10 mmol) in 100 mL of ethanol. Then the resulting mixture was refluxed for 2 h with a large amount of precipitation appeared (Scheme 1).29 The precipitation was also refluxed with 1 mL hydrochloric acid for 1 h in 100 mL of ethanol to offer the reaction products, which was purified twice by recrystallization with 100 mL ethanol. Acicular yellow crystal; yield of 90%; mp: 227.2–227.4 °C; FT-IR (KBr) ν (cm−1): 3436, 1623, 1575, 1486, 1402, 752; 1H NMR (DMSO-d6, 300 MHz): 6.89–6.94 (t, 4H), 7.32–7.37 (m, 2H), 7.63–7.65 (d, 2H), 8.95 (s, 2H), 11.07 (s, 2H); 13C NMR (DMSO-d6, 75 MHz), δ (ppm): 116.48, 118.15, 119.54, 130.82, 133.16, 158.61, 162.75; HRMS (m/z): [M + H]+ calcd for C14H12N2O2 + H+, 241.0971; found, 241.0959.
image file: c6ra01035k-s1.tif
Scheme 1 Synthesis of compound 1.

3. Results and discussion

3.1. Synthesis

Compound 1 was first synthesized by a reaction of salicylaldehyde and hydrazine hydrate. The compound was characterized by HRMS, IR, 1H-NMR, 13C-NMR, and X-ray single crystal diffraction (Table S1, ESI and Fig. 1). These analyses confirmed compound 1 to be a salicylaldehyde azine.
image file: c6ra01035k-f1.tif
Fig. 1 X-Ray crystal structure of compound 1.

3.2. Thermal stability

Good thermal stability is required for fluorescence dyes, and we assessed this for compound 1 using TGA under a nitrogen stream (Fig. S1, ESI). Compound 1 was thermally stable up to ca. 232 °C corresponding to a 5% of the material weight loss. Thus, compound 1 had good thermal stability.

3.3. Solid state fluorescence properties

3.3.1. Fluorescence enhancement properties. Stable light-emitting behavior in the solid state is the foundation of fluorescence. Fig. 2a and b show that compound 1 has good fluorescence and emits Kelly light. To study pH effects, three KBr pellets were prepared for fluorescence analysis after evenly grinding three different mixtures (a mixture of 1.0 g KBr and 1.0 × 10⁻⁶ mol compound 1; a mixture of 1.0 g KBr, 1.0 × 10⁻⁶ mol compound 1 and 1.0 × 10⁻⁶ mol TFA; a mixture of 1.0 g KBr, 1.0 × 10⁻⁶ mol compound 1 and 1.0 × 10⁻⁶ mol potassium tert-butoxide). The addition of TFA or potassium tert-butoxide enhanced the fluorescence (Fig. 2b). TFA had the most pronounced effects. Thus, the addition of an organic acid or alkali could not lead to fluorescence quenching in the solid state.
image file: c6ra01035k-f2.tif
Fig. 2 (a) Fluorescence microscopic images (upper) and microscopic images (lower) of compound 1. (b) The fluorescence intensity of compound 1 as a KBr pellet was affected by TFA and potassium tert-butoxide (λex385 nm). Inset is a photo of compound 1 under a 365 nm light.
3.3.2. Application of compound 1. Compound 1 solution (1.0 × 10⁻³ M) was used to dye filter paper, pledget, cotton and KBr. The images were obtained under sunlight and 365 nm UV light (Fig. 3). Under sunlight, the color of the dyed materials changed only a little, but they emitted strong Kelly light under 365 nm irradiation and could be a fluorescence dye. Confocal fluorescence microscopy images showed the microstructures of these dyed materials (Fig. S2). Compound 1 had good permeability with cellulose and was well-mixed with KBr. Then, an anti-counterfeiting icon was prepared with compound 1 and filter paper (Fig. S3). The icon was not seen under the sunlight, but it was very clear under a 365 nm irradiation. Compound 1 could also be used to indicate devices at night (Fig. S4).
image file: c6ra01035k-f3.tif
Fig. 3 Photographs of filter paper (a), pledget (b), cotton (c) dyed by compound 1 (1.0 × 10⁻³ M) and a mixture of compound 1 and KBr powder (1.0 × 10⁻⁶ mol g−1, d) under sunlight (left) and 365 nm UV light (right).

We next studied the pH effects of compound 1 (1 × 10⁻⁴ M) with solutions of buffered 4-(2-hydroxyethyl)-1-piperazineethanesulfonic acid (HEPES, 20 mM, 90% (v/v) C2H5OH) (Fig. S5). The fluorescence intensity had no significant change in different pH values; there was no fluorescence quenching. This showed that compound 1 was stable, and its fluorescence intensity was pH-stable. The adhesive force and influence of light on compound 1 and the substrate were other important factors influencing the applications. Thus, a study on adhesive force and influence by light was finished (Fig. S6–S8). No significant fluorescence quenching occurred after the dyed pledget and filter paper were washed with water for 5 min and treated with sunlight for 120 h. There was no fluorescence when they were washed at the same time with ethanol due to the dye's solubility in ethanol. The results showed that compound 1 had good adhesive force because it could not be easily washed off by water. The light stability test also proved that compound 1 was stable on the substrate.

3.4. Optical properties in solution

Compound 1 was readily soluble in methanol, ethanol, isopropanol, ethyl acetate, trichloromethane, dichloromethane, and cyclohexane. UV-vis absorption and fluorescence spectra of compound 1 in these solvents (1 × 10⁻⁴ M) were studied (Fig. S9, ESI). Compound 1 had two absorption maximum peaks at 294 nm and 357 nm, and there were no significant changes in different solvents (Fig. S9a). In contrast, the fluorescence intensity was markedly affected by solvents (Fig. S9b). A methanol solution of compound 1 had a peak intensity at 540 nm, but other solutions red-shifted from 540 nm to 550 nm. These solutions of compound 1 had good fluorescence after dissolution in cyclohexane, trichloromethane, dichloromethane, or isopropanol.

To further study the stabilities of compound 1 affected by TFA or potassium tert-butoxide in solution, the UV-vis absorption and fluorescence spectra of compound 1 in ethanol (1.0 × 10⁻⁴ M) with different equivalents of TFA or potassium tert-butoxide were shown in Fig. S10 and 4.


image file: c6ra01035k-f4.tif
Fig. 4 UV-vis absorption spectral change (a) and fluorescence spectral change (b) of compound 1 in ethanol (1.0 × 10⁻⁴ M) with different molar ratios of potassium tert-butoxide and compound 1. The fluorescence intensity of compound 1 in ethanol (1 × 10⁻⁴ M) with equal K+ (c) and other metal ions (d), λex385 nm.

Fig. S10a shows that the absorbance peak was stable with increasing TFA, but the fluorescence intensity was affected by increased TFA. This lead to a slight decrease without minimal changes (Fig. S10b). Compound 1 has two nitrogen atoms and two sites to bind protons.42 The two nitrogen atoms were unaffected by H+, and the UV-vis absorption and fluorescence spectra were stable. Thus, the structure of compound 1 was stable.

Versus Fig. S10a, the absorbance of compound 1 was markedly affected by potassium tert-butoxide (Fig. 4a). The color turned from colorless to yellow when the solution of compound 1 had more than 2 equivalents of potassium tert-butoxide. The absorbance of the two peaks at 294 nm and 356 nm decreased gradually with the addition of an increasing potassium tert-butoxide. A new absorption peak appeared at 411 nm when the molar ratio of potassium tert-butoxide and compound 1 was 1[thin space (1/6-em)]:[thin space (1/6-em)]1. An obvious absorption peak emerged after more than 2 equivalents of potassium tert-butoxide were added to the solution. That is, the color change indicated a response.

The fluorescence spectra of compound 1 in ethanol (1.0 × 10⁻⁴ M) with different equivalents of potassium tert-butoxide are also provided (Fig. 4b). Fluorescence enhancement occurred, and the intensity increased as a function of potassium tert-butoxide concentration. The peak fluorescence intensity increased rapidly with potassium tert-butoxide concentration until 4 equivalents were added at which point it plateaued.

To study the mechanism, the impact of K+ and OH was analyzed (Fig. 4c). Except potassium tert-butoxide, the addition of monopotassium phosphate, potassium sulphate, potassium carbonate, potassium fluoride, or potassium hydroxide, led to no significant fluorescence enhancement. Potassium hydroxide had OH, which could only lead to a slight fluorescence enhancement. The –OH of compound 1 might lead to deprotonation with OH,42 but this was not the main reason for fluorescence enhancement. To further understand the mechanism, the fluorescence intensity of compound 1 (1 × 10⁻⁴ M) and equal metal ion concentrations in ethanol solution were discussed (Fig. 4d). The system with Zn2+ also had fluorescence enhancement, which agreed with the simple fluorescent probe data.29 No significant fluorescence change occurred when other metal ions were added to the solution. The solution with compound 1 and Cu2+ had quenching.

There are many reasons why Zn2+ might enhance fluorescence.43–45 The unfixed C[double bond, length as m-dash]N structure is non-fluorescent due to the predominant decay process of C[double bond, length as m-dash]N isomerization in the excited states. After complexing with metal ions, the fluorescence increases strongly because it restricts the rotation of the C[double bond, length as m-dash]N bond and leads to the suppression of C[double bond, length as m-dash]N isomerization. The reason for potassium tert-butoxide causing fluorescence enhancement might be a complexation reaction with compound 1, which maintains the Zn2+ condition. Mass spectrometry (MS) of compound 1 without and with equivalent of potassium tert-butoxide in ethanol (1 × 10⁻⁴ M) were measured by LC-MS (Fig. S11). It was clear to see that the m/z = 241.3 peak was for compound 1 and another m/z = 375.1 peak was for the complex of compound 1 and potassium tert-butoxide (the stoichiometric ratio was 1[thin space (1/6-em)]:[thin space (1/6-em)]1).

Fig. 5 depicts a good linear relationship of the peak fluorescence intensity and concentration of potassium tert-butoxide (0.5–4.0 × 10⁻⁴ M), y = 99.193x + 93.599, R2 = 0.9902. The limit of detection (LOD) for determining potassium tert-butoxide was 1.07 × 10⁻⁷ M using 3σbi/m,46 where σbi is the standard deviation of six groups of blank signals; m is the slope of the linear calibration plot. To detect the content of potassium tert-butoxide purchased from the supplier, two samples of compound 1 (1 × 10⁻⁴ M) with potassium tert-butoxide were prepared (Table S2). The content was calculated after measuring the peak fluorescence intensity of the two samples. The two content were calculated to be 97.81% and 99.91%. The concentration of potassium tert-butoxide was successfully measured via this new method with a RSD of 1.5%. This highlights the utility of compound 1.


image file: c6ra01035k-f5.tif
Fig. 5 The linear relationship of peak fluorescence intensity and the concentration of potassium tert-butoxide.

4. Conclusion

Salicylaldehyde azine (1) was directly synthesized from salicylaldehyde. Compound 1 had good fluorescence, thermal stability, adhesive forces, and light stability in the solid state. The dye could be used to dye filter paper, pledget, cotton and KBr. It is a candidate material for anti-counterfeiting and is a fluorescence indicator. Compound 1 was stable at different pH values in the solution state and was not quenched by TFA. However, the fluorescence intensity of compound 1 gradually increased with increasing potassium tert-butoxide concentrations. A good linear relationship of the peak fluorescence intensity and concentration of potassium tert-butoxide (0.5–4.0 × 10⁻⁴ M) was also obtained (y = 99.193x + 93.599, R2 = 0.9902); the LOD was 1.07 × 10⁻⁷ M. This is new tool to measure potassium tert-butoxide concentrations, and it increases the value of salicylaldehyde azine.

Acknowledgements

The authors gratefully acknowledge the project supported by the Doctorate Fellowship Foundation of Nanjing Forestry University (2013), the Ordinary University Graduate Student Scientific Research Innovation Projects of Jiangsu Province (Supported by Province, 2014, KYZZ-0252), the Recommend International Advanced Forestry Science and Technology Project (2013-4-05), the Committee of National Science Foundation of China (Grant No. 31470592 and 31170538), the Open Foundation Jiangsu Province Biomass Energy and Material Laboratory (JSBEM2014010), the University Science Research Project of Jiangsu Province (14KJA220001), the Natural Science Foundation of Jiangsu Province (Grants No. BK20140973) and Specialized Research Fund for the Doctoral Program of Higher Education (20123204120010). We thank LetPub (http://www.letpub.com) for its linguistic assistance during the preparation of this manuscript.

Notes and references

  1. C. Y. Li, F. Xu, Y. F. Li, K. Zhou and Y. Zhou, ‎Inorg. Chim. Acta, 2012, 717, 122–126 CrossRef CAS PubMed.
  2. M. R. Ganjali, M. Hosseini, A. Ghafarloo, M. Khoobi, F. Faridbod, A. Shafiee and P. Norouzi, Mater Sci Eng C, 2013, 33, 4140–4143 CrossRef CAS PubMed.
  3. Z. Z. Wu, W. Y. Li, J. Chen and C. Yu, Talanta, 2014, 119, 538–543 CrossRef CAS PubMed.
  4. A. K. Deka and R. J. Sarma, J. Lumin., 2014, 147, 216–222 CrossRef CAS.
  5. S. Sinha, T. Mukherjee, J. Mathew, S. K. Mukhopadhyay and S. Ghosh, J. Photochem. Photobiol., A, 2014, 277, 75–81 CrossRef CAS.
  6. Y. Ma, H. Y. Chen, F. Wang, S. Kambam, Y. Wang, C. Mao and X. Q. Chen, Dyes Pigm., 2014, 102, 301–307 CrossRef CAS.
  7. K. Dutta, R. C. Deka and D. Kumar Das, Spectrochim. Acta, Part A, 2014, 124, 124–129 CrossRef CAS PubMed.
  8. D. Sarkar, A. Pramanik, S. Jana, P. Karmakar and T. K. Mondal, Sens. Actuators, B, 2015, 209, 138–146 CrossRef CAS.
  9. M. Hagimoria, T. Temma, N. Mizuyamac, T. Utod, Y. Yamaguchi, Y. Tominaga, T. Mukaia and H. Saji, Sens. Actuators, B, 2015, 213, 45–52 CrossRef.
  10. T. Z. Yu, P. Zhang, Y. L. Zhao, H. Zhang, J. Meng, D. W. Fan, L. L. Chen and Y. Q. Qiu, Org. Electron., 2010, 11, 41–49 CrossRef CAS.
  11. H. Gao, J. Song, X. W. Zhang, S. B. Shang and Z. Q. Song, Tetrahedron, 2013, 69, 8405–8411 CrossRef CAS.
  12. X. Li, H. J. Chi, G. H. Lu, G. Y. Xiao, Y. Dong, D. Y. Zhang, Z. Q. Zhang and Z. Z. Hu, Org. Electron., 2012, 13, 3138–3144 CrossRef CAS.
  13. M. Cretich, C. Galati, L. Renna, G. G. Condorelli, P. Gagni and M. Chiari, Sens. Actuators, B, 2014, 192, 15–22 CrossRef CAS.
  14. M. Wang, G. X. Zhang and D. Q. Zhang, J. Mater. Chem., 2010, 20, 1858–1867 RSC.
  15. A. Holländer, S. Amberg-Schwab, O. Miesbauer, K. Noller and F. A. Polo, Prog. Org. Coat., 2015, 88, 71–74 CrossRef.
  16. T. Otsubo, A. Minami, H. Fujii, R. Taguchi, T. Takahashi, T. Suzuki, F. Teraoka and K. Ikeda, Bioorg. Med. Chem. Lett., 2013, 23, 2245–2249 CrossRef CAS PubMed.
  17. C. X. Yuan, X. T. Tao, C. Yan, L. Yang, J. X. Yang, W. T. Yu, L. Wang and M. H. Jiang, J. Phys. Chem. C, 2007, 111, 12811–12816 CAS.
  18. A. Tsumura, H. Koezuka and T. Ando, Appl. Phys. Lett., 1986, 49, 1210–1212 CrossRef CAS.
  19. M. Nagawa, R. Hibino and S. Hotta, Appl. Phys. Lett., 2002, 80, 544–546 CrossRef CAS.
  20. Y. Q. Dong, J. W. Y. Lam and A. Qin, Appl. Phys. Lett., 2007, 91, 011111–011113 CrossRef.
  21. J. D. Luo, Z. L. Xie and J. W. Lam, Chem. Commun., 2001, 18, 1740–1741 RSC.
  22. H. Yanagi, T. Ohara and T. Morikawa, Adv. Mater., 2001, 13, 1452–1455 CrossRef CAS.
  23. V. B. Kurteva, S. P. Simeonov and M. Stoilova-Disheva, Pharmacol. Pharm., 2011, 2, 1–9 CrossRef CAS.
  24. D. Li, M. X. Tan and L. Jie, Adv. Mater. Res., 2012, 396–398, 2366–2369 CAS.
  25. T. Măluţan, A. Pui, C. Măluţan, L. Tătaru and D. Humelnicu, J. Fluoresc., 2008, 18, 707–713 CrossRef PubMed.
  26. M. Ziółek, K. Filipczak and A. Maciejewski, Chem. Phys. Lett., 2008, 464, 181–186 CrossRef.
  27. W. X. Tang, Y. Xiang and A. J. Tong, J. Org. Chem., 2009, 74, 2163–2166 CrossRef CAS PubMed.
  28. A. B. Souza, M. A. R. C. Alencar, S. H. Cardoso, M. S. Valle, R. Diniz and J. M. Hickmann, Opt. Mater., 2013, 35, 2535–2539 CrossRef CAS.
  29. D. X. Xie, Z. J. Ran, Z. Jin, X. B. Zhang and D. L. An, Dyes Pigm., 2013, 96, 495–499 CrossRef CAS.
  30. X. T. Chen, Y. Xiang and A. J. Tong, Talanta, 2010, 80, 1952–1958 CrossRef CAS PubMed.
  31. X. T. Chen and A. J. Tong, J. Lumin., 2014, 145, 737–740 CrossRef CAS.
  32. B. Hardwick, W. Jackson, G. Wilson and A. W. H. Mau, Adv. Mater., 2001, 13, 980–984 CrossRef CAS.
  33. Y. X. Zhang, K. Aslan, M. J. R. Previte and C. D. Geddes, Dyes Pigm., 2008, 77, 545–549 CrossRef CAS.
  34. C. D. Geddes and J. R. Lakowicz, J. Fluoresc., 2002, 12, 121–129 CrossRef.
  35. Z. R. Li, P. Xi, M. Zhao, X. H. Gu, Q. Y. Ma and B. W. Cheng, J. Rare Earths, 2010, 28, 211–214 CrossRef.
  36. J. S. Zhang and M. Q. Ge, J. Lumin., 2011, 131, 1765–1769 CrossRef CAS.
  37. A. A. Toutov, W. B. Liu, K. N. Betz, A. Fedorov, B. M. Stoltz and R. H. Grubbs, Nature, 2015, 518, 80–84 CrossRef CAS PubMed.
  38. D. Y. Li, K. J. Shi, X. F. Mao, Z. L. Zhao, X. Y. Wu and P. N. Liu, Tetrahedron, 2014, 70, 7022–7031 CrossRef CAS.
  39. S. L. Yang, C. Q. Wu, M. B. Ruan, Y. Q. Yang, Y. X. Zhao, J. J. Niu, W. Yang and J. W. Xu, Tetrahedron Lett., 2012, 53, 4288–4292 CrossRef CAS.
  40. B. Movassagh and A. Rakhshani, Chin. Chem. Lett., 2011, 22, 1179–1182 CAS.
  41. A. P. Wang, R. Z. Mao, X. L. Liang, L. J. Liu, X. X. Yao and T. Zhou, Chem. Anal. Meterage, 2007, 17, 36–38 Search PubMed.
  42. A. G. Bracamonte and A. V. Veglia, J. Photochem. Photobiol., A, 2013, 261, 20–25 CrossRef CAS.
  43. J. Wu, W. Liu, J. Ge, H. Zhang and P. Wang, Chem. Soc. Rev., 2011, 40, 3483–3495 RSC.
  44. K. Shen, X. Yang, Y. X. Cheng and C. J. Zhu, Tetrahedron, 2012, 68, 5719–5723 CrossRef CAS.
  45. Z. K. Song, B. Dong, G. J. Lei, M. J. Peng and Y. Guo, Tetrahedron Lett., 2013, 54, 4945–4949 CrossRef CAS.
  46. C. Kar, M. D. Adhikari, B. K. Datta and A. Ramesh, Sens. Actuators, B, 2013, 188, 1132–1140 CrossRef CAS.

Footnote

Electronic supplementary information (ESI) available. CCDC 1436179. For ESI and crystallographic data in CIF or other electronic format see DOI: 10.1039/c6ra01035k

This journal is © The Royal Society of Chemistry 2016