
Poly(3-hydroxybutyrate-co-valerate)/poly(3-thiophene ethyl acetate) blends as a electroactive biomaterial substrate for tissue engineering application
M. S. Recco,
A. C. Floriano,
D. B. Tada,
A. P. Lemes,
R. Lang and
F. H. Cristovan*
Institute of Science and Technology, Universidade Federal de São Paulo – UNIFESP, 12231-280, São José dos Campos, SP, Brazil. E-mail: fhcristovan@unifesp.br
First published on 1st March 2016
Abstract
Polyblends of an electroactive biomaterial consisting of a biodegradable polyester – PHBV and a carboxylate polythiophene derivative, the poly(3-thiophene ethyl acetate) – PTAcEt have been prepared and applied as a substrate for tissue engineering. The biodegradable polymer was used as a matrix for polythiophene. Thermal, electrical, optical and morphological properties as well as viability and cell adhesion (in vitro assays) were investigated. Blend films exhibited high flexibility, resistance to handling and a semiconducting character, since they preserved the individual properties of each polymer. Besides, the incorporation of PTAcEt (up to 12%) has led to improvements in the thermal stability and in the crystallinity degree of the bioactive matrix. Qualitative morphological analysis showed irregular and porous surfaces; important features for growth and cell adhesion. Viability assays indicated that the polyblends promoted superior cell proliferation after 72 h exposure to mammalian cells when compared to a pure PHBV matrix. Therefore, PTAcEt showed low cytotoxicity allowing cell growth. The adhesion study revealed that the cells were able to adhere to the surface and proliferate inside the cavities of the substrate. The results indicate that the 88![[thin space (1/6-em)]](https://www.rsc.org/images/entities/char_2009.gif) :12% (PHBV:PTAcEt) blend is a promising candidate for use as scaffold in the biomedical area.
:12% (PHBV:PTAcEt) blend is a promising candidate for use as scaffold in the biomedical area.
Introduction
Metallic materials based on tungsten and platinum have been the most investigated and used as biocompatible materials in biomedical devices.1 In recent years, electroactive biomaterials that provide electrical, electrochemical or electromechanical stimulation to cells have been recognized as a new generation of smart biomaterials capable of regenerating tissues and communicating with the cells – a fascinating topic of research.2 In this context, conducting polymers (CPs) have been considered as promising organic for the production of electroactive biomaterials and present several advantages over metallic materials. For example, obtaining of flexible bioactive devices, besides a more convenient synthesis and processing. Furthermore, it can provide both conductive and biocompatible functions to biomedical devices.3,4Conducting polymers exhibit unique electronic properties due to its conjugation (alternated double bonds). In general, present good charge transport, high electronic mobility, high absorption of the visible spectrum region, high environmental stability,5 besides the softness and low price of production in comparison to inorganic materials. Indeed, CPs are investigated for several purposes such as sensors,6 photovoltaic cells,7 OLEDs8 and transistors.9 Since the CPs physicochemical properties are easily modulated just by altering their backbones with functional side chains, it is possible to apply this class of material as electroactive biomaterials3 with better biodegradability, hydrophobicity, stability and less cytotoxicity.10 In biomedical field, CPs have been used to construct neural probes,11,12 scaffolds for tissue engineering,13,14 implantable electrodes,15 artificial muscles16 and biosensors.17
Among CPs, polypyrroles has been extensively studied as electroactive biomaterial due to its good conductive property in physiological pH. Nevertheless, polythiophenes are a promising material for such application once their structure is more easily modified compared to polypyrroles.2 Recently, a polythiophene derivative, the poly(3,4-ethylenedioxythiophene) – PEDOT showed to be thermal and electrochemically more stable than polypyrroles, being a candidate for long-term implants in neural tissue engineering.12,18,19 On the other hand, positive outcomes have been founded for others polythiophene derivatives. Madrigal et al.,20 have reported the preparation of free-standing nanomembranes with poly(3-thiophene methyl acetate) – P3TMA, blended with a biodegradable polyester, the poly(tetramethylene succinate) – PE44, for application in tissue engineering. The incorporation of P3TMA in PE44 matrix, not only improved cell proliferation, but also enhanced cell adhesion and the biocompatibility of the nanomembrane after the exposition to several mammalian cell lines. These results opened new scenarios in the investigation of esters derivatives of polythiophenes as electroactive biomaterials.
Conductive polymers are also usually blended with flexible, biodegradable and biocompatible polymers to produce scaffolds in tissue engineering in order to improve the mechanical properties.21 Saturated poly-α-hydroxy esters, such as poly(lactic acid) – PLA, poly(glycolic acid) – PLGA and copolymer are frequently used to produce scaffolds.22 Another interesting and acyclic polyester, from the family of polyhydroxyalkanoates, the poly(hydroxybutirate-co-valerate) – PHBV has presented low cytotoxic and cell compatibility; crucial properties for tissue engineering.23,24 PHBV is copolymer of poly(hydroxybutirate) – PHB and exhibit properties similar to the poly-α-hydroxy esters, but has the advantage of being a natural polymer produced by fermentation process.
Although a number of experimental reports involving PHBV are available, to our knowledge there was no research on the combination of PHBV and conductive polymers until now. Herein, we present the preparation of a new electroactive biomaterial, blending an ester derivative of polythiophene, poly(3-thiophene ethyl acetate) – PTAcEt with PHBV. The blends were characterized by thermal, electrical and optical measurements and morphological analysis. The application of the blends as substrate to tissue engineering was evaluated through in vitro assays.
Experimental
Materials, reagents and solvents
Ethyl 3-thiopheneacetate (TAcEt), anhydrous ferric chloride (FeCl3) and chloroform were purchased from Sigma Aldrich. Nitromethane was acquired from Vetec and used as received. PHBV was produced by PHB Industrial-Biocycle. PHBV purification was made by dissolving 2.0 g of PHBV in 100 mL of chloroform. The solubilisation was performed by heating the solution at 40 °C under stirring. After reaching the room temperature, 500 mL of methanol were poured into the PHBV solution. Subsequently, the solution was cooled down by 24 h. The precipitated PHBV was collected in a paper filter, after vacuum filtration. The polymer was dried in oven at 40 °C during 72 h. Other reagents used in this work were of analytical grade and used as received without purification. Chloroform was dried over molecular sieves and distilled prior to use.PTAcEt synthesis
The synthetic rote was adapted from Sugimoto method,25 using the ratio of 1:4 (monomer:FeCl3). In a 100 mL round-bottom flask were added 2.94 mmol (0.5 g) of TAcEt and 4.6 mL of nitromethane. While stirring this solution, under nitrogen flow, 11.7 mmol (1.9075 g) of ferric chloride was added into the flask. Afterwards, 20 mL of chloroform was added dropwise into the flask. The solution was stirred for 4 h. PTAcEt was precipitated with 1 L of methanol and cooled down for 24 h. The polymer was collected by centrifugation and then washed with methanol.
PHBV![[thin space (1/6-em)]](https://www.rsc.org/images/entities/h3_char_2009.gif) :PTAcEt polyblends preparation
:PTAcEt polyblends preparation
Blends of PHBV:PTAcEt were prepared by casting method using a common solvent for both components of the blend. Firstly, solutions of PHBV and PTAcEt in chloroform were prepared in the concentrations of 30 mg mL−1 and 10 mg mL−1, respectively. The PHBV solution was heated at 40 °C and stirred until complete dissolution of the polymer particles. Then, PTAcEt solution was added in the PHBV solution and stirred by 4 h. The blends were prepared in concentrations of 100:0%, 98:2%, 96:4%, 92:8% and 88:12%; percentage in mass of PHBV:PTAcEt. After 20 minutes of sonification, the solutions were gently distributed into glass slides and the solvent was dried at room temperature. The blends were carefully removed of the glass slides with a tweezer.
Thermal, electrical, optical and morphological characterizations
The FTIR (Fourier Transform Infrared) spectra of the blends were obtained by a Shimadzu IRAffinity-1S spectrometer using an attenuated total reflectance (ATR) accessory. The UV-Vis absorption data were recorded in a Thermo Scientific Evolution 200 UV-Visible spectrophotometer in the wavelength range between 200 and 700 nm.Thermogravimetric analyses were carried out in a TGA brand Netzsch model with heating rates of 10 °C min−1 at temperatures ranging from 25 to 900 °C in a under a N2 inert atmosphere. The average weight of the samples was about 10 mg. Differential Scanning Calorimetry (DSC) was performed using a DSC brand Netzsch model 204 F1 Phoenix. Approximately 8 mg were heated from 0 to 280 °C in a rate of 20 °C min−1. The melting temperature (Tm), the melting enthalpy (ΔHm) were measured and the crystallinity degree (χc) percentage was calculated according to the equation:26
 | (1) |
The DC electrical conductivity values were extracted from current–voltage (I × V) characteristic curves by using a Keithley 2400 source meter and the usual two-probe method. For this, films of pure and polyblend samples, with thicknesses of the order of 30 μm, were prepared. Electrical contacts were formed by Au deposition (sputtered) in both sides of each sample producing a metal–sample–metal structure. DC electrical conductivity (σD) values were estimated by the following expression:
 | (2) |
The blend morphologies were examined using a scanning electron microscope (SEM) bland FEI Inspect model S50, operated at an accelerating voltage of 10 kV.
The wettability of the blend films was characterized using a Theta Lite (Biolin Scientific goniometer). Contact angles were obtained using the water drop method at room temperature. Images of 5 μL deionized water drops on the film surfaces were recorded after 30 s of stabilization. The images were analysed using the One Attesion (Biolin Scientific) software. An average of 4 measurements ± standard deviation was calculated.
In vitro assays
:0%, 96:4%, 92:8% and 88:12% of PHBV:PTAcEt were placed into the wells. Latex was used as positive control and the wells without samples were used as negative control regarding cytotoxic effects. The cells were incubated for 72 h and the culture medium was replaced by fresh medium every 24 h. After incubation, the samples and the culture medium were withdrawn and 500 μL of 3-(4,5-dimethylthiazol-2-yl)-2,5-diphenyltetrazolium bromide – MTT (1 mg mL−1) were added to each well. Cell culture plates were incubated for 3 h. Finally, the MTT solution was replaced by 500 μL of dimethyl sulfoxide (DMSO) in order to solubilize formazan crystals. 30 minutes later, the colorimetric analysis was performed at 540 nm in a microplate reader (Synergy H1, Biotek). The assays were performed in quintuplicate. The relative cell viability percentage was calculated considering the absorbance of negative control as 100% of cell viability.:12% blend were deposited into a 48-well plate. 200 μL of cells suspension in culture medium (104 cells per mL) were seeded upon each sample. After 1 h, 2 mL of culture medium were added to each well. After 72 h of incubation, the supernatants were withdrawn and the samples were washed with phosphate buffered saline (PBS). In order to be observed in the confocal fluorescence microscope, the cells were fixed with paraformaldehyde 4% during 30 min and permeabilized with Triton 0.1% for 30 min. Then, the samples were incubated with the nuclear probe DAPI (Invitrogen) for 1 h. After washing with PBS, the cells were placed on microscope glass slides coated with vectashield (Invitrogen) and covered with glass coverslips. The images were obtained in a Zeiss LSM 780-NLO microscope with excitation in 350 nm and emission in 470 nm in order to observe DAPI fluorescence. The images were analysed by using ImageJ software.Results and discussion
PTAcEt is a polythiophene derivative that holds an alkylester substituent in the 3-position of the thiophene ring. This polar electron-withdrawing carboxylate group is able to improve the solubility of polythiophene chains in several organic solvents, which is an important feature since solubility plays a crucial role in the preparation of blends with other common polymers. PTAcEt was synthetized by Sugimoto route using the FeCl3 as reaction initiator (oxidizing agent; see Scheme 1(a)). By this method, it is only possible to obtain regioregular polymers, which contain defects in their structure and, consequently, lower electrical transport in comparison to regioregular polythiophenes. Regioregular polythiophenes are commonly synthetized by the Grignard Metathesis method (GRIM), using Ni(dddp)Cl2 as catalyser, being toxic for biological applications. On the other hand, regioiregular polythiophenes obtained by Sugimoto method catalysed by FeCl3 presents less toxicity. | ||
| Scheme 1 (a) Sugimoto route to poly(3-thiophene ethyl acetate) – PTAcEt and (b) poly(3-hydroxybutyrate-co-valerate) – PHBV structure. | ||
Mixture of chloroform and nitromethane improved the polymerization yield from 7% to 55%. The influence of the nitromethane in the polymerization of polythiophenes containing alkylester substituents was studied by Bizzarri et al.28 It was observed that the mixture of chloroform/nitromethane leads to a completely monomer conversion and higher reaction yield in comparison to the polymerization using only chloroform as medium. This behaviour probably occurs due to the formation of a solvent/non-solvent pair, which increases the number of initiator centres of radical polymerization obtained with a very fine dispersion of the oxidizing agent.29
FT-IR spectroscopy
Fig. 1 shows the FT-IR spectrum of the pure PTAcEt ranging from 400 to 4000 cm−1 for comparison purposes. The peak at 618 cm−1 is attributed to the C–S bonds of the thiophene ring. The absorption band at 835 cm−1 (C–H out-of-plane vibration) is characteristic of 2,3,5-trisubstituted thiophenes. This absorption is in agreement to C–C coupled monomers and indicates the conjugation of chains and linear polymer chain structure. A broad and high intensity band of ester group (C![[double bond, length as m-dash]](https://www.rsc.org/images/entities/char_e001.gif) O) of the PTAcEt is observed around 1150 cm−1. The intense absorption at 1190 cm−1 is attributed to R–CO–O–C2H5 segment. Around 1320 cm−1 is observed a peak of CC aromatic ring stretching. A strong absorption at 1735 cm−1 is assigned to the stretching of CO of the ester group. Absorptions at 2855, 2931 and 2985 cm−1 show that aliphatic segment (–C2H5) of ester group is present in the polymer. However, it is observed around 3500 cm−1 a moderate band of O–H stretching absorption, indicating some ester cleavage during the preparation of the polymer.3 The presence of –OH groups in PTAcEt can improve the bioactivity of the study material, since they facilitate the intermolecular interactions when applied in the biological medium. This fact contributes to the increase of cell adhesiveness on the polymer surface, for instance, giving better conditions for the tissue regeneration.30,31 In addition, the cleavage of the ester group of PTAcEt does not affect the solubility of the synthesized polymer in common organic solvents. The PTAcEt showed good solubility in several organic solvents such as tetrahydrofuran, methylene dichloride, chloroform and chlorobenzene.
O) of the PTAcEt is observed around 1150 cm−1. The intense absorption at 1190 cm−1 is attributed to R–CO–O–C2H5 segment. Around 1320 cm−1 is observed a peak of CC aromatic ring stretching. A strong absorption at 1735 cm−1 is assigned to the stretching of CO of the ester group. Absorptions at 2855, 2931 and 2985 cm−1 show that aliphatic segment (–C2H5) of ester group is present in the polymer. However, it is observed around 3500 cm−1 a moderate band of O–H stretching absorption, indicating some ester cleavage during the preparation of the polymer.3 The presence of –OH groups in PTAcEt can improve the bioactivity of the study material, since they facilitate the intermolecular interactions when applied in the biological medium. This fact contributes to the increase of cell adhesiveness on the polymer surface, for instance, giving better conditions for the tissue regeneration.30,31 In addition, the cleavage of the ester group of PTAcEt does not affect the solubility of the synthesized polymer in common organic solvents. The PTAcEt showed good solubility in several organic solvents such as tetrahydrofuran, methylene dichloride, chloroform and chlorobenzene.
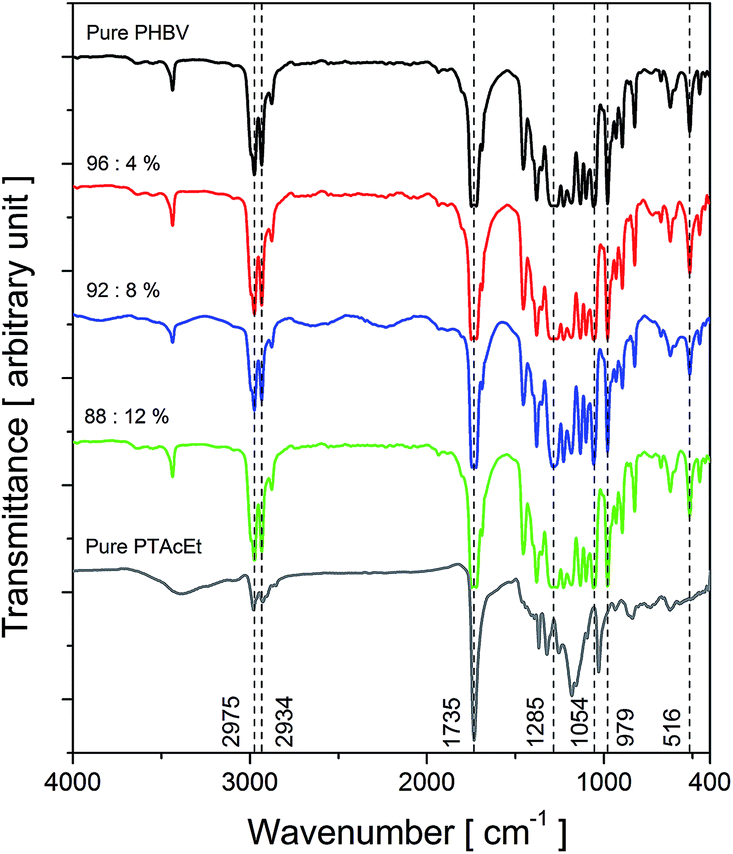 | ||
| Fig. 1 FTIR normalized spectrum of the samples: pure PTAcEt (recorded by ATR accessory), pure PHBV film and PHBV:PTAcET blend films with 4, 8 and 12% of PTAcEt. | ||
PHBV:PTAcEt blends were prepared by casting method, using chloroform as solvent. The blends presented good quality, flexible and resistant to handling. FT-IR spectrum of the pure PHBV and PHBV:PTAcEt blend films with 4, 8 and 12% of polythiophene are shown in Fig. 1. The blend spectra are similar to the pure PHBV. Furthermore, it is observed a broad absorption at 1285 cm−1 attributed to the axial stretching of C–O bound. The CH3 stretching band is observed at 1380 cm−1. The absorption intensity at 1730 cm−1 is attributed CO group. C–H stretching vibrations are identified at 2980, 2920 and 2870 cm−1. The absorption at 3460 cm−1 is attributed to the overtone (1730 cm−1) of CO.32 It is hard identifying the PTAcEt presence in the blends by FT-IR spectroscopy. However, in a close inspection, one observes small distortions between 500 and 800 cm−1 possibly due to the C–S bonds absorption of the PTAcEt thiophene ring. There is no evidence that chemical interaction between PHBV and PTAcEt actually occurs, leading to the conclusion that only physical interactions exist in the blends.
UV-Vis spectroscopy
Fig. 2 shows the spectral dependence of the optical absorption at room temperature of the pure PHBV, pure PTAcEt and blend films, in the wavelength range between 200 and 700 nm (6.2 and 1.77 eV, respectively). No significant absorption band was found for the pure PHBV film. A likely reason for the lack of absorption in this sample is the absence of chromophore groups in the PHBV chains. Pure PTAcEt spectra show broad band absorption centred at ≈417 nm (≈2.97 eV) attributed to the π–π* transition of the thiophene ring.33 The PHBV/PTAcEt blend films display absorption relative to the amount of polythiophene added. The absorption intensity peak increase almost linearly with the percentage of PTAcEt and is slightly shifted to lower wavelength when compared with the pure PTAcEt. The band gap energy (Eg) was also estimated using E = 1239.8/λonset. The values are described in Table 1.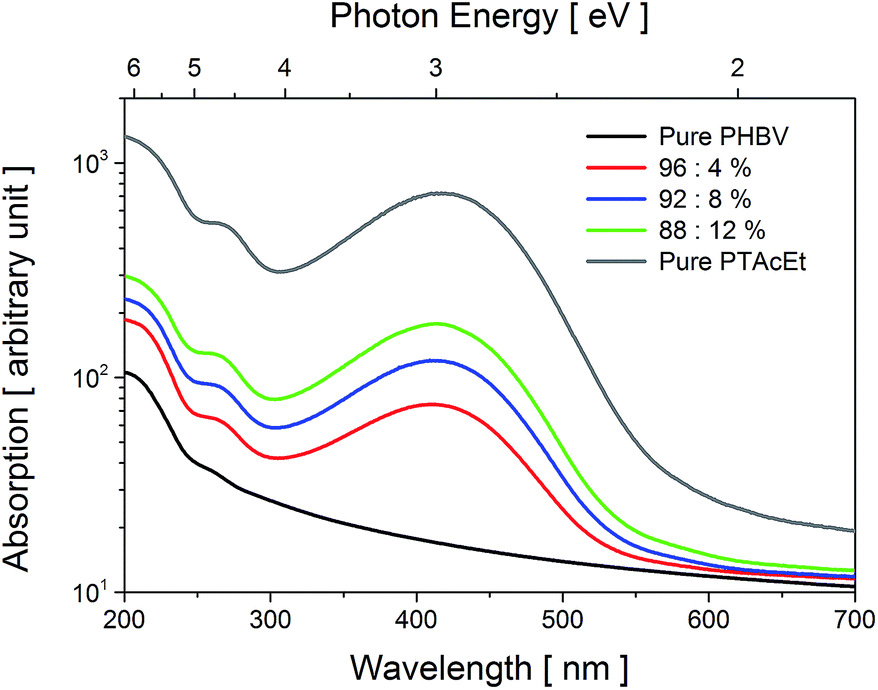 | ||
| Fig. 2 UV-Vis optical absorbance spectra as a function of photon energy obtained at 300 K for the samples: pure PHBV, pure PTAcEt and polyblend films. | ||
| PHBV:PTAcEt [%] |
λmax [nm] | λonset [nm] | Eg [eV] |
|---|---|---|---|
| 100:0 |
— | — | — |
| 96:4 |
410 | 511 | 2.43 |
| 92:8 |
412 | 511 | 2.43 |
| 88:12 |
414 | 513 | 2.42 |
| 0:100 |
417 | 520 | 2.38 |
We have noticed that the solvent used in the preparation of the films interfere in the Eg value. The solvent specie has influence in the intermolecular interaction between PTAcEt and PHBV, affecting the necessary energy for the π–π* transition. It was found that chlorobenzene is the better solvent specie for polythiophene, reducing the Eg value. However, chlorobenzene presents a high boiling point, leaving toxic residues in the blends after evaporated, which is unsuitable for biological applications. In this case, chloroform was chosen due to its lower boiling point compared to chlorobenzene, and since it leaves almost none residue in the blends.
DC electrical measurements
DC electrical conductivity (σD) measurements show an increase in the conductivity with the addition of PTAcEt in the PHBV matrix. The results are summarized in Table 2. PHBV presents a typical character of isolating material. The incorporation of the polythiophene provokes an enhancement in the conductivity due to semiconducting property of the PTAcEt. The 88:12% blend reaches conductivity of up to three orders of magnitude compared to the pure PHBV. However, the results indicate a minimal increase between 96:4% and 92:8% blends. The lack of dopant agents in the PTAcEt structure, followed by the dissolution of the semiconductive polymer in the PHBV matrix can be the causes.
| PHBV:PTAcEt [%] |
σD [S cm−1] |
|---|---|
| 100:0 |
5.40 × 10⁻¹³ |
| 96:4 |
1.33 × 10⁻¹¹ |
| 92:8 |
1.74 × 10⁻¹¹ |
| 88:12 |
2.54 × 10⁻¹⁰ |
Thermal analyses
Thermogravimetric scans shown in Fig. 3(a) indicate significant increase in the onset degradation temperature and in the temperature corresponding to a given weight loss for the blends in relation to the pure PHBV. Table 3 show temperature values of onset degradation (Tonset), of weight loss in 5% (Td-5%) and in 50% (Td-50%) obtained for all samples. Pure PTAcEt, inset (b), presents Tonset at ≈326 °C being the higher degradation temperature in comparison to pure PHBV and the blends. Also shows a high residual weight. This residual weight is greater than that obtained for the pure PHBV due to the aromatic character of the thiophene ring that gives more stability to the blends. Polythiophenes are well known for the high stability at high temperatures, owing their resonating structure.33 | ||
| Fig. 3 TGA thermograms obtained for the samples: (a) pure PHBV and PHBV:PTAcEt blends and (b) pure PTAcEt. DTG curves corresponding to the thermal decomposition of: (c) pure PHBV and PHBV:PTAcEt blends and (d) pure PTAcEt. | ||
:PTAcET blends and pure PTAcEt
| PHBV:PTAcEt [%] |
Tonset [°C] | Td-5% [°C] | Td-50% [°C] | Tm1 [°C] | Tm2 [°C] | ΔHm [J g−1] | χc [%] |
|---|---|---|---|---|---|---|---|
| 100:0 |
237 | 229 | 247 | 156 | 170 | 43.2 | 30.4 |
| 96:4 |
240 | 231 | 249 | 153 | 171 | 50.2 | 36.8 |
| 92:8 |
248 | 240 | 256 | 153 | 170 | 48.8 | 37.4 |
| 88:12 |
255 | 246 | 264 | 152 | 170 | 42.1 | 33.7 |
| 0:100 |
326 | 305 | 646 | — | — | — | — |
The derivative thermogravimetry (DTG) curves of the pure PHBV and blend samples (Fig. 3(c)) show well-defined single peaks of weight loss, while the curve corresponding to the PTAcEt exhibits three peaks and different shoulders indicating a complex degradation behaviour (inset (d)). Similar pattern was observed in the thermal degradation behaviour of a tertiary ester derivative of polythiophene.34 It was argued that thermal treatment give rise the loss of the alkyl group linked to the ester in the first peak, to form a carboxylic acid group, followed by the elimination of the substituents attached to the thiophene rings beginning in the second peak. Here, the first loss peak is located around 400 °C and the second around 570 °C.
Pure PHBV and blends depict nearly the same pattern, except that the Tonset is shift to higher temperatures with the increase of PTAcEt concentration in PHBV matrix. The 88:12% blend shows a Tonset increase of 18 °C in comparison with the pure PHBV, for example, which indicates improvement of the PHBV thermal stability with the introduction of PTAcEt. Low amounts of a second polymer, may improve the properties of the matrices. This statement can be assigned to some reasons: (i) PTAcEt conjugated structure prevent the rupture of polymeric chain during the degradation process at high temperatures and (ii) PTAcEt act as barrier, which avoids the diffusion out of volatile products from the degradation of the PHBV matrix.29
The thermal property was also characterized by DSC analysis. The first heating scans are shown in Fig. 4. The obtained results are described in Table 3, which presents the melting temperature (Tm), melting enthalpy (ΔHm) and crystallinity degree (χc) percentage values. The information obtained through the DSC scan for PTAcEt in the powder form is limited. In the temperature range measured, the Tg (glass transition temperature) of the PTAcEt was not observed. In similar thiophene derivative, the poly(3-thiophene methyl acetate), Tg occurs around 60 °C.35 However, it was detected a broad loss peak around 150 °C, probably related to the residual water loss of the material.
 | ||
| Fig. 4 First heating DSC scans for the samples: pure PHBV, pure PTAcET and polyblends. | ||
The pure PHBV curve exhibits two melting peaks at ≈156 and 170 °C, indicated as Tm1 and Tm2, respectively. The first peak has been attributed to homogeneous nucleation of the PHBV, which begins spontaneously by the aggregation of the chains below the melting point, and the second peak is associated to heterogeneous nucleation of PHBV.36 On the other hand, it was suggested that the bimodal endothermic melting peak in the first heating is due to the presence of two crystalline phases in the sample.37 However, double or multiple melting peaks may be due to several factors: partial melting, recrystallization and reflow during heating, polymorphism, existence of different crystalline morphology (thickness, distribution, completeness or lamellar stability), species with different molar mass, physical aging and/or relaxation of rigid amorphous phase.38 Indeed, the PHBV used in this work has 15% of valerate units and PHBV that contains valerate above 5% in its composition presents a heterogeneous distribution of this unit among chains, causing a differentiation in the molecular mass.39
DSC curves of the PHBV/PTAcEt blends are similar to the pure PHBV (Fig. 4). Nevertheless, it is observed an increase of ΔHm, causing an improvement in the blends crystallinity with the introduction of PTAcEt. A possible explanation to the increase in crystallinity is that the PTAcEt may to act as nucleating agent in the PHBV matrix. In fact, the hydrogen bonding reduces the mobility of the chains and facilitates the formation of semi-crystalline islands in the PHBV.40
SEM analysis
In order to assess the impact of adding PTAcEt in the PHBV matrix morphology, observations by SEM were conducted after 7 days of the samples preparation. Fig. 5 shows representative SEM images of the pure PHBV and polyblend surfaces. The morphology of the pure PHBV sample (Fig. 5(a)) presents excellent film-forming properties and exhibit lamellar aggregates with small superficial porosity. However, the incorporation of PTAcEt has led to changes in the superficial texture of the polyester which is evidenced by the appearance of cavities (pores). It is not observed phase separation between PHBV and PTAcEt as that reported by Gomes et al.,41 since both polymers are soluble in chloroform. The cavity size (ranging from 0.1 to 2.3 μm – average diameter) decreases with the concentration of PTAcEt while the cavity density increases, being more noticeable to the 92:8% blend (Fig. 5(c)). In particular, the 88:12% blend (Fig. 5(d)) presented small cracks around the cavities and along its entire extension, tending to a very slight surface erosion. Therefore, it is formed a microstructure which can favours the cell adhesion and proliferation. Nevertheless, it was not observed large crevasses, grooves or craters.
 | ||
| Fig. 5 SEM micrographs of the sample surfaces after 7 days of the preparation: (a) pure PHBV, (b) 4%, (c) 8% and (d) 12% of PTAcEt. | ||
Approximately 2 months after the samples preparation and exposure to desiccator environment, the material surfaces were re-evaluated since the substrates can be subject to degradation processes, which can provoke scissions at the backbone of the polymer chains. Therefore investigate how the effects of medium exposure can affect the surface available for cell growth. The pure PHBV sample as well the 96:4% blend (Fig. 6(a) and (b)) interesting exhibit, very different from those morphologies observed after 7 days of the preparation, a relatively smooth surface and with no distinctive features. Also, the high cavity density observed in 92:8% and 88:12% blends disappeared. Amorphous regions undergo degradation and samples presented homogeneous and irregular surfaces, rather similar to that observed in the Fig. 5(a) for the pure PHBV. However, even after this long time there was not the appearance of large crevasses, grooves or craters. Here, further investigations should be conducted as hydrolytic and enzymatic degradation studies to clarify this aspect, besides providing a more complete characterization.
 | ||
| Fig. 6 SEM micrographs of the sample surfaces after 2 months of the preparation: (a) pure PHBV, (b) 4%, (c) 8% and (d) 12% of PTAcEt. | ||
Wettability
The average values of contact angle determined for the pure samples (PHBV and PTAcEt) were θ = 68.0 ± 3.5° and 80.0 ± 2.0°, respectively. The pure PHBV contact angle value is similar to those found in the literature for PHBV.42,43 In contrast, the hydrophobicity at the surface of the PTAcEt is smaller when compared with other thiophene derivatives (e.g. θ = 93.8 ± 3.46° for poly(3-thiophene methyl acetate)),20 possible due to ethyl group hydrolysis, which causes an increase of the hydrophilicity of the surface. The polyblends present a slightly hydrophobic character in relation to the PHBV and the average values of contact angle are close to that obtained for the pure PTAcEt sample. The results are summarized in Table 4. A qualitative discussion will be conducted in the next section.:PTAcET blends and pure PTAcEt
| PHBV:PTAcEt [%] |
Contact angle [°] |
|---|---|
| 100:0 |
68.0 ± 3.5 |
| 96:4 |
78.2 ± 4.6 |
| 92:8 |
83.9 ± 4.6 |
| 88:12 |
82.4 ± 5.2 |
| 0:100 |
80.0 ± 2.0 |
In vitro assays
A key factor when developing conducting polymer-based devices to be attractive candidates as tissue scaffolds is their biocompatibility. Cell viability in the presence of the blends was analysed by MTT assay. This method measures the mitochondrial dehydrogenase activity that reduces the pale yellow MTT salt into the purple formazan salt. Only viable cells are capable to accomplish this transformation. Consequently, the cells proliferation in the culture medium and the cytotoxicity effects promoted by the material are proportional to the production of formazan.Fig. 7(a) shows the cell viability of the blends after 72 h of test. Latex was used as positive control, being cytotoxic to the cells. The results showed that the scaffolds presented low cytotoxic effects since the cell viability were higher than 60% for all samples. Pure PHBV presented higher viability compared to the blends containing 4% and 8% of PTAcEt. However, for the scaffolds containing higher concentration of PTAcEt (12%) the cell viability was ca. 20% higher than pure PHBV. A possible explanation for this effect is that higher contents of PTAcEt modify the electrical property of the PHBV matrix (Table 2) with surface charges that stimulates the cell growth. This observation was in line with the results presented by Madrigal et al.,20 where the incorporation of 50% of P3TMA in PE44 increased the cell viability compared to the polyester itself. Therefore, it is tempting to conclude that cell growth would be further promoted by higher ratio of conductive polymer to PHBV. Additionally to the increased cell growth in the presence of the blends, recent studies have shown that the incorporation of conductive polymers into biopolymers opens up the possibility of modulating cell adhesion and proliferation by applying an external electric field.44
 | ||
| Fig. 7 (a) Cell viability of MEF cells after 72 h of incubation with the blends. (b) Fluorescence image of MEF cells grown on 88:12% blend and labeled with DAPI. (c) Combined image of DAPI fluorescence and transmitted image of the 88:12% blend. | ||
In order to evaluate the cell adhesion and proliferation on the prepared blends, MEF cells were incubated on the 88:12% samples, since this blend had showed the highest cell viability. Images of confocal fluorescence microscopy (Fig. 7(b) and (c)) show that MEF cells were able to adhere and to proliferate through the film. Fluorescence of DAPI could be observed on the surface as well as into the film probably due to the penetration of the cells through the cavities and small cracks of the samples. As these cells proliferate into the film, when fluorescence image was captured, it was focused on cells grown on the same level but it was still possible to observe DAPI fluorescence scattered from different depths of the polymeric film.
Differently of the blending effect on the surface morphology revealed by SEM images, the addition of PTAcEt to PHBV matrix does not produce relevant changes in the contact angle of the latter. However, the values of contact angle obtained are comparable to the values reported for polythiophene derivative blends.4,45 Such reports have shown that the better contact angle to cells adhesion was around 90° where the cell adhesion and proliferation were increased. This result was similar to the observations of the present study. As we have not identified any phase separation between the two components of the blend, the cell adhesion and proliferation through the material were possibly promoted by synergism of the two polymers. As a result, significant modifications of the substrates were observed: (i) microstructural (roughness and porosity), crucial for the interconnection between cells and the permeability of nutrients and (ii) electroactive, increasing ionic exchange mediated by polythiophene which enhances the cell response and cell growth.46–50
In summary, the results showed that the incorporation of PTAcEt into PHBV matrix do not generated cytotoxic effects to the MEF cells. Moreover, the 88:12% blend produced better results of cell viability in comparison with pure PHBV film. This demonstrates the potential use of the blend as scaffolds for biomedical and biotechnological applications.
Conclusions
Polyblends based on biodegradable polyester (PHBV) and carboxylate polythiophene derivative (PTAcEt) as electroactive biomaterial substrate for tissue engineering application was presented. The material synthesis and characterizations (thermal, electrical, optical and morphological) as well as viability and cell adhesion (in vitro assays) were discussed. Blend films exhibited high flexibility and resistance to handling. With the addition of PTAcEt (up to 12%) in PHBV matrix, there was an increase in the DC electrical conductivity (from insulating to semiconducting) and improvement in the thermal stability and in the crystallinity degree of the matrix. It was also observed an increase of the superficial porosity of the scaffolds. Desiccator environment (approximately 2 months) has caused degradation of the samples that was evidenced by the changes in the superficial texture. The cell viability assay revealed that the 88:12% polyblend promoted a higher cell proliferation after 72 h exposition to mammalian cells when compared to pure PHBV matrix. The adhesion study showed that the cells have adhered to the blend surface and proliferated inside the cavities and small cracks of the film. The hybrid properties that combining flexibility, semiconductivity and biocompatibility confer to the PHBV:PTAcEt polyblends features highly desirable for biomedical application.
Acknowledgements
The authors would like to thank the financial support of the Brazilian agencies CNPq, FAPESP and FINEP.References
- S. M. Moulton, M. J. Higgins, R. M. I. Kapsa and G. G. Wallace, Adv. Funct. Mater., 2012, 22, 2003 CrossRef CAS.
- R. Balint, N. J. Cassidy and S. H. Cartmell, Acta Biomater., 2014, 10, 2341 CrossRef CAS PubMed.
- N. K. Guimard, N. Gomez and C. E. Schmidt, Prog. Polym. Sci., 2007, 32, 876 CrossRef CAS.
- A.-D. Bendrea, G. Fabregat, J. Torras, S. Maione, L. Cianga, L. J. del Valle, I. Cianga and C. Alemán, J. Mater. Chem. B, 2013, 1, 4135 RSC.
- M. Leclerc and K. Faïd, Adv. Mater., 1997, 9, 1087 CrossRef CAS.
- M. S. Byshkin, F. Buonocore, A. Di Matteo and G. Milano, Sens. Actuators, B, 2015, 211, 42 CrossRef CAS.
- A. Savva, E. Georgiou, G. Papazoglou, A. Z. Chrusou, K. Kapnisis and S. A. Choulis, Sol. Energy Mater. Sol. Cells, 2015, 132, 507 CrossRef CAS.
- Y. Zhou, Y. Yuan, L. Cao, J. Zhang, H. Pang, J. Lian and X. Zhou, J. Lumin., 2007, 602, 122 Search PubMed.
- C. Constantinescu, L. Rapp, P. Rotaru, P. Delaporte and A. P. Alloncle, Chem. Phys., 2015, 32, 450 Search PubMed.
- B. Lakard, L. Ploux, K. Anselme, F. Lallemand, S. Lakard, M. Nardin and J. Y. Hihn, Bioelectrochemistry, 2009, 75, 148 CrossRef CAS PubMed.
- D.-H. Kim, S. M. Richardson-Burns, J. L. Hendricks, C. Sequera and D. C. Martin, Adv. Funct. Mater., 2007, 17, 79 CrossRef CAS.
- V. Castagnola, E. Descamps, A. Lecestre, L. Dahan, J. Remaud, L. G. Nowak and C. Bergaud, Biosens. Bioelectron., 2015, 67, 450 CrossRef CAS PubMed.
- Y. Wan, H. Wu and D. Wen, Macromol. Biosci., 2004, 4, 882 CrossRef CAS PubMed.
- I. Rajzer, M. Rom, E. Menaszek and P. Pasierb, Mater. Lett., 2015, 138, 60 CrossRef CAS.
- G. L. M. Cheong, K. S. Lim, A. Jakubowicz, P. J. Martens, L. A. Poole-Warren and R. A. Green, Acta Biomater., 2014, 10, 1216 CrossRef PubMed.
- Y. A. Ismail, J. G. Martínez, A. S. Al Harrasi, S. J. Kim and T. F. Otero, Sens. Actuators, B, 2011, 160, 1180 CrossRef CAS.
- E. Voitechovic, A. Bratov, N. Abramova, J. Razumiene, D. Kirsanov, A. Legin, D. Lakshmi, M. Whitcombe and P. K. Ivanova-Mitseva, Electrochim. Acta, 2015, 173, 59 CrossRef CAS.
- F. Pires, Q. Ferreira, C. A. V. Rodrigues, J. Morgado and F. C. Ferreira, Biochim. Biophys. Acta, 2015, 1850, 1158 CrossRef CAS PubMed.
- J. E. Collazos-Castro, J. L. Polo, G. R. Hernández-Labrado, V. Padial-Cañete and C. García-Rama, Biomaterials, 2010, 31, 9244 CrossRef CAS PubMed.
- M. M. Pérez-Madrigal, E. Armelin, L. J. del Valle, F. Estrany and C. Alemán, Polym. Chem., 2012, 3, 979 RSC.
- E. Armelin, A. L. Gomes, M. M. Pérez-Madrigal, J. Puiggalí, L. Franco, L. J. del Valle, A. Rodríguez-Galán, J. S. C. Campos, N. Ferrer-Anglada and C. J. Alemán, Mater. Chem., 2012, 22, 585 RSC.
- K. Rezwan, Q. Z. Chen, J. J. Blaker and A. R. Boccaccini, Biomaterials, 2006, 27, 3413 CrossRef CAS PubMed.
- Y. Ke, G. Wu and Y. Wang, BioMed Res. Int., 2014, 2014, 157987 Search PubMed.
- W. Huang, X. Shi, L. Ren, C. Du and Y. Wang, Biomaterials, 2010, 31, 4278 CrossRef CAS PubMed.
- R. Sugimoto, S. Takeda, H.-B. Gu and K. Yoshino, Chem. Express, 1986, 1, 635 CAS.
- W. Chem, D. J. David, W. J. MacKnight and F. E. Karasz, Polymer, 2001, 42, 8407 CrossRef.
- M. Avella, M. E. Errico, R. Rimedio and P. Sadocco, J. Appl. Polym. Sci., 2002, 83, 1432 CrossRef CAS.
- P. C. Bizzarri, F. Andreani, C. Della Casa and M. Lanzi, Synth. Met., 1995, 75, 141 CrossRef.
- X. G. Li, J. Li, Q. K. Meng and M. R. Huang, J. Phys. Chem. B, 2009, 113, 9718 CrossRef CAS PubMed.
- G. A. Somorjai, H. Frei and J. Y. Park, J. Am. Chem. Soc., 2009, 131, 16589 CrossRef CAS PubMed.
- K. Grandfield, S. Gustafsson and A. Palmquist, Nanoscale, 2013, 5, 4302 RSC.
- G. Socrates, Infrared and Raman Characteristic Group Frequencies: Tables and Charts, New York, John Wiley, 2004 Search PubMed.
- S. Manna, A. Mandal and A. K. Nandi, J. Phys. Chem. B, 2010, 114, 2342 CrossRef CAS PubMed.
- M. Bjerring, J. S. Nielsen, N. C. Nielsen and F. C. Krebs, Macromolecules, 2007, 40, 6012 CrossRef CAS.
- M. M. Pérez-Madrigal, M. I. Giannotti, G. Oncins, L. Franco, E. Armelin, J. Puiggalí, F. Sanz, L. J. del Valle and C. Alemán, Polym. Chem., 2013, 4, 568 RSC.
- A. Buzarovska, A. Grozdanov, M. Avella, G. Gentile and M. Errico, J. Appl. Polym. Sci., 2009, 114, 3124 CrossRef.
- K. L. Dagnon, H. H. Chen, L. H. Innocentini-Mei and N. A. Dapos, Polym. Int., 2009, 58, 133 CrossRef CAS.
- L. M. W. K. Gunaratne and R. A. Shanks, Eur. Polym. J., 2005, 41, 2980 CrossRef CAS.
- S. A. Casarin, S. M. Malmonge, M. Kobayashi and J. A. M. Agnelli, J. Biomater. Nanobiotechnol., 2011, 2, 207 CrossRef CAS.
- S. Iannace, A. Maffezzoli, G. Leo and L. Nicolais, Polymer, 2001, 42, 3799 CrossRef CAS.
- A. L. Gomes, R. Lang, E. Armelin, C. Alemán and J. S. de Carvalho Campos, J. Mater. Chem. C, 2014, 2, 2502 RSC.
- J. Wu, K. Xue, H. Li, J. Sun and K. Liu, PLoS One, 2013, 8, e71563 CAS.
- M. Zhou and D. Yu, Mol. Med. Rep., 2014, 10, 508 CAS.
- G. Shi, M. Rouabhia, Z. Wang, L. H. Dao and Z. Zhang, Biomaterials, 2004, 25, 2477 CrossRef CAS PubMed.
- A. F. Quigley, K. Wagner, M. Kita, K. J. Gilmore, M. J. Higgins, R. D. Breukers, S. E. Moulton, G. M. Clark, A. J. Penington, G. G. Wallace, D. L. Officer and R. M. I. Kapsa, Biomater. Sci., 2013, 1, 983 RSC.
- E. Lorens, M. M. Perez-Madrigal, E. Armelin, L. J. del Valle, J. Puiggalí and C. Alemán, RSC Adv., 2014, 4, 15245 RSC.
- M. H. Bolin, K. Svennersten, X. Wang, I. S. Chronakis, A. Rochter-Dahlfors, E. W. H. Jager and M. Berggren, Sens. Actuators, B, 2009, 142, 451 CrossRef CAS.
- L. J. del Valle, D. Aradilla, R. Oliver, F. Sepulcre, A. Gamez, E. Armelin, C. Alemán and F. Estrany, Eur. Polym. J., 2007, 43, 2342 CrossRef CAS.
- L. J. del Valle, F. Estrany, E. Armelin, R. Oliver and C. Alemán, Macromol. Biosci., 2008, 8, 1144 CrossRef CAS PubMed.
- D.-F. Li, H.-J. Wang, J.-X. Fu, W. Wang, X.-S. Jia and J.-Y. Wang, J. Phys. Chem. B, 2008, 112, 16290 CrossRef CAS PubMed.
| This journal is © The Royal Society of Chemistry 2016 |