In situ synthesis and photocatalytic performance of WO3/ZnWO4 composite powders

Wen Li, Liyun Cao, Xingang Kong, Jianfeng Huang*, Chunyan Yao, Jie Fei and Jiayin Li
School of Materials Science & Engineering, Shaanxi University of Science and Technology, Xi'an 710021, China. E-mail: huangjf@sust.edu.cn; Fax: +86 029 86168802; Tel: +86 029 86168802

Received 4th December 2015 , Accepted 23rd February 2016

First published on 25th February 2016


Abstract

The WO3/ZnWO4 composite powders were synthesized through an in situ reaction process with tunnel structure K10W12O41·11H2O filiform crystallites used as a precursor. At first, Zn2+ ions was intercalated into the K10W12O41·11H2O crystal by exchanging K+ ions, then these Zn2+-exchanged samples were transformed into WO3/ZnWO4 composite powders during heat-treatment. The formation reaction and structure of these samples were characterized by X-ray diffraction (XRD), field-emission scanning electron microscopy (FE-SEM), transmission electron microscopy (TEM) and energy dispersive X-ray spectrometer (EDS). The results showed that the WO3/ZnWO4 composite powders consisted of WO3 nanoparticles and ZnWO4 nanorods. Photocatalytic experiments exhibited an excellent photocatalytic performance for the degradation of methylene blue (MB) and the degradation efficiency was about 95% after 70 min under simulated sunlight.

1 Introduction

In situ synthesis process is a useful method for the preparation of function inorganic materials.1–3 This process typically includes two steps: the first step is the preparation of a framework precursor (layered or tunnel), followed by the ions or molecules being inserted into the interlayer space by an ion-exchange reaction. The second step is the transformation of the template-inserted precursor into a desired structure by a chemical method, such as solvothermal treatment, ion-exchange treatment and low temperature heat-treatment.4 This method has been utilized for the synthesis and design of metal oxides and organic inorganic nanocomposites with controlled structure, morphology, and chemical composition.5

Zinc tungstate (ZnWO4), as one of the important metal tungstates, has attracted wide interest due to its widespread and potential applications in various fields, such as scintillators, solid-state laser hosts, photocatalysts, gas and humidity sensors, optical fibers and electronic materials.6–14 In the past decade, various morphological ZnWO4 nano/microstructures, such as rods, wires, hollow microspheres, hollow clusters and chrysanthemum-shape, have been synthesized through solid-state, precipitation, sol–gel, hydro/solvothermal and microwave routes.10–20 In order to further enhance the photocatalytic properties and extend the applications of materials, their preparation with novel structures has attracted significant attention. Nowadays, several enhancement methods, such as the surface modification,21 organic/inorganic metal doping,22,23 and the combination with narrow band gap semiconductors,24 have been applied and tested to extend the light absorption spectrum from UV to visible light.

Generating heterojunctions is an effective method for photoelectron–hole separation to improve the photocatalytic efficiency of materials, such as ZnO/ZnWO4/WO3, Ag–AgBr/ZnWO4, WO3/ZnO, BiOBr/ZnWO4, TiO2/ZnWO4:Yb3+, Tm3+, ZnO/ZnWO4, ZnWO4/TiO2[thin space (1/6-em)]25–31 are also researched. Recently, the photoelectric properties of WO3 (2.8 eV) related to solar energy conversion and the photocatalytic degradation are widely investigated.32,33 The result shows that WO3 has the high photoelectron catalytic degradation efficiency to azo dye pollutants34 and high sensitivity to visible light.35 However, the photoelectric properties and photocatalytic efficiency of WO3 require improvement in practical applications. Apart from WO3, it is known that ZnWO4 (3.3 eV) is a better photocatalyst with good photocatalytic effect and high quantum efficiency for degradation of environmental pollutants.36 Among oxide semiconductors, combining WO3 with ZnWO4 has been very attractive in the achievement of efficient charge separation and photocatalytic activity improvement.31 The other authors reported that the WO3 loaded into the ZnWO4 nanoparticles by microwave-solvothermal method and also discussed the photocatalytic degradation rate of the WO3/ZnWO4 nanoparticles.37 Therefore, a rapid screening technique utilizing a modified scanning electrochemical microscope has been used to screen photocatalysts and determine how metal doping affects its photoelectron chemical (PEC) properties by Bard research.38 The electron transfer process between WO3 and ZnWO4 bilayer films also has been reported.39

In this research, the WO3/ZnWO4 composite powders are prepared by an in situ synthesis reaction. In addition, the photocatalytic activities of these materials are discussed. To the best of our knowledge, such an approach towards the synthesis of WO3/ZnWO4 composite powders has not been reported thus far.

2 Experimental

2.1 Preparation of K10W12O41·11H2O precursor

The experimental procedure for preparing K10W12O41·11H2O nanocrystallites was as follows: 1 g tungsten trioxide WO3 was dissolved in 30 mL of 1.5 mol L−1-KOH solution (mole ratio of K/W ≈ 10[thin space (1/6-em)]:[thin space (1/6-em)]1), and then the mole ratio of K/W in the solution was controlled to 20[thin space (1/6-em)]:[thin space (1/6-em)]1 via adding KCl. The pH value of this solution was adjusted with HCl. Finally, the pH-adjusted solution was transferred into a Teflon-lined autoclave with an inner volume of 100 mL, and maintained in an oven at 200 °C for 12 h. After the hydrothermal treatment, the products were filtered and washed with distilled water, then dried at room temperature.

2.2 Preparation of WO3/ZnWO4

A typical procedure (molar ratio of WO3/ZnWO4 samples designed as 0.1[thin space (1/6-em)]:[thin space (1/6-em)]1) as follows: 0.5 g of K10W12O41·11H2O samples were respectively put into 100 mL of 0.5 mol L−1 Zn(CH3COO)2, then stirred and ion-exchanged for 12 h at room temperature. The ion-exchange treatment was performed twice for the complete exchange. After ion-exchange, the products were filtered, washed with distilled water, and dried at room temperature. Thus the Zn2+-exchanged samples were obtained. Finally, the Zn2+-exchanged samples were heat-treated at 650 °C for 2 h to obtain WO3/ZnWO4 composite powders (WO3/ZnWO4-HT). According to this method, WO3/ZnWO4 samples with different molar ratios of 0.1[thin space (1/6-em)]:[thin space (1/6-em)]1, 0.2[thin space (1/6-em)]:[thin space (1/6-em)]1 and 0.3[thin space (1/6-em)]:[thin space (1/6-em)]1 were also obtained and denoted as 5%, 15% and 25% WO3/ZnWO4 (mass ratio), respectively. In order to make a comparison, we synthesized the compound of the WO3/ZnWO4 using the solid-state method (WO3/ZnWO4-solid). The mixtures consisting of 2.0 g of the pure ammonium tungstate ((NH4)2WO4), 1.5 g of the zinc nitrate (Zn(NO3)2·6H2O) and 1.25 g of tungsten acid (H2WO4) were put into the muffle furnace and heated at 600 °C for 3 hours. Then the compounds of WO3/ZnWO4-solid were obtained after being cooled in the air with the molar ratio of ZnWO4 and WO3 being 5/7.

2.3 Physical analysis

The crystal structure of the sample was investigated by a powder X-ray diffractometer (Shimadzu, Model XRD-6100) with Cu Kα (l ¼0.15418 nm) radiation. The size and morphology of the particles were observed by scanning electron microscopy (SEM) (Hitachi, Model S-900). The element composition of the multi-layer coatings was analyzed with the energy dispersive spectroscopy (EDS). Transmission electron microscopy (TEM) observation and selected-area electron diffraction (SAED) were performed on a JEOL Model JEM-3010 system at 300 kV, and the powder sample was supported on a micro grid.

The photocatalytic performance of samples was evaluated by degradation of methylene blue (MB) under xenon lamp irradiation. In each experiment, 50 mg of samples were added into the solution (50 mL, 10 mg L−1). The suspensions were magnetically stirred in the dark for 60 min to ensure the establishment of an adsorption–desorption equilibrium. Then, the solution was exposed to the lamp irradiation under magnetic stirring. At different irradiation time intervals, 6 mL of the solution was collected by centrifugation. The concentration of the remnant dye in the collected solution was monitored by UV-vis spectroscopy (UnicoUV-2600) each 5 or 10 min.

3 Result and discussion

3.1 The K10W12O41·11H2O precursor

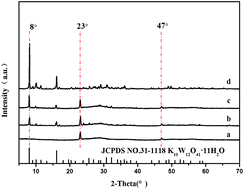
WO3 with KOH reacts easily under the condition of room temperature, forming soluble K2WO4, and then K2WO4 is hydrothermally treated to transform into K10W12O41·11H2O in the acid system. Fig. 1 shows the XRD patterns of the potassium tungstate obtain in the K/W mole ratio of 20[thin space (1/6-em)]:[thin space (1/6-em)]1 under hydrothermal condition of 200 °C for 12 h. When the pH value is 3, the obtained sample respectively displays only two diffraction peaks at 2θ = 23° and 47° (Fig. 1a), but cannot be indexed in JCPDS file PDF card. Those peaks of this sample include the so-called K2W4O13 phase (JCPDS no. 20-0942) in literature,40 so it can be considered as the intermediate of potassium tungstate from amorphous phase to crystalline phase. When the pH value is 4, the K10W12O41·11H2O phase (JCPDS no. 31-1118) is formed, and two diffraction peaks at 2θ = 23° and 47° still exist in XRD pattern of product (Fig. 1b). In the XRD pattern of obtained sample after the hydrothermal reaction of pH = 5 (Fig. 1c), it can be found clearly that the diffraction peaks intensity of K10W12O41·11H2O phase increase and the intensity of two diffraction peaks at 2θ = 23° and 47° decreases. Up to pH = 6, two diffraction peaks at 2θ = 23° and 47° disappear, and the obtained samples only present a pure K10W12O41·11H2O phase (Fig. 1d). These results indicate that the potassium tungstate intermediate can be gradually transformed into K10W12O41·11H2O crystalline with the increase of pH value. In this hydrothermal reaction (10K+ + 12WO42− + 14H+ + 4H2O = K10W12O41·11H2O), the increase of K+ ions concentration is conducive to the forward reaction according to the reaction equilibrium principle. So the K+ ions concentration is improved with KCl used as K source. When the K/W mole ratio is 20[thin space (1/6-em)]:[thin space (1/6-em)]1, the yield of products is the most. The above results indicate that the K10W12O41·11H2O phase can be synthesized via controlling pH value in the hydrothermal process of high K/W mole ratio.
image file: c5ra25522h-f1.tif
Fig. 1 XRD patterns of samples obtained at the hydrothermal condition with different values, (a) pH = 3, (b) pH = 4, (c) pH = 5, (d) pH = 6.

Fig. 2 shows the morphologies of samples obtained after the hydrothermal reaction at pH = 3 and 6, respectively. It can be seen that the intermediate sample obtained at pH = 3 exhibits a rod-like shape with about 300 nm in width and 3–10 μm in length (Fig. 2a). Nevertheless the pure K10W12O41·11H2O phase sample prepared at pH = 6 also shows rod-like shape with about 300 nm in width and 3–10 μm in length, and this nanorods contains a bunch of nanowires with about 10 nm in width which is observed in high magnification FE-SEM (Fig. 2b). Similar to the FE-SEM results, the TEM images also show that the K10W12O41·11H2O phase sample has the 1D rod-like shape (Fig. 2c). It is interesting that the K10W12O41·11H2O nanorod displays an individual SAED pattern (Fig. 2d), in which the numerous satellite diffraction spots and the elongated lines perpendicular to the growing direction are observed (Fig. 2d). The SAED pattern of K10W12O41·11H2O nanorod is similar to that of KxWO3 reported by literatures.41,42 The emergence of this individual SAED pattern arises from the beam-like structure with nanowires self-assembling.


image file: c5ra25522h-f2.tif
Fig. 2 FE-SEM images (a and b), TEM image (c) and SEAD pattern (d) of samples obtained at the hydrothermal condition of 200 °C for 12 h. (a) pH = 3, (b–d) pH = 6.

3.2 In situ transformation reaction

Similar to the most metal oxides with tunnel structure, e.g. zeolites, tunnel structure manganese oxides,43,44 layered tungstates of K2W3O10, K2W4O13,45 K+ ions in the tunnel structure K10W12O41·11H2O can be exchanged with other cations by ion-exchange treatment. When the K10W12O41·11H2O precursor is treated by ion-exchange in 0.5 mol L−1 Zn(CH3COO)2 aqueous solution, the Zn2+-exchanged samples are formed. Fig. 3a shows that the crystallinity of Zn2+-exchanged samples is low, and the reason is that the Zn2+ radius is smaller than the radius of K+, so the framework structure becomes loose. But the tunnel structure remains because of the existing characteristic peak at 2θ = 10° nearby even if the intensity of the characteristic peak is weak. For the Fig. 3b sample, the mixed phase of monoclinic ZnWO4 (JCPDS no. 73-0554)/hexagonal WO3 (JCPDS no. 85-2460) are formed after the heat-treatment of the Zn2+-exchanged sample obtained in Zn(CH3COO)2 solution, and the crystallinity of this mixed phase was increased. With the increase of the WO3 quality, the intensity of equivalent plane of the (100) (002) (200) are increased (Fig. 3c and d). No impurity peak is also found in the WO3/ZnWO4 composites. This suggests that the photocatalyst is only composed of monoclinic ZnWO4 and hexagonal WO3.
image file: c5ra25522h-f3.tif
Fig. 3 XRD patterns of (a) the Zn2+-exchanged samples obtained in Zn(CH3COO)2 solution and the samples of (b) 5 wt% WO3/ZnWO4, (c) 15 wt% WO3/ZnWO4 and (d) 25 wt% WO3/ZnWO4 obtained by heat-treating the Zn2+-exchanged samples from Zn(CH3COO)2 solution.

The morphologies of Zn2+-exchanged samples are shown in Fig. 4a. The morphologies of Zn2+-exchanged samples still maintain the rod-like structure of precursor, and the width or length have no change compared with the precursor K10W12O41·11H2O. After loading WO3, many additional nanoparticles with 2–10 nm in width are found adhered to the surface of the ZnWO4 nanorods (Fig. 4b). With the increase of the WO3 quality, the phenomenon of the ZnWO4 surface adhered to the WO3 nanoparticles is decreased (Fig. 4c). In the SEM micrograph of the 25 wt% WO3/ZnWO4 (Fig. 4d), a smaller amount of WO3 particles adhere to the rod-shape ZnWO4 surface and a mass of WO3 nanoparticles agglomeration are appeared.


image file: c5ra25522h-f4.tif
Fig. 4 SEM micrographs of the samples: (a) the Zn2+-exchanged samples; (b) 5 wt% WO3/ZnWO4; (c) 15 wt% WO3/ZnWO4 and (d) 25 wt% WO3/ZnWO4.

The element composition of the 5 wt% WO3/ZnWO4 samples is measured by the energy dispersive spectroscopy (EDS) analysis. From the area-scan EDS analysis (Fig. 5b), the 5 wt% WO3/ZnWO4 composite powders are obtained. Zn element is detected in rod-like shape of WO3/ZnWO4 samples and the element ratio of Zn atom and W atom is nearly 1[thin space (1/6-em)]:[thin space (1/6-em)]1 (Fig. 5c). Only W element and O element are detected in nanoparticles of WO3/ZnWO4 samples and the element ratio of W atom and O atom is nearly 1[thin space (1/6-em)]:[thin space (1/6-em)]3 (Fig. 5d). The EDS analysis confirm that the sample consisted of nanorods ZnWO4 and nanoparticles WO3 which is consistent with the XRD results, and the morphology of nanorods ZnWO4 depends on the morphology of nanorods K10W12O41·11H2O precursor sample.


image file: c5ra25522h-f5.tif
Fig. 5 SEM image (a) and EDS images (b)–(d) of the mixed phase of 5 wt% WO3/ZnWO4-HT.

Corresponding to the SEM results, the TEM images also show that many additional irregular particles with 20–100 nm in width are found adhered to the surface of the ZnWO4 nanorods in Fig. 6a. By carefully measuring the lattice parameters with Digital Micrograph and comparing the data in JCPDS (Fig. 6b), two different kinds of lattice fringes with spacing of 0.2928 nm and 0.3171 nm are obtained. It can be sure that the lattice fringes with spacing of 0.2928 nm belong to the (−111) crystallographic plane of monoclinic ZnWO4 (JCPDS no. 73-0554) and the lattice fringe with spacing of 0.3171 nm belongs to (200) plane of hexagonal WO3 (JCPDS no. 85-2460). So the nanorods could be ZnWO4 and the nanoparticles on the surface of the nanorods could be WO3. The corresponding selected area electron diffraction (SAED) pattern is demonstrated in Fig. 6c, which can be indexed to the ZnWO4 diffraction planes of (010), (020), (011) and WO3 diffraction planes of (002), suggesting the composite is WO3/ZnWO4. From the TEM morphologies of Fig. 6d, it is clearly discovered that the compound of WO3/ZnWO4-solid is composed of different sizes of spherical particles, the average diameters of which are around 50–200 nm. The size of samples obtained by solid sintering method is larger than that of samples by in situ synthesis method. The smaller particle size contributed to the photocatalytic efficiency.46


image file: c5ra25522h-f6.tif
Fig. 6 TEM (a), HRTEM image (b) and SAED (c) of the 5 wt% WO3/ZnWO4 samples obtained by heat treating the Zn2+-exchanged samples from Zn(CH3COO)2 solution, TEM (d) of the WO3/ZnWO4 samples obtained by solid sintering method.

Fig. 7 shows the photocatalytic performance (C/C0) versus simulated sunlight irradiation time of samples for the degradation of methylene blue (MB). All samples show higher photocatalytic activity than WO3/ZnWO4-solid dose and the 5% WO3/ZnWO4-HT shows the highest photocatalytic activity. The WO3/ZnWO4-solid samples display the degradation efficiency of about 50% for MB after simulated sunlight irradiation for 70 min, however it takes about 10 min for the 5 wt% WO3/ZnWO4-HT sample to reach the degradation efficiency of about 50% for MB. Ultimately, the degradations efficiency of MB are about 50%, 95%, 85% and 60%, respectively in WO3/ZnWO4-solid, 5 wt% WO3/ZnWO4-HT, 15 wt% WO3/ZnWO4-HT and 25 wt% WO3/ZnWO4-HT samples after 70 min under simulated sunlight. It is found that the photocatalytic activities of WO3/ZnWO4-HT samples are superior to that of WO3/ZnWO4-solid sample for the degradation of MB. The reason is that the smaller the particle size, the higher the photocatalytic efficiency. These small nanocrystals in WO3/ZnWO4-HT samples are generally beneficial for surface-based photocatalysis. More importantly, the existence of the heterojunction in the WO3/ZnWO4-HT composite powders improve the separation of the electrons and holes generated by the photons, so the synergetic effect may occur in the grain boundary between ZnWO4 nanocrystal and WO3 nanocrystal in hetero-nanostructures.47,48 In addition, the MB degradations efficiency of 5 wt% WO3/ZnWO4-HT is superior to the 25 wt% WO3/ZnWO4-HT. This reason is the WO3 nanoparticles agglomeration are appeared and led to a reduction in the number of heterojunction in WO3/ZnWO4 composite.


image file: c5ra25522h-f7.tif
Fig. 7 Photocatalytic degradations of methylene blue (MB) under simulated sunlight irradiation using the as-prepared WO3/ZnWO4-solid and WO3/ZnWO4-HT samples.

On the basis of the above results, we propose a formation mechanism and photocatalytic mechanism of the 1D rod-like WO3/ZnWO4 composite from layered K10W12O41·11H2O precursor, as shown in Fig. 8. The mechanism of formation of the 1D rod-like WO3/ZnWO4 composite consists mainly of two processes, ion-exchange and in situ crystallization. Firstly, the Zn2+ ions come in contact with the HW6O215− layers of the K10W12O41·11H2O phase or intercalate with the HW6O215− interlayer via K+/Zn2+ ion exchange, and then straightaway in situ react with HW6O215− layers to generate the ZnWO4 nanocrystal. Finally, when the unreacted K10W12O41·11H2O phase within the composite is thoroughly depleted, the ZnWO4 no longer obtains, and the rest of the tungsten source irreversibly transform into WO3 during the heat treatment. The mechanism described above suggests that the biggest advantage of in situ synthesis method is can make the WO3/ZnWO4 product keep its nanorods shape of original base K10W12O41·11H2O material.49 The optical band gap energy of ZnWO4 and WO3 is 3.3 eV and 2.8 eV, respectively. The band gaps of the two semiconductors match well with each other. Under simulated sunlight irradiation, both the ZnWO4 and WO3 are excited by absorbing photons, and then electron–hole pairs are produced. The WO3 acts as electron-accepting semiconductor. Photogenerated electrons transfer from the conduction band (CB) of ZnWO4 to that of WO3. Simultaneously, holes shift from the valence band (VB) of WO3 to that of ZnWO4. The effectively separation of photogenerated electrons and holes can be enhanced, which result in higher photocatalytic performance.50–52


image file: c5ra25522h-f8.tif
Fig. 8 Formation mechanism and photocatalytic mechanism of the 1D rod-like WO3/ZnWO4 composite from the layered K10W12O41·11H2O precursor.

4 Conclusions

The WO3/ZnWO4 composites powders were successfully synthesized by in situ reaction process with the tunnel structure K10W12O41·11H2O rod-like crystallites used as precursor. Zn2+ ions were intercalated into K10W12O41·11H2O crystal by exchanging K+ ions and then these Zn2+-exchanged samples were transformed into WO3/ZnWO4 during heat-treatment. Photocatalytic experiments showed that 5 wt% WO3/ZnWO4 composites powders have excellent photocatalytic performance for the degradation of methylene blue (MB) with the degradation efficiency being about 95% after 70 min under simulated sunlight irradiation. The in situ reaction process is an efficient method for designing and preparing other new types of nanostructures or hetero-nanostructures functional materials.

Acknowledgements

Innovation Team Assistance Foundation of Shaanxi Province (2013KCT-06), Innovation Team Assistance Foundation of Shaanxi University of Science and Technology (No. TD12-05), National Natural Science Foundation of China (No. 51472152).

References

  1. X. G. Kong, Y. Ishikawa, K. Shinagawa and Q. Feng, J. Am. Ceram. Soc., 2011, 11, 3716–3721 CrossRef .
  2. X. G. Kong, D. W. Hu, P. Wen and Q. Feng, Dalton Trans., 2013, 21, 7699–7709 RSC .
  3. S. Kundu, K. Wang and D. Huitink, Langmuir, 2009, 25, 10146–10152 CrossRef CAS PubMed .
  4. X. G. Kong, D. Hu, Y. Ishikawa and Y. Tanaka, Chem. Mater., 2011, 17, 3978–3986 CrossRef .
  5. X. G. Kong, Z. L. Guo, P. H. Wen and L. Y. Cao, RSC Adv., 2014, 100, 56637–56644 RSC .
  6. S. J. Chen, J. H. Zhou and X. T. Chen, Chem. Phys. Lett., 2003, 1, 185–190 CrossRef .
  7. S. Lin, J. Chen and X. Weng, Mater. Res. Bull., 2009, 5, 1102–1105 CrossRef .
  8. H. Fu, J. Lin and L. Zhang, Appl. Catal., A, 2006, 306, 58–67 CrossRef CAS .
  9. L. H. Thomas, C. Wales and L. Zhao, Cryst. Growth Des., 2011, 5, 1450–1452 Search PubMed .
  10. M. B. Nazari, M. Shariati and M. R. Eslami, Mechanika, 2010, 84, 20–27 Search PubMed .
  11. Z. Amouzegar, R. Naghizadeh, H. R. Rezaie and M. Ghahari, Ceram. Int., 2015, 7, 8352–8359 CrossRef .
  12. X. Zhao and Y. Zhu, Environ. Sci. Technol., 2006, 10, 3367–3372 CrossRef .
  13. J. Lin, J. Lin and Y. Zhu, Inorg. Chem., 2007, 20, 8372–8378 CrossRef PubMed .
  14. X. Zhao, W. Yao and Y. Wu, J. Solid State Chem., 2006, 8, 2562–2570 CrossRef .
  15. M. Wang, Y. Tang and T. Sun, CrystEngComm, 2014, 48, 11035–11041 RSC .
  16. T. Montini, V. Gombac and A. Hameed, Chem. Phys. Lett., 2010, 1, 113–119 CrossRef .
  17. B. Liu, S. H. Yu and L. Li, J. Phys. Chem. B, 2004, 9, 2788–2792 CrossRef .
  18. K. M. Garadkar, L. A. Ghule and K. B. Sapnar, Mater. Res. Bull., 2013, 3, 1105–1109 CrossRef .
  19. W. Zhao, X. Song and G. Chen, J. Mater. Sci., 2009, 12, 3082–3087 CrossRef .
  20. J. Huang and L. Gao, J. Am. Ceram. Soc., 2006, 12, 3877–3880 CrossRef .
  21. K. Peng, A. Lu and R. Zhang, Adv. Funct. Mater., 2008, 19, 3026–3035 CrossRef .
  22. X. H. Wang, J. G. Li and H. Kamiyama, J. Phys. Chem. B, 2006, 13, 6804–6809 CrossRef PubMed .
  23. G. Liu, Y. Zhao and C. Sun, Angew. Chem., Int. Ed., 2008, 24, 4516–4520 CrossRef PubMed .
  24. Y. Bessekhouad, N. Chaoui and M. Trzpit, J. Photochem. Photobiol., A, 2006, 1, 218–224 CrossRef .
  25. Y. Wang, L. Cai and Y. Li, Physica E: Low-dimensional Systems and Nanostructures, 2010, 1, 503–509 CrossRef .
  26. K. Li, J. Xue and Y. Zhang, Appl. Surf. Sci., 2014, 320, 1–9 CrossRef CAS .
  27. Y. Liu, H. He and J. Li, RSC Adv., 2015, 58, 46928–46934 RSC .
  28. X. C. Song, W. T. Li and W. Z. Huang, Mater. Chem. Phys., 2015, 160, 251–256 CrossRef CAS .
  29. K. Feng, S. Huang and Z. Lou, Dalton Trans., 2015, 30, 13681–13687 RSC .
  30. A. Dodd, A. McKinley, T. Tsuzuki and M. Saunders, J. Eur. Ceram. Soc., 2009, 29, 139–144 CrossRef CAS .
  31. W. Wang, W. F. Bai, B. Shen and J. W. Zhai, Ceram. Int., 2015, 41, 435–440 CrossRef .
  32. I. Shiyanovskaya and M. Hepel, J. Electrochem. Soc., 1999, 1, 243–249 CrossRef .
  33. R. Solarska, C. Santato and C. Jorand-Sartoretti, J. Appl. Electrochem., 2005, 7, 715–721 CrossRef .
  34. M. Hepel and S. Hazelton, Electrochim. Acta, 2005, 25, 5278–5291 CrossRef .
  35. G. Waldner, A. Brüger and N. S. Gaikwad, Chemosphere, 2007, 4, 779–784 CrossRef PubMed .
  36. J. Lin, J. Lin and Y. Zhu, Inorg. Chem., 2007, 20, 8372–8378 CrossRef PubMed .
  37. Y. Keereeta, S. Thongtem and T. Thongtem, Powder Technol., 2015, 284, 85–94 CrossRef CAS .
  38. K. C. Leonard, K. M. Nam and H. C. Lee, J. Phys. Chem. C, 2013, 117, 15901–15910 CAS .
  39. H. Wei, D. Ding and X. Yan, Electrochim. Acta, 2014, 132, 58–66 CrossRef CAS .
  40. A. S. Koster, F. Kools and G. D. Rieck, Acta Crystallogr., Sect. B: Struct. Crystallogr. Cryst. Chem., 1969, 9, 1704–1708 CrossRef .
  41. C. Guo, S. Yin and L. Huang, ACS Appl. Mater. Interfaces, 2011, 7, 2794–2799 Search PubMed .
  42. S. Jia, H. Zheng and H. Sang, ACS Appl. Mater. Interfaces, 2013, 20, 10346–10351 Search PubMed .
  43. Q. Feng, H. Kanoh and K. Ooi, J. Mater. Chem., 1999, 2, 319–333 RSC .
  44. P. Misaelides, Microporous Mesoporous Mater., 2011, 1, 15–18 CrossRef .
  45. A. Martinez-de La Cruz and L. G. C. Torres, Ceram. Int., 2008, 7, 1779–1782 CrossRef .
  46. Z. Jiang, Y. Tang and Q. Tai, et al., Adv. Energy Mater., 2013, 10, 1368–1380 CrossRef .
  47. W. Lu, J. Xiang and B. P. Timko, Proc. Natl. Acad. Sci. U. S. A., 2005, 29, 10046–10051 CrossRef PubMed .
  48. M. Pirhashemi and A. Habibi-Yangjeh, Ceram. Int., 2015, 10, 14383–14393 CrossRef .
  49. X. G. Kong, Z. L. Guo and C. B. Zeng, J. Mater. Chem. A, 2015, 3, 18127–18135 CAS .
  50. S. Kundu, K. Wang and H. Liang, J. Phys. Chem. C, 2009, 113, 18570–18577 CAS .
  51. S. Kundu, J. Mater. Chem. C, 2013, 1, 831–842 RSC .
  52. S. Kundu, S. K. Ghosh and M. Mandal, New J. Chem., 2003, 27, 656–662 RSC .

This journal is © The Royal Society of Chemistry 2016
Click here to see how this site uses Cookies. View our privacy policy here.