
 Open Access Article
 This Open Access Article is licensed under a
 Creative Commons Attribution 3.0 Unported Licence
Self-assembly of porous copper oxide hierarchical nanostructures for selective determinations of glucose and ascorbic acid†
Bahaa G.
Mahmoud
a,
Mohamed
Khairy
*a,
Farouk A.
Rashwan
a,
Christopher W.
Foster
b and
Craig E.
Banks
*b
aChemistry Department, Faculty of Science, Sohag University, Sohag, Egypt. E-mail: mohamed.khairy@science.sohag.edu.eg
bFaculty of Science and Engineering, School Science and the Environment, Division of Chemistry and the Environment, Manchester Metropolitan University, Chester Street, Manchester M1 5GD, UK. E-mail: c.banks@mmu.ac.uk; Fax: +44 (0)1612476831; Tel: +44 (0)1612471196
First published on 25th January 2016
Abstract
The simple design of CuO micro-/nanostructures has recently attracted tremendous interest particularly for the enzyme-less sensing of biological molecules due to their intrinsic electronic and catalytic properties. Consequently attention has been directed to the development of new CuO nanomaterials that have multi-interdisciplinary applications. Herein, we report for the first time the fabrication of hierarchical porous CuO micro-/nanostructures with flower- and hollow sphere-like morphology via a facile hydrothermal method. Our experimental findings clarify that the source of the copper-ions effectively control the assembly of CuO nano-building blocks via the one-step hydrolysis of [Cu(NH3)4(H2O)2]SO4 and [Cu(NH3)4(H2O)2]Cl2 precursors, which produce hollow sphere and flower-like morphologies for sensitive and selective determination of ascorbic acid and glucose, respectively. Moreover, such unique properties of macro-/mesoporous CuO with defined dimensions and topologies offer minimized diffusive resistance for the dispersion of active sites. The best performance of the glucose and ascorbic sensor can be obtained at +0.55 V in 0.1 M sodium hydroxide solution. The as-prepared CuO modified (drop-casted) screen-printed electrodes (SPE) exhibit a fast electroactive response with high sensitivity within a wide concentration range of glucose and ascorbic acid in real samples. Significantly, the anion-dependent approach might be used to control effectively the expansion and features of other metal oxide micro-/nanostructures.
1. Introduction
The synthesis of transition metal oxide nanostructures with controlled shapes and sizes has been developed over recent decades due to their shape/size-dependent physical, chemical, electrical, optical, and catalytic properties.1,2 They exhibit versatile functions of their energy gap, numerous valence states, and tunable performances for electron transport. This is because their complex morphology and high dimensionality lead to an advanced geometric structure and atom arrangement on the specific facets which provide novel characteristics. To date, hierarchical metal oxide micro-/nanostructures have attracted considerable attention, because of their technological and fundamental scientific importance and potential applications; including chemical and electrochemical sensing, catalysis, nanoelectronics and nanophotonics.3–6 These hierarchical porous micro-/nanostructures offer minimized diffusion resistance, high surface area and good conductivity.7 Therefore, numerous hierarchical metal oxides micro-/nanostructures have been recently reported.8–12 Direct hydrothermal via hydrolysis of metal salts and sacrificial templates strategies have been widely used to control fabrication of hierarchical structures, yet technical challenges in terms of cost-intensive and time-consuming synthetic conditions remain. In this respect, development of suitable synthetic strategies is highly desirable.Copper oxide (CuO) is a nontoxic, low cost p-type semiconductor with a narrow-band gap of 1.2 eV, which has gained much attention because of its intrinsic electronic and catalytic properties. Such properties have allowed for its wide application within many disciplines ranging from conversion of solar energy,13 lithium ion batteries,14 supercapacitors,15 heterogeneous catalysis,16 and electrochemical sensor.12,17 Among these potential applications, the exploration of enzyme-less electrochemical sensor especially for glucose has been intensively investigated.17,18 Successful synthesis strategies have been employed to control the morphology of CuO nanostructures as nanowires,19 nanobelts,20 nanoplatelets,21 nanospheres,22 nanorods,23 and nanofibres.24 Recently, a new class of hierarchical CuO micro-/nanostructures has been studied for the extension of its sensing applications.12,19,25 Sun et al.,18a reported the fabrication of hierarchical CuO nanoribbons using a green water/ethanol solution-phase hydrolysis of Cux(OH)2x−2(SO4) precursors. Such nanoporous CuO ribbons show a high sensitivity, low detection limit, and a good selectivity towards glucose. However, the relationships between the copper ion source, additives and morphology are not clear yet.
Diabetes is a chronic disease that occurs usually when the pancreas does not produce sufficient insulin. Unfortunately, about 387 million over the world living with diabetes, more than 77% of diabetes deaths occur in developing countries.26 Certainly, several efforts have focused upon developing of a cheap, stable and reliable sensor for self-monitoring of blood glucose levels as one modality that can help people to improve their glycemic control.27
Furthermore, ascorbic acid known as vitamin C, is a powerful antioxidant, which naturally occurs within citrus fruits and vegetable products. Significantly, the determination of ascorbic acid within biological fluids is very important to assess the amount of oxidative stress in the human metabolism, a process that has been linked to cancer, diabetes mellitus and several liver diseases.28 Over recent decades, the allure of electrochemical techniques has provided a broad array within environmental monitoring and clinical diagnostics. The development of an enzyme-less electrode has attracted considerable attention due to its simple, low fabrication cost, long term stability and good reproducibility which are the limitations of those enzymatic biosensors. However, the selectivity of the electrode sensor for target analytes is still great challenge.29
In this manuscript, we report a novel, effective design structure based on the ‘bottom-up’ self-assembly of elementary nano-building blocks of CuO nanostructures. The effect of copper ions source upon the CuO nanostructures assembly is explored for the first time. These unique micro/nanostructures are then utilised to produce disposable screen-printed electrodes. Additive-free, large-scale production and simple fabrication strategy of hierarchical CuO micro-/nanostructures were developed via one-step hydrolysis of [Cu(NH3)4(H2O)2]SO4 and [Cu(NH3)4(H2O)2]Cl2 precursors without any post-thermal treatment (Scheme 1). Such results show that this anion-dependent approach would effectively optimize the self-assembly of CuO nanoneedle and nanoplate building blocks to construct hallow sphere- and flower-like morphology, respectively. Interestingly, the nano-building block assembly of CuO micro-/nanostructures is of great significance in green design of simple, low-cost, and sensitive enzyme-less SPE for selective determination of glucose and ascorbic acid in real samples.
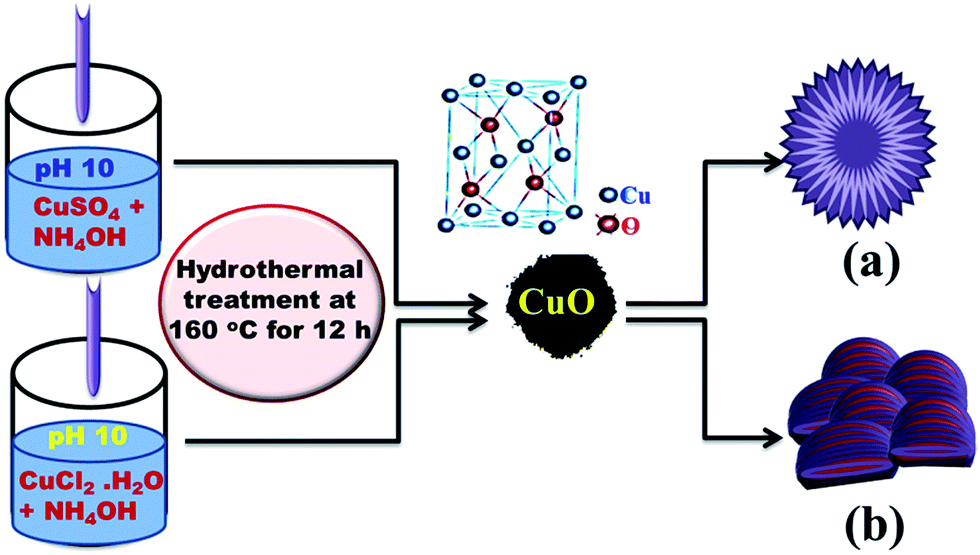 | ||
| Scheme 1 A schematic representation of the hydrothermal pathway of the copper-ion source hydrolysis approach. | ||
2. Experimental section
2.1. Reagents
All materials were used without any further purification. Cupric chloride dihydrate (CuCl2, 99.9%), anhydrous copper sulphate (CuSO4, 99.9%), ammonia solution (NH4OH) 28%, L-ascorbic acid, D-glucose, lactose, maltose and sodium hydroxide were all obtained from Sigma-Aldrich Company Ltd.2.2. Synthesis of CuO micro-/nanostructures
The fabrication of CuO flower- and sphere-like morphologies were carried out utilising a typical hydrothermal procedure, with 1.70 g of copper chloride dihydrate and 1.59 g of anhydrous copper sulphate precursors respectively dissolved (under constant stirring) in 50 mL deionized water. The solutions were introduced into a 100 mL Teflon-lined, stainless steel autoclaves. Then, the solutions were adjusted to pH 10 using ammonium solution (NH4OH, 28%). The autoclaves were sealed and maintained at 160 °C for 12 hours. Subsequently, these solutions were kept at room temperature. The black precipitates were collected, washed several times with water and ethanol to remove the remaining agents, and then dried at 45 °C for 6 hours.2.3. Fabrication of screen-printed electrodes (SPEs)
The screen-printed graphite electrodes were fabricated at Manchester Metropolitan University utilising appropriate stencil designs with a microDEK 1760RS screen-printing machine (DEK, Weymouth, UK). For each of the screen-printed sensors a carbon–graphite ink formulation (Product Code: product code: C2000802P2; Gwent Electronic Materials Ltd, UK) was first screen-printed onto a polyester flexible film (Autostat, 250 μm thickness).30 This layer was cured in a fan oven at 60 degrees Celsius for 30 min. Next, a silver/silver chloride (40![[thin space (1/6-em)]](https://www.rsc.org/images/entities/char_2009.gif) :60) reference electrode was applied by screen-printing Ag/AgCl paste (Product Code: C2040308P2; Gwent Electronic Materials Ltd, UK) onto the plastic substrate. This layer was once more cured in a fan oven at 60 degrees Celsius for 30 min. Last a dielectric paste ink (Product Code: D2070423P5; Gwent Electronic Materials Ltd, UK) was printed to cover the connections and define the 3 mm diameter graphite working electrode. After curing at 60 degrees Celsius for 30 min the screen-printed electrode is ready to use. Similar screen-printed platforms have been electrochemically characterized in a previous contribution.31,32
:60) reference electrode was applied by screen-printing Ag/AgCl paste (Product Code: C2040308P2; Gwent Electronic Materials Ltd, UK) onto the plastic substrate. This layer was once more cured in a fan oven at 60 degrees Celsius for 30 min. Last a dielectric paste ink (Product Code: D2070423P5; Gwent Electronic Materials Ltd, UK) was printed to cover the connections and define the 3 mm diameter graphite working electrode. After curing at 60 degrees Celsius for 30 min the screen-printed electrode is ready to use. Similar screen-printed platforms have been electrochemically characterized in a previous contribution.31,32
2.4. Fabrication of CuO electrodes
The CuO micro/nanostructure “paste” was prepared as previously reported by Grätzel et al.33 Briefly, 30.0 mg of CuO sample was mixed and sonicated for 10 min with a mixture of 5 μL acetic acid, 5 μL deionized water and 17.5 μL ethanol in glass beaker (1). A mixture (2) containing 100 μg of ethyl cellulose dissolved in 150 μL ethanol and 135 μL water were introduced into glass beaker (1). Then, 5 μL of the paste was drop-casted onto the screen-printed electrode (SPE) surface and left it to dry in oven at 50 °C for 24 hours.2.5. Amperometric measurements
The CuO-SPEs were activated in 0.1 M NaOH solution by successively sweeping from −1.0 to 0.8 V until the electrochemical signal became stable. A holding potential of +0.55 V was applied to the CuO-SPEs and the background current was allowed to decay to a steady state. The amperometric response was recorded as a function of glucose or ascorbic acid concentrations in the cell containing 20 mL of 0.1 M NaOH solution.2.6. Real sample analysis
Human blood and urine samples were collected from volunteers in hospital of Sohag University. The blood samples were centrifuged (3500 rpm/5 min). The supernatant of which was blood serum was obtained. 200 μL blood serum sample was injected into 19.8 mL of a stirring solution of 0.1 M NaOH. The amperometric current response was recorded using CuO MF-SPE and a standard addition method was used to determine the glucose concentration. As well as, 200 μL urine sample was injected into 19.8 mL of a stirring solution of 0.1 M NaOH. The amperometric current response was recorded using CuO HS-SPE and a standard addition method was used to determine the ascorbic acid concentration.2.7. Characterization of CuO micro-/nanostructures
The morphology of the as-synthesized CuO samples were investigated using field emission scanning electron microscopy (FE-SEM, JEOL model 6500). Before insertion into the chamber, the CuO powders were ground and fixed onto a specimen stub using double-sided carbon tape. Then, a 10 nm Pt film was coated via anion sputtering (Hitachi E-1030) at room temperature to obtain high-resolution micrographs. For better recording of FE-SEM images, the SEM was operated at 15 keV.High-resolution transmission electron microscopy (HR-TEM), electron diffraction (ED), and energy dispersive X-ray spectroscopy for elemental analysis (EDS) were performed using a JEOL JEM model 2100F microscope. HR-TEM was conducted at an acceleration voltage of 200 kV to obtain a lattice resolution of 0.1 nm. The HRTEM images were recorded using a CCD camera. In the HRTEM, ED and EDS characterization, the CuO samples were dispersed in ethanol solution using an ultrasonic bath, and then dropped on a copper grid. Prior to inserting the samples into the HRTEM column, the grid was vacuum dried for 20 min.
Wide-angle powder X-ray diffraction (XRD) patterns were measured X-ray diffractometer (Model FW 1700 series, Philips, Netherlands) using with monochromated CuKα radiation (λ = 1.54 Å), employing a scanning rate of 0.06° min−1 and 2θ ranges from 4° to 80°. The diffraction data were analysed using the DIFRAC plus Evaluation Package (EVA) software with the PDF-2 Release 2009. The Fourier transform infrared (FTIR) spectra of the CuO samples were recorded using Bruker Alpha FTIR instrument.
The textural surface properties and pore size distribution was determined by N2 adsorption/desorption isotherms at 77 K with a BELSORP36 analyzer (JP. BEL Co., Ltd.). The specific surface area (SBET) was calculated using the Brunauer–Emmett–Teller (BET) method with multipoint adsorption data from the linear segment of the N2 adsorption isotherm. The pore size distribution was determined from the analysis of desorption branch of isotherm using the nonlocal density functional theory (NLDFT).
The electrochemical experiments were performed using Autolab 302N potentiostat/galvanostat workstation. All measurements were conducted using a screen-printed electrode configuration. During the development of the protocol, the 3 mm CuO modified graphite working electrode of the screen-printed electrode was used with a platinum counter electrode and Ag/AgCl as reference electrode. Connectors for the efficient connection of the screen-printed electrochemical sensors were purchased from Kanichi Research Services Ltd (UK).34
3. Result and discussion
3.1. Formation mechanism of hierarchical CuO micro-/nanostructures
The copper oxide micro/nanostructures were fabricated as described in the Experimental section. Control over the particle morphology of CuO was clearly evident by using one-pot, simple hydrothermal synthesis (Scheme 1). Interestingly, it was noted that, the copper-ion precursors were effectively controlling the self-assembly of CuO nanoparticles within the hierarchical structures. The induced-water hydrolysis of [Cu(NH3)4(H2O)2]SO4 and [Cu(NH3)4(H2O)2]Cl2 was exploited for the formation of hierarchical CuO with sphere and flower morphologies, respectively. The suggested mechanism for the formation of CuO micro-/nanostructures involves a three-stage process and is as follows. Cupper(II) ion forms distorted octahedral complexes [Cu(H2O)6]Cl2 and [Cu(H2O)6]SO4 in water. Upon small additions of NH4OH solution, Cu(OH)2 primary crystals are formed. Continued addition of NH4OH solution leading to the formation of soluble deep blue complexes of [Cu(NH3)4(H2O)2]Cl2 and [Cu(NH3)4(H2O)2]SO4 which prevent spontaneous precipitation, and the eventual leading to the formation of a supersaturated solutions.18 Under hydrothermal conditions and heating at 160 °C, the solution becomes saturated; the ionic species exceed the solubility product by the release of H2O and NH3 molecules. According to the previous reports,18 The OH− ions replace NH3 in their complexes giving rise to layered structure of Cu2(OH)3Cl, and Cu3(OH)4SO4 units in strong alkaline solutions (eqn (1-1), (1-2), (2-1) and (2-2)). These units of Cu2(OH)3Cl, and Cu3(OH)4SO4 would be rapidly converted into charged and highly anisotropic Cu(OH)2 nuclei by water molecules. Wen et al.;18b suggested that, Cu(OH)2 nanoribbons preferentially grow along the [100] direction due to assembly of![[double bond splayed left]](https://www.rsc.org/images/entities/char_e009.gif) Cu(OH)2Cu
Cu(OH)2Cu![[double bond splayed right]](https://www.rsc.org/images/entities/char_e00a.gif) chains. As well as, the layer structures parallel to [010] direction are connected via hydrogen bonding between the tetra-coordinated OH− groups and two neighbouring bi-coordinated hydroxyls. Therefore, a ribbon-like structure was developed. Moreover, the counter ions Cl− and SO42− might be adsorbed on the (010) surface, which slow the growth along the [010] direction and control the stacking of nanoplates and nanoneedles to form flower and hollow sphere morphologies. Further, the sulphate oxygen atom helps to cross-link two adjacent layers and hence, strongly contributes to the formation of the three dimensional architectures. The Cu(OH)2 is a metastable phase which is easily transformed to the more stable CuO by thermal dehydration in aqueous media, because the solubility of Cu(OH)2 is 1.3 × 10⁻⁵ mol L−1 which is higher than that of CuO (2 × 10⁻⁷ mol L−1). By releasing of water molecules, the Cu(OH)2 converted to monoclinic CuO due to oxolation process at a relatively higher temperature without a trace of the subsequent annealing treatment in air (eqn (3)). Hence, the copper ions source can modify the subsequent precipitation process, which might affect the competition between thermodynamics and kinetics during the transformation of precursors, nucleation, growth and assembly of CuO nanostructures (see the following equations).
chains. As well as, the layer structures parallel to [010] direction are connected via hydrogen bonding between the tetra-coordinated OH− groups and two neighbouring bi-coordinated hydroxyls. Therefore, a ribbon-like structure was developed. Moreover, the counter ions Cl− and SO42− might be adsorbed on the (010) surface, which slow the growth along the [010] direction and control the stacking of nanoplates and nanoneedles to form flower and hollow sphere morphologies. Further, the sulphate oxygen atom helps to cross-link two adjacent layers and hence, strongly contributes to the formation of the three dimensional architectures. The Cu(OH)2 is a metastable phase which is easily transformed to the more stable CuO by thermal dehydration in aqueous media, because the solubility of Cu(OH)2 is 1.3 × 10⁻⁵ mol L−1 which is higher than that of CuO (2 × 10⁻⁷ mol L−1). By releasing of water molecules, the Cu(OH)2 converted to monoclinic CuO due to oxolation process at a relatively higher temperature without a trace of the subsequent annealing treatment in air (eqn (3)). Hence, the copper ions source can modify the subsequent precipitation process, which might affect the competition between thermodynamics and kinetics during the transformation of precursors, nucleation, growth and assembly of CuO nanostructures (see the following equations).| 3Cu2+ + 4OH− + SO42− ⇌ Cu3(OH)4SO4 | (1-1) |
| 2Cu2+ + 3OH− + Cl− ⇌ Cu2(OH)3Cl | (1-2) |
| Cu3(OH)4SO4 + 2H2O ⇌ 3Cu(OH)2 + 2H2SO4 | (2-1) |
| Cu2(OH)3Cl + H2O ⇌ 2Cu(OH)2 + HCl | (2-2) |
| Cu(OH)2 ⇌ CuO + H2O | (3) |
Fig. 1(A–D), shows the FE-SEM images of hierarchical CuO microstructures prepared without any additives. The hydrolysis of CuCl2 in the presence of NH4OH at pH 10 reveals uniform micro-bunches of CuO nanoplate clusters assembled in flower-like morphology (Fig. 1A). The bunches of these microflowers (MF) have an average diameter of ∼5 μm, which the thickness of the aggregated plates ∼220 nm. Such high magnification images reveal the formation of densely aggregated nanoplate clusters, with smooth fine surfaces that were aligned according to uniform flower morphology (Fig. 1B). Moreover, it is clearly evident that there is an interlayer spacing as macropores with slit-shape structure between the nanoplate arrays, enhancing the diffusion of ions and molecules to their respective active sites of the CuO crystals.
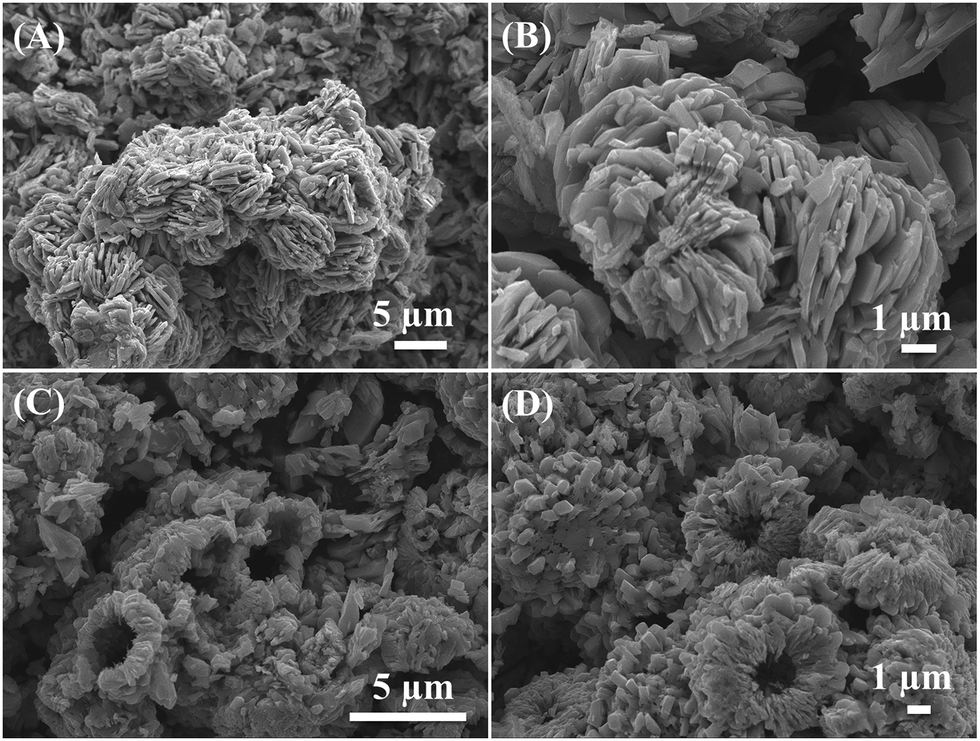 | ||
| Fig. 1 FE-SEM of CuO microstructures with flower and hallow sphere-like morphology synthesized without any additives using CuCl2 (A and B) and CuSO4 (C and D) precursors, respectively. | ||
While, the hydrolysis of CuSO4 in the same conditions reveals the formation of a hallow sphere (HS) consisting of closely packed nanoneedle arrays (Fig. 1C and D). The average size of aggregated needles is ∼230 nm, the diameter of sphere is ∼5.60 μm, and open pores are ∼1.66 μm. Interestingly, the needles are obviously rough and is an assembly of a large number of nanoneedles and voids, leading to the formation of hierarchical hallow sphere-like morphology. Overall, the SEM images demonstrate the versatility of metal-ion source approach over effectively control of the nanoparticle shape and their assembly in hierarchical microstructures.
The high-resolution transmission electron microscopy (HR-TEM) images [Fig. 2] clearly indicate that, the CuO MFs and HSs are composed form assembled plates and needles nanoblocks respectively with disordered porous network. These HR-TEM images showed the formation of CuO nanoplates and nanoneedles firstly and then assembled together to form CuO microstructures with flower- and hollow sphere-like morphology. According to the distinct color contrast of TEM images associated with flower structure (Fig. 2a and b), we could detect that the triangular nanoplate in the core region of flower were more compact than those in the exterior. Fig. 2b is a typical HR-TEM image of an individual CuO nanoplate, and it can be interestingly found that the plate is very thin and obviously rough with size about 270 nm. Moreover, the most prominent feature was that the plate showed uniform arrangements and continuous ordering of lattice fringes over large-scale regions without distortion. The TEM image (Fig. 2c), in general, revealed well-organized lattice fringe arrays over a large area with a distance between two lattice fringes of 0.23 nm that features the interplanar space of (111) facets of monoclinic crystal lattices. Fig. 2d showed the corresponding selected area electron diffraction pattern (ED) of CuO nanostructure. The figure shows that the CuO particles are single crystalline in nature.
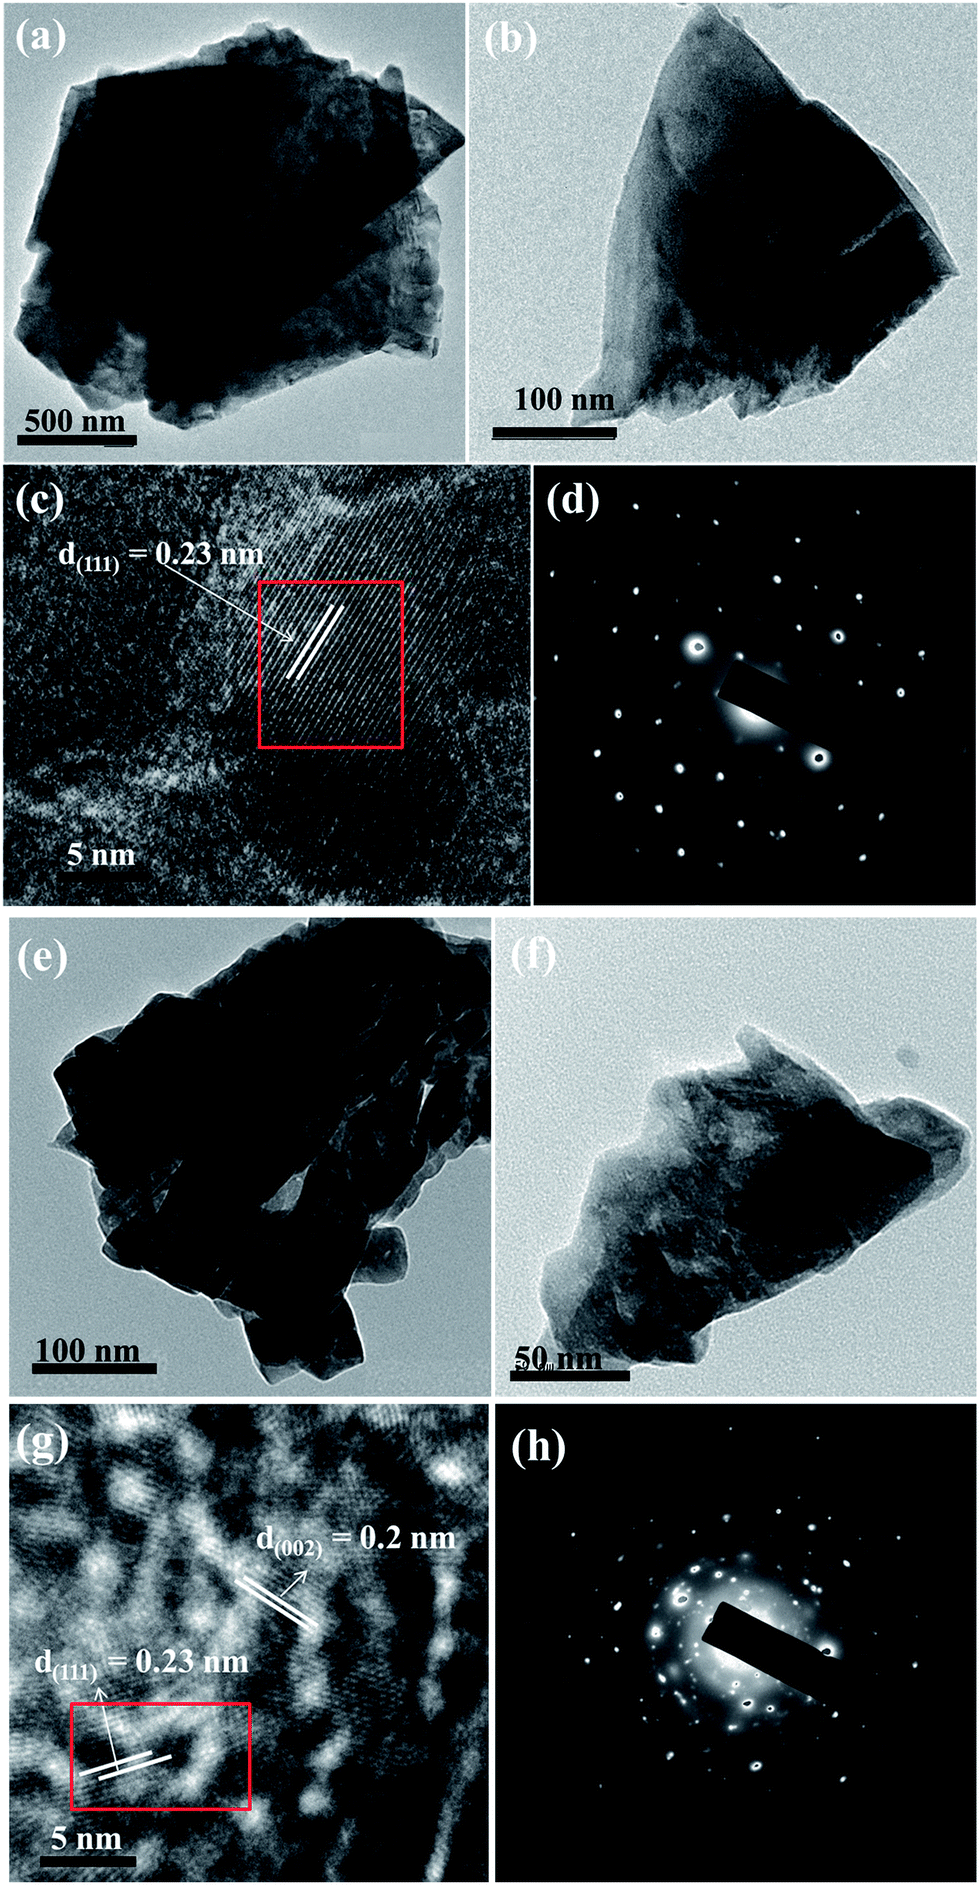 | ||
| Fig. 2 HR-TEM and SAED images of CuO nanostructures, (a–d) CuO MFs and (e–h) CuO HSs. | ||
The Fig. 2e and f showed the HRTEM images of nanoneedle aggregates to form CuO hollow sphere. The diameter of the single needle varied from the base to the tip, i.e. sharpened tips with wider bases. The wider base of the needle connected to each other, rooted in the center to form a sphere-like morphology. Fig. 2g showed the lattice fringes with an interspacing of 0.23 nm and 0.2 nm corresponding to the distance between (111) and (002) facets respectively of the monoclinic CuO lattice. The representative ED image [Fig. 2h] indicates the high crystallinity of the porous CuO nanostructures. These results are consistent with the XRD results (see below).
3.2. Structural and textural features
Fig. 3a shows the wide angle XRD patterns of the hierarchical CuO microstructures utilising different Cu-ion precursors. It is clear that they exhibit typical diffraction peaks of monoclinic Tenorite CuO phase of (JCPDS, no. 02-1040) and no impurities are detected, indicating that the CuO microstructures are pure and well crystalline. Although, the anion in copper ion source has largest effects on CuO morphology, it cause greatly affect on the crystallographic orientation of CuO nanocrystals.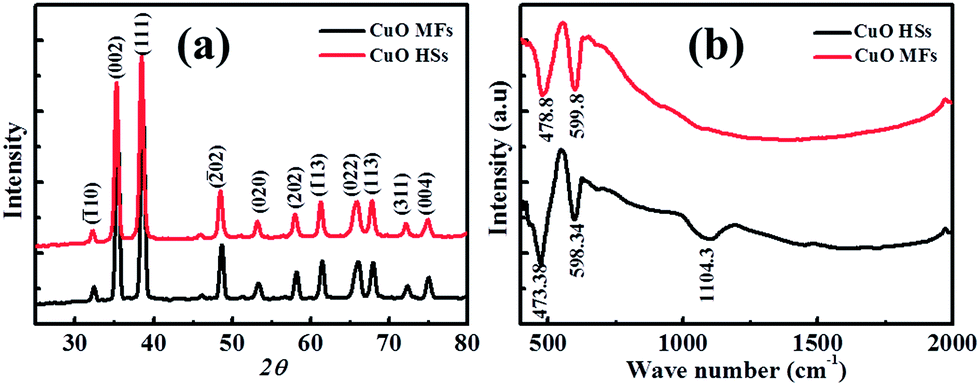 | ||
| Fig. 3 (a) Wide angle XRD patterns and (b) FTIR spectra of CuO microstructures. | ||
Fig. 3b shows the FTIR spectra of CuO microstructures. They exhibited strong absorption below 1000 cm−1, which confirmed the formation of the monoclinic CuO crystal phase. The characteristic peaks at 473.8 and 598.3 cm−1 are due to the vibrational modes of Cu–O bond in CuO HSs, while these shifts slightly in CuO MFs. Furthermore, the absorption peak at around 1104 cm−1 may be attributed to –OH bending vibrations combined with copper atoms. Energy dispersive spectroscopy (EDS) analysis of the CuO microstructures suggested the presence of Cu and O signals devoid of any other metal and impurity (Fig. S1 within ESI†). The O and Cu atoms were originally found in the CuO nanocrystals. The atomic ratios of [O]/[Cu] are 0.95 and 1.186 for CuO MFs and HSs respectively. The EDS and FTIR analysis suggested that CuO HSs have higher content of oxygen atoms on the surface compared to CuO MFs. This significant feature of CuO microstructures might show comparable electrochemical activity.
The porous network of hierarchical CuO structures were investigated using nitrogen adsorption/desorption isotherms (Fig. 4). The specific surface areas SBET were calculated by employing the Brunauer–Emmett–Teller (BET) method and the pore size distributions were obtained by means of the nonlocal density functional theory (NLDFT) equation using the adsorption isotherm branch. The CuO HSs feature type IV isotherms with a H2-type hysteresis loop for typical mesocage materials with large pore cavities. However, CuO MFs show type II isotherms without any hysteresis loops. It is worth noting that the porous CuO samples featured a specific surface area of SBET = 60.37 m2 g−1, and 60.24 m2 g−1, for CuO MFs and HSs respectively. The pore size distribution show bimodal distribution centred at 4.4 nm and 108 nm for CuO MFs and 5.4 nm and 108 nm for CuO HSs. These results are in accordance with SEM and HR-TEM micrographs (Fig. 1 and 2). In general, the mesopore within the hierarchical CuO microstructures is probably related to the pores present inside the nanoplates or nanoneedles, which were formed between primary crystallites. However, the macropore is related to assembly of secondary crystals of plates or needles. Such control of hierarchical surface morphologies with well-developed porous network offer great advantageous in electrochemical applications since macropore channels permit fast ions transport, while the mesopores provide more electroactive sites for redox reactions.
 | ||
| Fig. 4 (a) Nitrogen adsorption–desorption isotherms of CuO microstructures and (b) their corresponding NLDFT pore size distribution plots. | ||
3.3. Electrochemical characterization of hierarchical CuO nanostructures
The electrochemical activities of the CuO-SPEs were studied by cyclic voltammetry (CV) with 50 mM potassium ferricyanide redox probe [Fe(CN)6]3+ and 0.1 M KCl as supporting electrolyte. Fig. 5a and b show a series of cyclic voltammograms recorded as a function of a range scan rates for CuO MF- and CuO HS-SPEs. It is clear that the cyclic voltammograms are not identical with the same experimental setups. They exhibit a quasi-reversible one-electron transfer behaviour with a peak separation (ΔEp) of ca. 213 and 140 mV (vs. Ag/AgCl) for CuO MF and CuO HS samples at a scan rate of 10 mV s−1 respectively. However, the CuO MF sample exhibits the greatest peak current compared to CuO HS. These variations within the peak current resulting from the dimension of building-up diffusion zone at electrode surface due to the morphological features of CuO microstructures.35 The analysis of the cyclic voltammetric curves of CuO samples were performed, where the peak height (Ip) was presented as a function of scan rate (ν) which are found to be linear (CuO MF, Ip (A) = 20 × 10−6 A (V s−1)−0.5 + 10.4 × 10⁻⁶ A, R2 = 0.982; CuO HS, Ip (A) = 3.33 × 10⁻⁶ A (V s−1)−0.5 + 0.51 × 10⁻⁶ A, R2 = 0.987). It can be clearly seen that the peak current of both CuO microstructures increases linearly with the increase of the square root of the scan rate, corresponds to diffusion controlled processes governed by the Randles–Ševćik equation. Moreover, the effective surface area of CuO MF is six times higher than that of the CuO HS. The Nicholson method was applied to estimate the observed standard heterogeneous electron transfer rate constant, ko for quasi-reversible systems.36 The ko values were estimated to be of 2.01 × 10⁻⁴ and 7.4 × 10⁻⁴ cm s−1 for CuO MF and CuO HS respectively. The difference in ko values indicate that hierarchical CuO microstructures possessed variable electrochemical reactivity, and thus, the investigation of the electrochemical sensing platforms will be promising.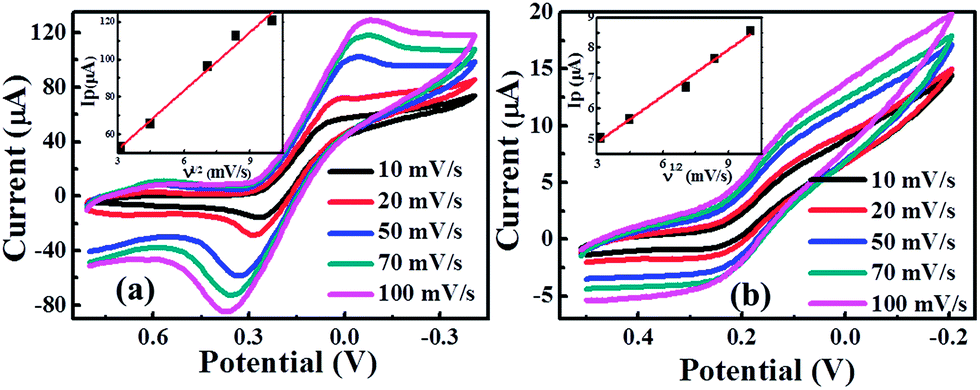 | ||
| Fig. 5 CV curves of 50 mM potassium ferricyanide/0.1 M KCl using CuO-SPE electrodes (a) CuO MFs, and (b) CuO HSs at different scan rates. | ||
3.4. Enzyme-less features of hierarchical CuO microstructures
The electrochemical performance of the hierarchical CuO micro-/nanostructures modified SPE were investigated by CV in 20 mL NaOH (0.1 M) solution as the supporting electrolyte. Fig. 6a depicts CV curves of CuO microstructures in absence and presence of 5 mM glucose. There is no obvious current signal observed in the absence of glucose for both CuO-SPE electrodes. After injection of glucose, the oxidation current was increased remarkably at +0.55 V (vs. SCE) for CuO MFs however, in the case of the CuO HSs did not show any significant change. Although they were synthesized via the same route, CuO MFs have a good electrocatalytic activity towards the oxidation of glucose. Interestingly, the anion-dependent approach would effectively control the electrocatalytic activity of CuO microstructures. In addition, the previous experiments were conducted within phosphate buffer solution (pH 7.5) instead of an alkaline medium (Fig. S2 within ESI†). The CuO microstructures did not show any current response, which indicates that the OH− ions have a significant role within the electrocatalytic oxidation process. The electrocatalytic oxidation mechanism of glucose onto CuO MFs modified SPE can be described in the following eqn (4)–(6);| CuO + OH− → CuOOH + e− | (4) |
| Cu(III) + glucose + e− → gluconolactone + Cu(II) | (5) |
| Gluconolactone → gluconic acid | (6) |
 | ||
| Fig. 6 (a) Cyclic voltammograms of CuO-SPE in 0.1 M NaOH in absence and presence of 5 mM glucose, and (b) effect of scan rate in a solution of 5 mM glucose and 0.1 M NaOH onto CuO MFs [in-set the relation between peak current and square root of scan rate]. | ||
Significantly, CuO MF was electrochemically oxidized to strong oxidizing agent Cu(III) species (i.e. CuOOH) and then glucose is catalytically oxidized to gluconolactone, which subsequently hydrolysed to gluconic acid. The oxidation of glucose has been also investigated at different scan rates (10–100 mV s−1) (Fig. 6b). Noticeably, the oxidation current is linearly correlated with square root of scan rate with slightly positive potential shifts; Ip (A) = 2.94 × 10⁻⁶ A (V s−1)−0.5 + 31.5 × 10⁻⁶ A, R2 = 0.98. This observation reveals that, electrocatalytic oxidation of glucose is governed by a diffusional process.
Fig. 7a shows cyclic voltammograms of successive additions of 1.0 mM glucose into a 20 mL NaOH (0.1 M) solution. Upon the increase of the glucose concentration, a gradual growth within the current (with positive potential shift) can be observed utilising the CuO MF-SPE. The electrochemical oxidation of glucose was explored over the concentration range of 1 mM to 7 mM, with exceptional linearity; Ip/μA = 10.84 μA mM−1 + 35.02 μA, R2 = 0.99.
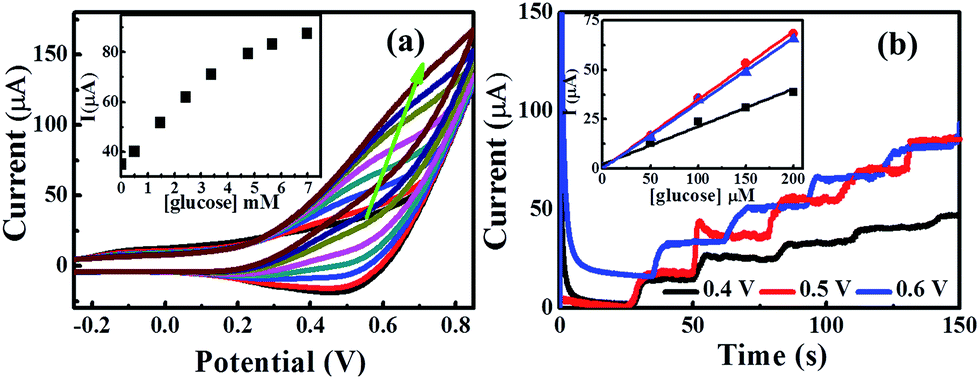 | ||
| Fig. 7 (a) Cyclic voltammetry of successive additions of 1.0 mM glucose into 20 mL NaOH (0.1 M) [in-set the peak current analysis of glucose additions at scan rate: 50 mV s−1], (b) amperometric current signals of the CuO MF-SPE under different working potentials upon successive additions of 50 μM glucose. | ||
Furthermore, a chronoamperometric method was utilised to obtain better sensitivity because enhanced analytical signals can be achieved by optimizing the working potential of lower background currents. The effect of applied potential was tested by successive amperometric measurements of 0.5 mM glucose additions into a stirring 0.1 M NaOH at different potentials ranging from +0.4 V to +0.6 V (Fig. 7b). The largest sensitivity was observed at +0.5 V which also used for the subsequent amperometric measurements.
Fig. 8 is a typical amperometric response of the hierarchical CuO MF-SPE electrode with successive additions of a certain concentration of glucose into continuously stirred 0.1 M NaOH solution at an applied potential of +0.55 V (vs. SCE). Since there was no obvious amperometric response to dissolved oxygen within the NaOH solution upon a CuO MF-SPE, the glucose can be detected in the presence of oxygen. It was clearly seen that the modified electrode exhibits a fast and sensitive response towards the electrocatalytic oxidation of lower and high concentrations of glucose (Fig. 8a and b). The response time for detection of glucose using CuO MF-SPE is ∼2.0 seconds (in-set Fig. 8b). The amperometric oxidation current increased linearly with increasing concentration of glucose over the concentration ranges 0.05–3 mM; Ip/μA = 0.027 μA μM−1 + 0.42 μA, R2 = 0.99, N = 3; with the detection limits of 10 μM (S/N = 3σ) and the sensitivities were estimated to be 383 μA mM−1 cm−2, indicating superior electrocatalytic oxidation behaviour of CuO MF toward lower and higher concentration of glucose. Such electrodes show high sensitivities, fast responses, and linear ranges within the realm of blood glucose concentration within the human body (i.e. 2–10 mM) as shown in Fig. S3,† which is promising in online glucose monitoring compared with other sophisticated sensors reported in the literature.37
 | ||
| Fig. 8 Typical amperometric current responses of CuO MF-SPE with successive additions of glucose (a) into a stirring 0.1 M NaOH at +0.55 V. (b) Analysis of the amperometric profiles in terms of the current as a function of glucose concentrations. | ||
3.5. Reproducibility and selectivity of enzyme-less CuO nanostructures
The reproducibility of CuO MF- and CuO HS-SPE were investigated by determining 100 μM glucose and ascorbic acid respectively in a stirred solution of (0.1 M) NaOH. Five CuO MF- and CuO HS-SPEs were prepared and tested independently, the relative slandered deviation (RSD) of 2.374% and 1.79% were obtained. Moreover, successive amperometric measurements of 100 μM were repeated on the same electrode which yielded a RSD of 3.7% and 2.67% for CuO MF- and CuO HS-SPE respectively.Next, attention was turn to perform selectivity experiments as one of the significant analytical factors for an amperometric sensor. The selectivity experiments of glucose in a stirred solution of NaOH were carried out using CuO MF and CuO HS-SPEs in the presence of 1 mM of possible interferes such as lactose, maltose, and ascorbic acid. Interestingly, we found that, the CuO MF- and CuO HS-SPE are highly selective for glucose and ascorbic acid respectively at +0.55 V (vs. SCE). As shown in Fig. 9a and b, the current responses of CuO MF- and CuO HS-SPEs to the oxidation of glucose and ascorbic acid remain almost constant. A good linear relationship can be obtained up to 6 mM of glucose and ascorbic acid even in presence of co-existing electroactive species. Indicating excellent specific selectivity of these CuO MF- and CuO HS-SPEs towards glucose and ascorbic acid respectively (Fig. 9c and d). Such promising selectivity of CuO microstructures are related to anion-dependent approach which effectively optimize the active surface of self-assembled CuO nano-building blocks in hierarchical structures (Table S4†). The selectivity of CuO micro-/nanostructures is related to their surface properties. Ascorbic acid is a well-known reducing agent both in vivo and in vitro.38 Hence, the oxidation of ascorbic acid is preferentially onto CuO HSs due to relatively higher oxygen-surface content as shown in EDS data. The oxidation process of ascorbic acid can be described in the following steps;
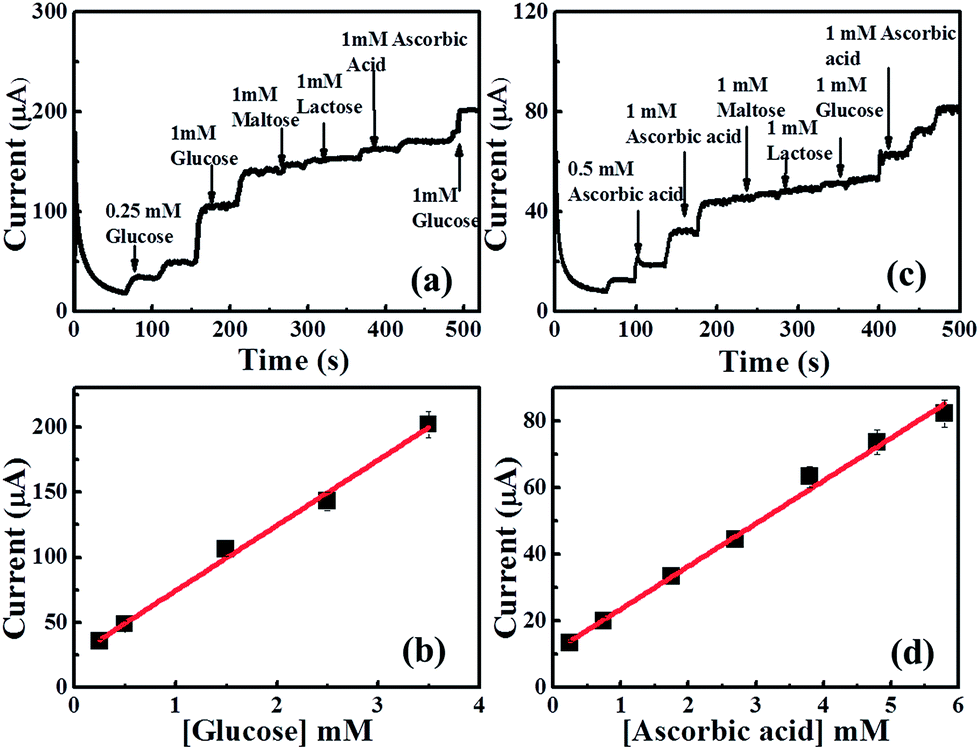 | ||
| Fig. 9 Amperometric responses of the CuO MF and CuO HS modified SPE at +0.55 V to 1 mM glucose and 1 mM ascorbic acid respectively and different interfering species in a stirring 0.1 M NaOH. | ||
(1) The ascorbic acid molecules are firstly diffused and then adsorbed onto the active site of CuO HSs.
(2) The adsorbed ascorbic acid molecules are oxidized to dehydroascorbic acid catalysed by the conversion from CuO to Cu2OOH on the surface.
Next, our attention was focused on the determination of ascorbic acid using CuO HS in a stirred solution of 0.1 NaOH (Fig. S5†). The successive amperometric additions of ascorbic acid in a stirred (0.1 M) NaOH was shown in Fig. 10a and b. The amperometric currents increased linearly with ascorbic acid concentrations over the concentration ranges 0.1–7 mM; Ip/μA = 37.24 μA mM−1 + 10.59 μA, R2 = 0.99, N = 3; with the detection limits of 90 μM (S/N = 3σ) and the sensitivity was estimated to be 533 μA mM−1 cm−2. The CuO HS-SPE shows wider concentration ranges and excellent sensitivity towards the oxidation of ascorbic acid than those reported previously.39
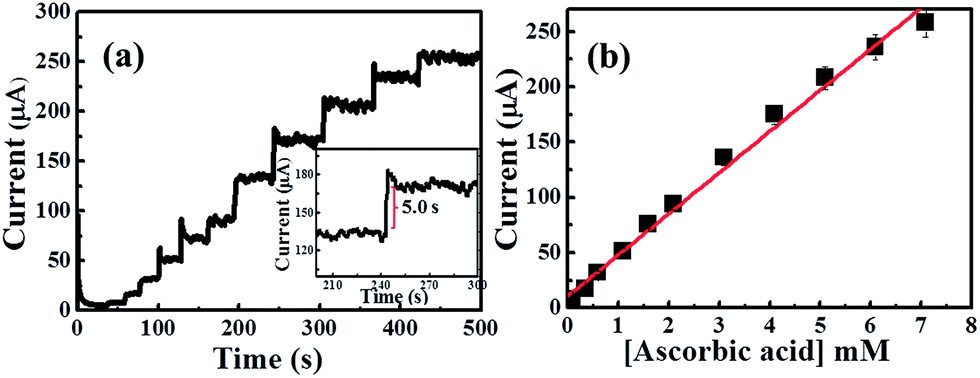 | ||
| Fig. 10 Typical amperometric current responses of CuO HS modified SPE electrode with successive additions ascorbic acid (a) into a stirring 0.1 M NaOH at +0.55 V. (b) Analysis of the amperometric profiles in terms of the current as a function of ascorbic acid concentrations. | ||
3.6. Real application of glucose measurements
In order to verify the applicability and feasibility of the CuO MF- and CuO HS-SPE for determination of glucose and ascorbic acid respectively. 200 μL blood serum sample or urine sample was added into 19.8 mL 0.1 M NaOH (see Experimental section). The amperometric current response was recorded at +0.55 V (vs. SCE) and a standard addition method was used to determine the glucose and ascorbic acid concentrations. Eight 100 μM of standard solutions of glucose or ascorbic acid were successfully added to the cell for slandered addition determination. Each sample was measured three times to overcome systematic error. The calculated results are summarized in Tables 1 and 2. Therefore, the proposed CuO MF- and CuO HS-SPE sensors are efficient glucose and ascorbic acid detection and could be used in practical applications.| Sample | Spectrophotometric method (mM) | CuO MF-SPE (mM) | RSD% |
|---|---|---|---|
| 1 | 7.99 | 7.89 | 1.89 |
| 2 | 5.05 | 5.0 | 1.7 |
| Sample | Added (mM) | CuO HS-SPE (mM) | RSD% | Recovery% |
|---|---|---|---|---|
| 1 | 0.25 | 0.245 | 2.1 | 98 |
| 2 | 0.5 | 0.51 | 1.65 | 102 |
4. Conclusions
In this manuscript, the hierarchical CuO micro-/nanostructures with sphere and flower-like morphology were successfully synthesized via a green solution-phase transformation of Cu3(OH)4SO4 and Cu2(OH)3Cl units in strong alkaline solutions, respectively. A novel hierarchical CuO microstructures modified screen-printed electrodes (SPE) has been designed upon an anion-dependent approach which effectively optimized the catalytic active surface for an enzyme-less determination of glucose and ascorbic acid. The CuO-SPE exhibited high electrocatalytic capabilities with an excellent selectivity and sensitivity, as well as wide linear range, low detection limit, good stability and reproducibility. In addition, the proposed sensors were successfully applied for glucose and ascorbic acid determinations in real samples, which give great promise for the future practical applications.Acknowledgements
The authors would like to acknowledge the support received from British Council and STDF through Newton-Mosharafa Fund, Project ID. 18435.Notes and references
- G. Shen, P.-C. Chen, K. Ryu and C. Zhou, J. Mater. Chem., 2009, 19, 828–839 RSC.
- M. Khairy and S. A. El-Safty, RSC Adv., 2013, 3, 23801–23809 RSC.
- H. Wang and A. L. Rogach, Chem. Mater., 2014, 26(1), 123–133 CrossRef CAS.
- L. Passoni, L. Criante, F. Fumagalli, F. Scotognella, G. Lanzani and F. D. Fonzo, ACS Nano, 2014, 8(12), 12167–12174 CrossRef CAS PubMed.
- C. Yuan, J. Li, L. Hou, J. Lin, X. Zhang and S. Xiong, J. Mater. Chem. A, 2013, 1, 11145–11151 CAS.
- Q. Wen, J. Di, Y. Zhao, Y. Wang, L. Jiang and J. Yu, Chem. Sci., 2013, 4, 4378–4382 RSC.
- M. Khairy, S. A. El-Safty and M. Ismael, Chem. Commun., 2012, 48, 10832–10834 RSC.
- Y. J. Hwang, C. H. Wu, C. Hahn, H. E. Jeong and P. Yang, Nano Lett., 2012, 12(3), 1678–1682 CrossRef CAS PubMed.
- J. Duan, W. Shi, L. Xu, G. Mou, Q. Xin and J. Guan, Chem. Commun., 2012, 48, 7301–7303 RSC.
- S. Lee, V. Sridhar, J. Jung, K. Karthikeyan, Y. Lee, R. Mukherjee, N. Koratkar and I. Oh, ACS Nano, 2013, 7(5), 4242–4251 CrossRef CAS PubMed.
- M. R. Alenezi, S. J. Henley, N. G. Emerson and S. R. P. Silva, Nanoscale, 2014, 6, 235–247 RSC.
- P. Gao and D. Liu, RSC Adv., 2015, 5, 24625–24634 RSC.
- Z. Zhangab and P. Wang, J. Mater. Chem., 2012, 22, 2456–2464 RSC.
- D. Liu, Z. Yang, P. Wang, F. Li, D. Wang and D. He, Nanoscale, 2013, 5, 1917–1921 RSC.
- A. Pendashteh, M. F. Mousavi and M. S. Rahmanifar, Electrochim. Acta, 2013, 88, 347–357 CrossRef CAS.
- M. R. Decan, S. Impellizzeri, M. L. Marin and J. C. Scaiano, Nat. Commun., 2014, 5, 4612, DOI:10.1038/ncomms5612.
- M. Yanga, J. Hea, X. Hua, C. Yana, Z. Chenga, Y. Zhaoa and G. Zuo, Sens. Actuators, B, 2011, 155, 692–698 CrossRef.
- (a) S. Sun, Y. Sun, A. Chen, X. Zhang and Z. Yang, Analyst, 2015, 140, 5205–5215 RSC; (b) X. Wen, W. Zhang and S. Yang, Langmuir, 2003, 19, 5898–5903 CrossRef CAS; (c) T. Soejima, H. Yagyu, N. Kimizuka and S. Ito, RSC Adv., 2011, 1, 187–190 RSC; (d) P. Deka, R. C. Deka and P. Bharali, New J. Chem., 2014, 38, 1789–1793 RSC.
- Z. J. Zhuang, X. D. Su, H. Y. Yuan, Q. Sun, D. Xiao and M. M. F. Choi, Analyst, 2008, 133, 126–132 RSC.
- T.-K. Huang, K.-W. Lin, S.-P. Tung, T.-M. Cheng, I.-C. Chang, Y.-Z. Hsieh, C.-Y. Lee and H.-T. Chiu, J. Electroanal. Chem., 2009, 636, 123–127 CrossRef CAS.
- H. Wei, J. J. Sun, L. Guo, X. Li and G. N. Chen, Chem. Commun., 2009, 2842–2844 RSC.
- E. Reitz, W. Z. Jia, M. Gentile, Y. Wang and Y. Lei, Electroanalysis, 2008, 20, 2482–2486 CrossRef CAS.
- X. Wang, C. G. Hu, H. Liu, G. J. Du, X. S. He and Y. Xi, Sens. Actuators, B, 2010, 144, 220–225 CrossRef CAS.
- G. Liu, B. Zheng, Y. Jiang, Y. Cai, J. Du, H. Yuan and D. Xiao, Talanta, 2012, 101, 24–31 CrossRef CAS PubMed.
- L. Zhang, H. Li, Y. Ni, J. Li, K. Liao and G. Zhao, Electrochem. Commun., 2009, 11, 812–815 CrossRef CAS.
- P. Ni, Y. Sun, Y. Shi, H. Dai, J. Hu, Y. Wang and Z. Li, RSC Adv., 2014, 4, 28842 RSC.
- J. Chen, R. Zhu, J. Huang, M. Zhang, H. Liu, M. Sun, L. Wang and Y. Song, Analyst, 2015, 140, 5578–5584 RSC.
- C.-J. Weng, P.-H. Hsu, S.-C. Hsu, C.-H. Chang, W. Hung, P.-S. Wu and J.-M. Yeh, J. Mater. Chem. B, 2013, 1, 4983–4991 RSC.
- H. Mao, H. Zhang, J. Liang, D. Liu, S. Wu, Y. Zhang, Y. Zhang, Q. Wu, G. Zhang and X.-M. Song, J. Mater. Chem. B, 2015, 3, 5310–5317 RSC.
- C. W. Foster, J. P. Metters, D. K. Kampouris and C. E. Bank, Electroanalysis, 2014, 26, 262–274 CrossRef CAS.
- R. O. Kadara, N. Jenkinson and C. E. Banks, Sens. Actuators, B, 2009, 138, 556–562 CrossRef CAS.
- M. Gómez-Mingot, V. Montiel, C. E. Banks and J. Iniesta, Analyst, 2014, 139, 1442–1448 RSC.
- S. Ito, P. Chen, P. Comte, M. h. Nazeeruddin, P. Liska, P. Péchy and M. Grätzel, Progress in Photovoltaics: Research and Applications, 2007, 15, 603–612 CrossRef CAS.
- F. E. Galdino, C. W. Foster, J. A. Bonacin and C. E. Banks, Anal. Methods, 2015, 7, 1208–1214 RSC.
- J. P. Metters, E. P. Randviir and C. E. Banks, Analyst, 2014, 139, 5339–5349 RSC.
- F. C. Vicentini, A. E. Ravanini, L. C. S. Figueiredo-Filho, J. Iniesta, C. E. Banks and O. Fatibello-Filho, Electrochim. Acta, 2015, 157, 125–133 CrossRef CAS.
- Y. Zhang, E. Zhou, Y. Li and X. He, Anal. Methods, 2015, 7, 2360–2366 RSC.
- Y. Ma, M. Zhao, B. Cai, W. Wang, Z. Ye and J. Huang, Biosens. Bioelectron., 2014, 59, 384–388 CrossRef CAS PubMed.
- J. Jiang and X. Du, Nanoscale, 2014, 6, 11303–11309 RSC.
Footnote |
| † Electronic supplementary information (ESI) available: Additional cyclic voltammetry and amperometric measurements of glucose and ascorbic acids were added. See DOI: 10.1039/c5ra22940e |
| This journal is © The Royal Society of Chemistry 2016 |