Nanocomposite polymer electrolytes based on poly(poly(ethylene glycol)methacrylate), MMT or ZSM-5 formulated with LiTFSI and PYR11TFSI for Li-ion batteries†
J. Cardosoa,
A. Mayrénb,
I. C. Romero-Ibarrac,
D. P. Navaa and
J. Vazquez-Arenas*b
aPhysics Department, Universidad Autónoma Metropolitana-Iztapalapa, Apartado Postal 55-534, D.F. 09340, Mexico
bDepartamento de Química, Universidad Autónoma Metropolitana-Iztapalapa, C.P. 09340, D.F., Mexico. E-mail: jgva@xanum.uam.mx; jorge_gva@hotmail.com
cUnidad Profesional Interdisciplinaria en Ingeniería y Tecnologías Avanzadas, Instituto Politécnico Nacional, Av. IPN No. 2580, Gustavo A. Madero, D.F., Mexico
First published on 11th January 2016
Abstract
Novel poly(poly(ethylenglycol)methacrylate) (pPEGMA) nanocomposite electrolytes (NE) based on montmorillonite (MMT) and zeolite (ZSM-5) with lithium bis(trifluoromethanesulfonyl)imide salt (LiTFSI) and 1-butyl-1-methylpyrrolidinium bis(trifluoromethylsulfonyl)imide (ionic liquid, PYR11TFSI) are synthetized using two different routes. Sonication technique is successfully used to introduce the fillers into the polymer matrix, provide uniform dispersion and shatter aggregates of nanofillers to ensure a polymer amorphous structure. The influence of the inorganic particle content (1, 3 and 5 wt%) and filler structure are discussed in terms of their thermal and morphological properties. SEM and TEM techniques reveal an efficient embedding of the fillers into pPEGMA, whereas analyses conducted with TGA/DSC, FTIR and XRD showed that for the binary systems BN-MMT and BN-ZSM-5 containing LiTFSI, the morphology of pPEGMA results into a crosslinking amorphous matrix where Li+ ion motion is hindered. This behavior stems from a strong interaction between the surface of the anionic nanofiller with methylene (CH2) groups from pPEGMA, and particularly anionic nanofiller with Li+. The addition of ionic liquid (IL) PYR11TFSI to ternary systems TN-MMT and TN-ZSM-5 abates the aforementioned interactions and leads to an increase of the interfacial layer separation, which grants flexibility to the polymer chains. These effects stem significantly enhancements in the ionic conductivities of TN-MMT (4.0 × 10⁻⁴ S cm−1) and TN-ZSM-5 (9.4 × 10⁻⁶ S cm−1) at 30 °C. The lower conductivity obtained for TN-ZSM-5 in comparison to TN-MMT is explained by considering that the introduction of (PYR11)+ to the host channels is blocked, since (PYR11)+ is larger compared to the diameter channel of ZSM-5 (≈0.56 nm), whereby only Li+ ions outside ZSM-5 can be efficiently transferred. Anisotropic conductivity is exhibited for these NE occurring by hopping motion through the formation of a weak coordination shell formed between ether oxygen and carbonyl oxygen from pPEGMA chain. These materials present adequate morphological, thermal and mechanical properties, and a significant enhancement of Li+ ion conductivity for green materials at room temperature to be considered as potential NE for Li-ion batteries.
1 Introduction
The research and development of new materials for energy storage applications have become critical to meet the technological and environmental requirements demanded for sustainable power sources. Li-ion batteries are very promising devices, since they are light, compact and present a maximum voltage around 5 V with specific energy ranging between 100 to 150 W h kg−1,1 and specific power spanning from 500 to 2000 W kg−1.2The synthesis of new electrolytes for Li-ion batteries has drawn less attention compared to cathode materials, their performance is also crucial to avoid capacity fade mechanisms, providing electrochemical stability to electrodes (i.e. safety), limiting the power rate to some extent, and fabricating devices with non-toxic materials. Typically, liquid organic electrolytes have been used since they present high ionic conductivities related to a high dissociation degree, however, they are considerably toxic and can cause spills, flammability, short circuits within the device. A tractable alternative is the design of “dry” batteries, where a polymer acts concomitantly as electrolyte and separator. Likewise, polymer electrolytes (PE) have also complied with standard requirements to be functional in Li-ion batteries, standing out in some aspects with respect to liquid or solid electrolytes:3–5 (a) electrochemical stability in a wider voltage range to the occurrence of anodic and cathodic reactions, (b) low glass transition temperature to enable chain segmental motion, assisting ionic mobility, (c) thermal and mechanical stability, (d) adequate physical strength to allow easy handling, (e) chemical resistance to degradation, and (f) high conductivity to avoid limitations of current flowing in the solid phases. On the other hand, the ionic conductivity of PE is determined by the degree of salt dissociation, the number of charge carriers, and the interaction between the ions (i.e. Li+) and the polymer chain, which are all strongly affected by salt concentration.
Polyoxymethylene (PEO) is a polymer solvent that can interact electrostatically with Li+ due to polar groups (CH2CH2O) within its structure (e.g. crown-type coordination).1,6,7 It also presents a low glass transition temperature due to an enhancement of its intermolecular ionic mobility (i.e. chain segmental motion), whence it is basis of multiple solid polymer electrolytes for lithium batteries.8–11 However, PEO has a high degree of crystallinity at room temperature (approximately 60%). The crystalline segments adopts a monoclinic unit cell with two PEO chains interlocking to form cylinders. Li+ residing in a row inside each of the cylinders-like.12 At high salt concentration, the ions are trapped into the cylinders, forming aggregates (ion pairs, triplets, quadruplets) which restrict the mobility of polymer chains and consequently decrease the ionic conductivity of the material. In dilute concentrations, the Li+ ion transport occurs in the amorphous segmental chains (40%) above of its Tg (≈−46 °C), and the optimized ionic conductivity is achieved above of its melting temperature (Tm).13 For this reason, synthetic strategies have been proposed to obtain totally amorphous phases of PEO with high dimensional properties, since this phase enhances ionic transport.14,15 In an attempt to improve mechanical strength, Kim et al.15 and Giles et al.16 have used block copolymers, however the amount of salt was limited to avoid the formation of aggregates.17 An alternative to alleviate this problems is the introduction of inorganic fillers in order to generate nanocomposites.
Nanocomposites electrolytes (NE) have been successfully designed for these purposes. In polymer nanocomposites, the filler have at least one dimension in the nanometer scale, the optimum nanoparticle content is a sensitive function of their dispersion in the host polymer.18–20 Each filler possesses specific surface chemistry that differently promotes ion-pair dissociation, which in turn affects the number of ions participating in the conduction mechanism.21 Aluminosilicates such as clays and zeolites present anionically charged surfaces. Their anions are relatively larger compared to traditional salts used in PE (e.g. (CF3SO2)2N−, PF6−). In MMT structure, alkaline earth cations reside in the galleries between the layers (2D).18,22 Meanwhile, zeolite (ZSM-5) with a 3D framework has negative charge that can be located within its channels on the external surface. The channel diameter in ZSM-5 is limited (≈0.56 nm), whence it can be only a host matrix for small cations and molecules.18 Although, it is believed ZSM-5 with frame-type structures (3D) could increase the interconnectivity of channels with the polymer matrix to improve the number of “pathways” to transfer cations. ZSM-5 has been also used as important mesoporous material in catalysis and photocatalysis due to these features.23–25
On the other hand, IL is an excellent candidate to combine with NE since it presents many transferable properties, including chemical and electrochemical stability, and high ionic conductivity.26,27 The criterion to adequately select an IL for a NE is a common anion between salt and IL, which avoids ion pair formation via cross-contact. Additionally, the salt needs to display low lattice energy to be able to form complexes with the polymer host. LiTFSI exhibits a high salt dissociation due to inherently properties of its structure. A high degree of charge delocalization is present along (TFSI)−, as a result of the combination of strongly electron-withdrawing fluorine atoms and resonance structures due to sulfonyl groups. It is also highly flexible with two low-energy conformations in CF3 groups (cis or trans) avoiding cross-linking between polymer chains.27–29
The above studies reveal the potentials of MMT and ZSM-5 to increase mechanical strength and thermal stability of a polymer matrix, in order to improve salt dissociation. Under this premise, if an amorphous polymer such as pPEGMA is used to avoid cross-link salt of polymer chains, and introducing significant amounts of LiTFSI and IL PYR11TFI, a novel NE can be designed with enhanced mechanical, thermal and electrochemical properties for sustainable Li-ion batteries. In addition, a comparison of the ionic properties of these NE comprised of either MMT or ZSM-5 under similar conditions is paramount at this point to elucidate the advantages of introducing fillers with 2D or 3D structure. Therefore, this work is devoted to the synthesis and characterization of properties and performance of NE. Two different routes of synthesis based on a pPEGMA matrix and two nanofillers (MMT or ZSM-5) are explored. These NE are formulated with LiTFSI (lithium salt) and PYR11TFSI (IL), which present a common anion. Ionic conduction for the NE are discussed in terms of the chemical (TGA/DSC, FTIR, XRD, elemental analysis, SEM, TEM) and electrochemical (EIS) characterizations. It is expected that this study contributes to understand the complex interface formed by the nanofiller/polymer, nanofiller/salt and its role in the lithium salt dissociation, in order to increase the use of environmentally friendly nanocomposites as polymer electrolyte for Li-ion batteries.
2 Experimental
2.1 Materials
The following analytical grade reagents were used in this work: poly(ethylene glycol) methacrylate (PEGMA, 360, structure shown in Fig. 1a), lithium bis(trifluoromethanesulfonyl)imide salt (LiTFSI) with a purity of 99.9%, and ionic liquid (IL): 1-butyl-1-methylpyrrolidinium-bis(trifluoromethylsulfonyl)imide (PYR11TFSI) (Fig. 1b) with a purity of 98%. These reagents were purchased from Aldrich. Additionally, the following inorganic nanofillers were also utilized during the synthesis procedure: clay montmorillonite-K 10 (MMT), which had a CEC of 135 meq/100 g and specific area of 250 m2 g−1 obtained from Sigma Aldrich and commercial zeolite ZSM-5 from Alfa-Aesar. All reagents were used as received.
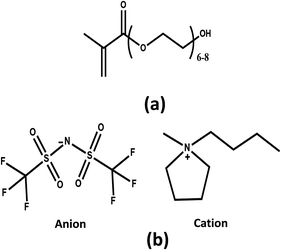 | ||
| Fig. 1 Structure of (a) poly(ethylene glycol)methacrylate (PEGMA), (b) anion (bis(trifluoromethanesulfonyl)imide) and cation (1-butyl-1-methylpyrrolidinium) groups of ionic liquid PYR11TFSI. | ||
2.2 Nanocomposite preparation
25 mg of MMT (1 wt%) were dispersed in 5 mL of water followed by a slow addition of 2.5 g of PEGMA solution. The mixture was magnetically stirred for 24 h at room temperature. Then, it was sonicated to homogenize for 4 h (method I). Subsequently, the nanocomposite was thermally polymerized at 200 mmHg and 90 °C for 24 h. This material was washed with acetone and dried in a vacuum oven at 60 °C and kept in a desiccator for further use. A similar procedure was followed for the other compositions (3 and 5 wt%). Alternatively in a second method (method II), magnetic stirring was skipped and sonication was directly performed for 3 h.In addition, a sample of PEGMA monomer was polymerized (pPEGMA) using the same conditions as the nanocomposites, to compare the properties of the material without nanofillers. Elemental analysis was conducted with a Perkin Elmer Analyzer CHNSO 2400 to verify the chemical structure of the pPEGMA. Elemental Analysis by theoretical estimation (%) C: 54.84; H: 8.63; O: 36.53; experimental (%) C: 54.81; H: 8.69; O: 36.5. The theoretical value was calculated considering that the number of ethoxy groups in the polymer chain was seven. Since there is a good agreement between the theoretical and experimental data of the elemental analysis, seven ethoxy groups were considered to select the concentration of lithium salt. Thus, assuming there are from 3 to 4 oxygen atoms interacting with one Li+, the salt concentration should be of 1.5 mol per monomeric unit in the polymer.
2.3 Preparation of nanocomposite electrolytes formulated with LiTFSI and PYR11TFSI
Nanocomposites electrolytes were prepared with nanocomposite (inorganic nanofiller/pPEGMA), LiTFSI and PYR11TFSI. The samples were labeled as follow: the nanocomposite formulated in basis of the polymer with nanofiller was labeled as simple system (SN), the NE comprised of SN and LiTFSI was labeled as binary system (BN), and the BN combined with PYR11TFSI was labelled as ternary system (TN). BN-nanofiller and TN-nanofiller were prepared in molar ratios of 1![[thin space (1/6-em)]](https://www.rsc.org/images/entities/char_2009.gif) :
:![[thin space (1/6-em)]](https://www.rsc.org/images/entities/char_2009.gif) 1.5 and 1
1.5 and 1![[thin space (1/6-em)]](https://www.rsc.org/images/entities/char_2009.gif) :
:![[thin space (1/6-em)]](https://www.rsc.org/images/entities/char_2009.gif) 1.5
1.5![[thin space (1/6-em)]](https://www.rsc.org/images/entities/char_2009.gif) :
:![[thin space (1/6-em)]](https://www.rsc.org/images/entities/char_2009.gif) 1, respectively. The components were separately dissolved in dioxane under vigorous magnetic stirring and then integrated into a single solution. They were cast into a circular Teflon mold. Residual solvent was evaporated in vacuum oven at 60 °C to obtain the polymer electrolyte film. These films were white and kept in a desiccator until further use.
1, respectively. The components were separately dissolved in dioxane under vigorous magnetic stirring and then integrated into a single solution. They were cast into a circular Teflon mold. Residual solvent was evaporated in vacuum oven at 60 °C to obtain the polymer electrolyte film. These films were white and kept in a desiccator until further use.
2.4 Nanocomposite characterization
Thermogravimetric experiments were carried out using a PYRIS Perkin Elmer under a nitrogen flow at 50 cm3 min−1. Glass transition temperatures (Tg) were determined by Modulated Differential Scanning Calorimeter MDSC2920 manufactured by TA Instruments. The thermograms were acquired from the nanocomposites without previous treatment. Modulated DSC scans were carried out at a heating rate of 10 °C min−1 under nitrogen atmosphere at 50 mL min−1 with amplitude of ±0.5 °C, and a period of 40 seconds within the range from −70 to 150 °C. Tg was obtained from the second or third run. Samples were previously heated in an aluminium pan at 100 °C for 60 minutes to remove remaining water in the sample.Fourier transformed infrared spectra (FTIR) were collected with a 2 cm−1 resolution from a 1500 Perkin Elmer using Attenuated Total Reflection (ATR) device. X-ray diffraction patterns (XRD) were measured for the nanocomposites using a Bruker D8 Advanced diffractometer with Cu-Kα radiation, λ = 1.5406 Å, by performing sweeps at low angle from 2 to 10° of 2θ. Likewise, analyses in the 2θ range from 5 to 70° at room temperature were conducted. The diffractometer was operated at 40 kV and 35 mA. XRD was also used to determine the intercalation of the inorganic particle into the polymer matrix.
The microstructural characterization of the nanocomposites was determined via Scanning Electron Microscopy (SEM) and High-Resolution Transmission Electron Microscopy (HRTEM). The measurements were performed in a SEM JEOL JMS-7600F and HRTEM JEOL 2100F, respectively. The software package named Digital Micrograph was used to manage the images. Samples were fractured using liquid nitrogen for this analysis.
Samples used to carry out the impedance measurements (i.e. conductivity estimation) were carefully subjected to a procedure to remove the content of water from the composite sample. The sample was maintained in a vacuum oven at 100 °C for 48 h, and then a gentle drying in a vacuum oven (200 mmHg) at 60 °C for 24 h, until a uniform and free standing film with good mechanical strength was obtained. The casted films were then kept in a vacuum oven for 24 at 60 °C before assembling the cells. These samples were fixed inside a Teflon O-ring spacer whose constant cell was 0.18 cm−1, and placed between two electrodes (parallel stainless steel plates). The assembling of the cells and the electrochemical impedance spectroscopy (EIS) measurements were carried out inside a dry box at humidity ≤0.1%, under argon atmosphere and silica gel as desiccant agent. A humidity sensor was used to monitor the humidity. Temperature was controlled within the cell from 25 to 100 °C using a device previously described in ref. 30. This cell was equilibrated at the testing temperature for 30 min before collecting the EIS spectrum. A Multi-Potentiostat/Galvanostat VMP3 from Bio-Logic Science Instruments was used to apply a small-amplitude sinusoidal wave superimposed on a constant dc potential. The measurements were performed at open circuit potential in the frequency range 1.0 MHz to 0.1 Hz. The fits to the experimental data were calculated using a nonlinear regression algorithm coded in the Zview® software, and using well-established equivalent circuit proposed to estimate the ionic conductivity of these systems (refer to Section 3.2 for further details).
3 Results and discussion
3.1 Nanofiller with pPEGMA (SN)
Nanocomposites based on pristine pPEGMA and different inorganic filler contents (1, 3, 5 wt%) were synthesized using two different methods I and II, where the shear stress during the mixing process was varied (refer to Section 2.2). Sonication technique provides uniform dispersion and shatters aggregates of nanofillers. Therefore, it is the main technology for introducing nanoparticles into the polymer matrix with uniform and homogeneous distribution.27 The dispersion of MMT or ZSM-5 improves mechanical and thermal properties of pPEGMA matrix and maintains its amorphous morphology. Sonication time also induces intercalation of pPEGMA chains into the MMT galleries, and the anionic MMT surface enables the introduction of salt cations into the galleries, ensuring complete salt dissociation.31 Fig. 2 shows X-ray diffraction patterns of MMT and ZSM5 incorporated in the pPEGMA matrix. Fig. 2a and b exhibit a comparison of the synthesis methods I and II, respectively, for 1, 3, 5 wt% MMT incorporated into polymer matrix. Structural analysis by means of the characteristic reflection exhibited for montmorillonite in 2θ at ∼8.4° (±0.1°) corresponds to the 001 plane. The interlayer space gallery of the MMT is around 1.55 nm.32 In method I (Fig. 2a), the corresponding signal to the 001 plane disappears indicating the formation of exfoliated nanocomposite samples. The exfoliation could be due to mechanical stress that materials suffer during the synthesis. In method II the magnetic stirring was eliminated and the sonication time was reduced. Fig. 2b shows that the signal corresponding to the 001 plane disappears again in samples with content of 1 and 3 wt% MMT, which indicates the material exfoliation. However, a broad signal emerges around ∼4.5° of 2θ in the sample with 5 wt% MMT, suggesting the formation of a partially intercalated morphology. Thus, the MMT layers within this intercalated material could enable the Li+ transfer across their galleries and improve the ionic conductivity. Therefore, only the MMT nanocomposite synthetized with method II using 5 wt% of clay was used for further formulations.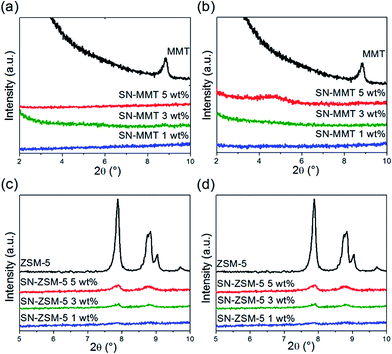 | ||
| Fig. 2 X-ray diffraction patterns for nanocomposites from pPEGMA matrix and nanofiller (SN): (a) MMT with method I, (b) MMT with method II, (c) ZSM-5 with method I and (d) ZSM-5 with method II. | ||
The second system consists of nanocomposites with 1, 3 and 5 wt% of zeolite ZSM-5. Fig. 2c and d show X-ray diffraction patterns for two different preparation methods I and II, respectively. The XRD patterns show two characteristic signals at 2θ values at ∼7.7 and 8.7° (±0.1°). These two signals were observed in Fig. 2c (method I), indicating that the nanocomposite formed 3D frame-type structures. The X-ray pattern (Fig. 2d) of nanocomposites synthetized by method II do not showed significant difference with respect to materials synthesized by method I. From these results, it is proposed that ZSM-5 can introduce selectively Li+ in their channels. These channels form conductive paths with the polymer matrix, which is very important for battery applications.32 Since similar results were obtained for both methods, the study was only continued with the pPEGMA/ZSM-5 5 wt% (SN-ZSM-5) nanocomposite synthesized using method II. Also, to be comparative with a similar MMT content.
The microstructural characteristics of both nanocomposites were analysed using SEM (Fig. 3a and c) and TEM (Fig. 3b and d). Dispersion of the inorganic particles in the polymer matrix was determined on the fracture area of the SEM micrographs. Fig. 3a shows the dispersion of 5 wt% MMT particles into the pPEGMA matrix. An uniform distribution of clay in the polymer matrix and the absence of tactoids are observed. The agglomerates of clay also exhibit a particle size distribution ranging from 20 to 50 nm (refer to Fig. 2S and 3S in ESI†). Fig. 3b shows the TEM micrograph of the 5 wt% MMT nanocomposite. The image evidences the layers of the MMT representing the intercalated system that was obtained with the clay laminar structure into the polymer matrix. Fig. 3c and d show the SEM and TEM images of the 5 wt% ZSM-5 nanocomposite, respectively. Contrary to MMT nanocomposites, the dispersion of ZSM-5 particles into the matrix is not clearly observed by SEM (Fig. 3c), but TEM image (Fig. 3d) reveals the zeolite embedded into the polymer matrix. Fig. 4S (ESI†) shows an inset for better appreciation of this effect. In summary, both examined systems present a uniform dispersion and fine distribution of the inorganic particles. Thus, confirming that the processing method used to obtain these hybrid materials is suitable to fabricate homogeneous systems and films with good mechanical properties and determined thickness.
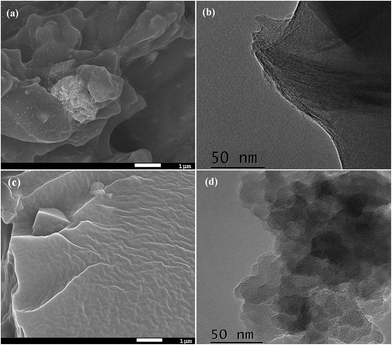 | ||
| Fig. 3 (a) SEM and (b) TEM images of SN-MMT containing 5 wt% nanocomposite. (c) SEM and (d) TEM images of SN-ZSM-5 containing 5 wt% nanocomposites. | ||
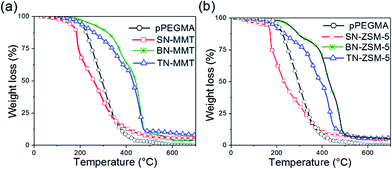
Fig. 4 shows the typical thermogravimetric analysis (TGA) for 5 wt% MMT and ZSM-5 nanocomposites. The TGA of pPEGMA is included for comparison purposes. In general, the first weight loss located around 200 °C corresponds to water content. Note that these materials never presented higher water content than 3.7%; residual water may be attributed to water molecules trapped in the interstices of the inorganic filler. The second loss is associated to the gradual decomposition of the polymer matrix occurring at temperatures around 430 °C, adjusting to the 5 wt% of the residual inorganic particle content. Table 1 summarizes the thermal analysis of the two series of SN-MMT and SN-ZSM-5 nanocomposites with 5 wt% content (data for 1 and 3 wt% not shown). In addition, in order to establish the influence of the potassium cation from MMT content on the thermal stability of pPEGMA, the degradation temperatures at 10% (Td 10%) were determined and given in Table 1. A quantitative analysis by EDS was performed in ternary materials. It was observed that the amount of potassium ion was less than 0.05%, whence this suggests that most of the potassium had been displaced from the structure.
| Sample | Td 10% ± 2 (°C) | Tg ± 1 (°C) | ΔT (°C) | ΔCp (mJ g−1 °C) | H2O (%) |
|---|---|---|---|---|---|
| pPEGMA | 216 | −48 | 12.7 ± 0.5 | 0.84 ± 0.1 | 0.0 |
| SN-MMT | 182 | −48 | 7.5 ± 0.2 | 1.2 ± 0.2 | 1.9 |
| BN-MMT | 299 | −37 | 9.2 ± 0.2 | 1.1 ± 0.1 | 0.2 |
| TN-MMT | 247 | −58 | 6.9 ± 0.3 | 5.7 ± 0.4 | 1.0 |
| SN-ZSM5 | 171 | −44 | 13.0 ± 0.2 | 2.4 ± 0.1 | 3.7 |
| BN-ZSM5 | 285 | −38 | 10.5 ± 2 | 0.5 ± 0.1 | 0.6 |
| TN-ZSM5 | 224 | −59 | 10.2 ± 0.3 | 0.4 ± 0.1 | 1.0 |
Temperature data at 10 wt% weight loss (Td 10%) for pristine pPEGMA and 5 wt% nanocomposites showed that all materials exhibit a tendency to decrease their thermal stability by adding the inorganic component, pPEGMA presented a Td 10% of 216 °C. This value decreases for both fillers in a similar proportion, and it can be attributed to the layers of clay that are interspersed in the nanocomposites producing an intercalated morphology.
Also, from Table 1, the glass transition temperatures (Tg) do not exhibit a significant change by adding MMT or ZSM-5 into pPEGMA. Tg of pPEGMA, SN-MMT and SN-ZSM-5 were −48, −47 and −44 °C, respectively (Table 1). Both are slight variations found within the order of the instrumental error (±1 °C), and indicate a slight stiffness of the pPEGMA matrix after filler incorporation. The anionic nanofiller surface interacts with methylene (CH2) groups of pPEGMA chains forming an interfacial layer. This interaction sluggishness polymer dynamics, and provides mechanical strength to pPEGMA matrix,19,20 as required for solid polymer electrolytes.
Fig. 4 shows TGA curves of nanocomposite samples (SN-MMT and SN-ZSM-5). A weight loss of approximately 3 wt% is observed below 100 °C. This can be ascribed to two major contributions: (1) the presence of trapped solvent used for the preparation of the nanocomposite and (2) the samples are highly hygroscopic due to their sorbent characteristics, thus, in contact with the atmosphere (i.e. sample preparation to analysis) can trap some moisture. In fact, the MMT can easily trap traces of solvent and moisture into its interlayer galleries. On the other hand, the water content into the system with zeolite ZSM-5 is lower and associated with water molecules trapped in three-dimensional zeolite channels. Water removal can be conducted by drying prior to the incorporation of the inorganic fine particles, and then drying the nanocomposite system very carefully.
Overall, thermal degradations of pure pPEGMA and nanocomposites occur through one step in the temperature range from 190 to 450 °C. On the other hand, the synthesized SN nanocomposite showed a decrease in its thermal stability with the inorganic addition. However, both systems BN and TN-nanocomposites exhibit higher thermal stability in comparison with the precursor pPEGMA, including the presence of salt and ionic liquid. This clearly indicates that the nanocomposite systems are thermally stable to higher temperatures than 200 °C, which is more than convenient for the operation of a Li-ion battery.
Thermogravimetric analysis (DSC) was conducted to get insights of the ionic conduction arising within the nanocomposites. As observed in Fig. 1Sa (ESI†), two Tg transitions related to intercalated pPEGMA are obtained when the scans are carried out with the MMT samples. This suggests that there is one interaction with a lower chain mobility (higher Tg) due to the restriction of pPEGMA within the MMT galleries; and a second one with a higher flexibility associated with the interaction between the clay and the polymer (lower Tg). For the MMT system in the presence of lithium salt (BN-MMT), this interaction becomes stronger whereby the dielectric response is suppressed and the conductivity is not appreciable. The addition of ionic liquid (TN-MMT) increases the chain flexibility since it minimizes the salt-MMT interaction, and in consequence the ionic conductivity rises. On the other hand, the TGA analysis Fig. 1Sb (ESI†) for the SN-ZSM-5 system reveals that only one Tg transition arises, indicating that there is no intercalation of the polymer within the pores of the zeolite, but a larger interaction of the polymer on the particle surface, as observed in the higher value obtained for the width of the glass transition temperature (ΔT) described in Table 1. When the lithium salt is incorporated (BN-ZSM-5), the interactions become stronger (i.e. high ΔT value) along with a mobility restriction (i.e. confinement). This indicates that the interaction among components favours a broadened glass transition that results in chain flexibility. A quantitative estimation of this relaxation strength near the kinetic glass transition could be obtained in terms of the free volume change of the system in the relevant temperature range.33 This is expressed in terms of the caloric relaxation strength (ΔCp) (Table 1) for different samples. In general, the ΔCp value is lower for all composite films in comparison with that of pPEGMA, and the minimum value (0.4 ± 0.1) is presented for TN-ZSM-5, indicating a stronger interaction and higher confinement which leads to a lower conductivity than for the clay. On the other hand, TN-MMT shows the largest (5.7 ± 0.4) change in its entropy, i.e. −Cp/T = (∂S/∂T)p, suggesting a higher mobility and conductivity. The discussion above offers sufficient arguments to account for the ionic conduction occurring within these nanocomposites and their limiting interactions. This information is used below along with the chemical (IR, X-ray) and electrochemical (EIS) characterization to propose a phenomenological description of such process.
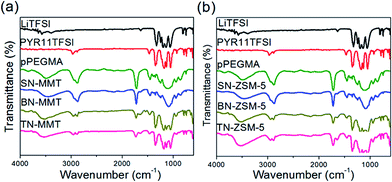
Fig. 5 shows ATR-IR spectra of precursor polymer (pPEGMA) and nanocomposites (SN-MMT and SN-ZSM-5). As observed, all spectra present similar vibrations, a wide and intense signal is observed in the range from 3650–3200 cm−1 which is related to the characteristic signals of the –OH functional groups. Signals at 2960 cm−1 and 2870 cm−1 are associated to the asymmetric and symmetric stretch of –CH2, respectively. Signals at 1725–1700 cm−1 are attributed to the asymmetric stretch of the C![[double bond, length as m-dash]](https://www.rsc.org/images/entities/char_e001.gif) O, and peaks at 1150–1070 cm−1 correspond to asymmetric stretch ether groups –C–O–C.22 The polymer–inorganic interactions were not observed, possibly because the filler is found in a very small concentration (1–5 wt%).
O, and peaks at 1150–1070 cm−1 correspond to asymmetric stretch ether groups –C–O–C.22 The polymer–inorganic interactions were not observed, possibly because the filler is found in a very small concentration (1–5 wt%).
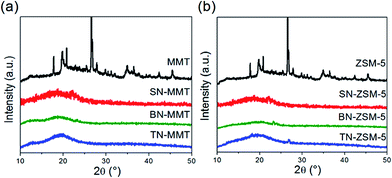
X-ray diffraction analysis for SN-MMT and SN-ZSM5 are shown in Fig. 6a and b, respectively. As observed, a characteristic broad peak of amorphous polymers is displayed in both structures, confirming a good integration of the nanofillers into the pPEGMA matrix. As previously discussed, this fact is important to maintain an amorphous phase which avoids aggregate formation (e.g. potential barriers) leading to the inhibition of ionic mobility.34
3.2 Binary (BN) and ternary (TN) nanocomposites
In addition, Fig. 6a and b show the X-ray diffraction analysis carried out for the binary systems BN-MMT and BN-ZSM-5, which do not show a characteristic diffraction of crystalline phases, whence there is neither segregation of complex phases nor a significant cluster formation of pPEGMA–LiTFSI. This analysis also evidences that the amount of salt added has been successfully dissolved into the nanocomposites, conserving good mechanical and thermal properties.Table 1 shows that the Tg for BN-MMT and BN-ZSM-5 increase to −37 and −38 °C, respectively, if compared to the Tg for pPEGMA at −48 °C. This indicates that both materials become stiff, as a result of the interactions arising between salt and nanofillers. The amount of salt affects the conformational stability and density of pPEGMA chains, while the surface of the anionic nanofiller presents a strong interaction with methylene (CH2) groups from pPEGMA and Li+. These effects change the morphology of pPEGMA into a crosslinking amorphous matrix, and consequently the chain mobility is significantly reduced.19,20 This is concordance with the XRD patterns shown in Fig. 6.
Thermogravimetric analysis of both TN-MMT and TN-ZSM-5 nanocomposites (Fig. 4a and b) indicate that inorganic filler adding increase the thermal stability until ∼100 °C. Thermograms show that the degradation rate of the nanocomposite is slower in comparison with pristine pPEGMA. TN system thermograms exhibit five stages associated to various component precursors: water sorbed, polymer, salt and ionic liquid (TN-MMT: 25–208 °C, 208–355 °C, 355–419 °C, 419–472 °C and 472.2–800 °C; TN-ZSM5: 25–220 °C, 220–346 °C, 346–422 °C, 422–459 °C and 459–800 °C). For the ternary systems TN-MMT and TN-ZSM-5, the Tg (−58 and −59 °C, respectively) decrease with incorporation of IL, suggesting a weak intermolecular interactions between nanofiller-pPEGMA chains and nanofiller-Li+. In both ternary systems, the interfacial layer separation increases, a factor associated with flexibility of the polymer chain. The coulombic attraction between cations (PYR11)+ from IL and the anionic surface sites of nanofillers may occur, decreasing the interaction nanofiller-polymer and nanofiller-Li+. This behaviour could increase the mobility of the chains and consequently the ionic conductivity, which is consistent with the enhancement of the electrical, thermal and structural properties reported with the use of IL.27 In TN-MMT, the layer separation is corroborated with the XRD pattern (Fig. 6a) indicating the formation of a partially intercalated structure between MMT and the pPEGMA chains. Thus, this arrangement could favour the migration of (PYR11)+ and Li+ inside the MMT galleries. Particularly for TN-ZSM-5, the introduction of cations from IL to the host channels is impeded since (PYR11)+ is larger compared to the diameter channel of ZSM-5, thus, only Li+ can be transferred. In general, the incorporation of IL abate the interactions between nanofiller-polymer, and nanofiller-Li+, which positively results in an enhancement of ionic conductivity.35
ATR-IR studies were conducted in binary and ternary systems with the aim of observing the interactions between substances incorporated: salt, ionic liquid and nanocomposite. Fig. 5 reveals that the addition of salt and ionic liquid shifts the –OH signal and present a strong interaction with this functional group (Table 2). The materials based on ZSM-5 showed a behaviour very similar to its analogues with clay although displacements of –OH vibrational signals and carbonyl group are slightly smaller but significant as shown in Table 3. Note that the signals from 2875 to 2888 cm−1 corresponds to methylene groups. The signal corresponding to the symmetric vibration of SO2 group (corresponding to the anion of the salt and the ionic liquid) is observed at 1327 cm−1.36 These signals are much better defined in the materials where salt is added. In the case of the signal corresponding to the ether groups appeared from 1099–1044 cm−1. This signal splits into three, thus, showing an important interaction among the salt, the ionic liquid and the nanocomposite. Of particular interest is the behaviour of this peak, which tends to shift towards lower frequencies when 5% inorganic sample is added (Fig. 5a). This chemical shift could be attributed to the fact that the electron surrounding the lithium anion has been deprived by the addition of the inorganic material. In other words, the attractive force between the lithium cation and anion is reduced by the negative charge in silicate layers of montmorillonite,37 thus, increasing the fraction of free ions that can be used for ionic conduction. A similar behaviour is displayed in the ATR-IR analysis conducted for the zeolite (Fig. 5b), which suggests that its channels also decrease the interaction of the cation and anion of the salt in a lower degree though.
| Sample | –OH (cm−1) ± 2 | –CH2 (cm−1) ± 2 | C![[double bond, length as m-dash]](https://www.rsc.org/images/entities/char_e001.gif) O (cm−1) ± 2 O (cm−1) ± 2 |
–CH2 (cm−1) twisting ± 2 | C–O (cm−1) ± 2 |
|---|---|---|---|---|---|
| pPEGMA | 3502 | 2875 | 1728 | 1254 | 1099 |
| SN-MMT | 3491 | 2879 | 1729 | 1254 | 1084 |
| BN-MMT | 3521 | 2879 | 1729 | — | 1048 |
| TN-MMT | 3541 | 2888 | 1729 | — | 1048 |
| Sample | –OH (cm−1) ± 2 | –CH2 (cm−1) ± 2 | C![[double bond, length as m-dash]](https://www.rsc.org/images/entities/char_e001.gif) O (cm−1) ± 2 O (cm−1) ± 2 |
–CH2 (cm−1) twisting ± 2 | C–O (cm−1) ± 2 |
|---|---|---|---|---|---|
| pPEGMA | 3502 | 2875 | 1728 | 1254 | 1099 |
| SN-ZSM5 | 3492 | 2879 | 1719 | 1239 | 1096 |
| BN-ZSM5 | 3463 | 2879 | 1719 | — | 1044 |
| TN-ZSM5 | 3521 | 2888 | 1719 | — | 1044 |
3.3 Ionic conduction of nanocomposites
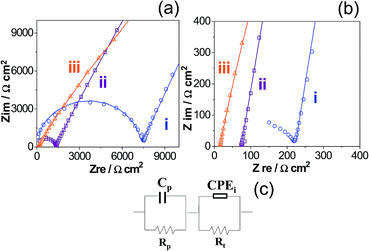
EIS measurements were conducted to determine the ionic conduction of NE at different temperatures. This analysis was preferentially performed on TN since they are expected to exhibit a higher ionic conductivity. Prior to EIS analysis, the films were extensively dried at 60 °C under vacuum. The Cole–Cole diagrams of TN-ZSM-5 and TN-MMT materials are shown in Fig. 7a and b, respectively. The impedance spectra display two time constants semicircles related to two different processes. The high-frequency semicircle can be associated with the bulk resistance and properties of nanocomposite electrolytes,38 whereas the region at low frequencies is related to migration of ions and surface heterogeneities of the electrode.39 Particularly, the time constant located at low frequencies is associated to the response of blocking electrodes.35 In order to obtain quantitative information of the polymer conductivity, the impedance spectra were analysed using the equivalent electric circuit sketched in Fig. 7c, where Rp represents the bulk resistance of the ternary system, Rt represents the resistance arising between the nanocomposite and the stainless steel electrode, the impedance of constant phase element (CPEi) is defined as ZCPEi = 1/[(jω)nQb], where: j = √−1, ω is the angular frequency, n takes into account the inhomogeneity of the system (i.e. roughness, porosity).40,41 CPEi is associated with the capacitance of the stainless steel electrode and Cp is associated with the bulk properties of the polymer. The impedance diagrams fitted to the equivalent circuit are shown as continuous line in Fig. 7a and b. The low frequency behaviour observed in these plots involves the complex ionic conduction mechanism within pPEGMA-nanoparticles, along with different interactions such as coordination shell between Li+ ions and ether oxygens (EO) from polymer chain. All these contributions occur, but it is assumed that the rate determining step is the ionic conductivity (σ) related to the migration of Li+ across the nanocomposite, which can be readily calculated by using the values of Rp obtained from the fit and the geometrical parameters of the electrochemical cell:
 | (1) |
![[thin space (1/6-em)]](https://www.rsc.org/images/entities/char_2009.gif) exp[−Ea/k(T − To)] since a plot of log
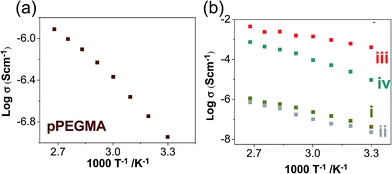
exp[−Ea/k(T − To)] since a plot of log![[thin space (1/6-em)]](https://www.rsc.org/images/entities/char_2009.gif) σ vs. 1/T is not a straight line (Fig. 8a). This behaviour indicates diffusional motion of large chain segment over the entire range of temperature. Ea is the activation energy associated with the increasing of free volume that facilitates the segmental motions of the polymer.42,43 Meanwhile, the temperature-dependent conductivities of nanocomposites SN-MMT and SN-ZSM-5 show an Arrhenius type behaviour σ = σ°e(−Ea/κT) (Fig. 8b(i) and 8b(ii)), suggesting that the chain motion decreases. The surface of the anionic nanofillers interact with methylene (CH2) groups of pPEGMA restricting the polymer dynamic.19 As observed in Table 4, the conductivity of SN-MMT and SN-ZSM-5 is one order of magnitude lower (10−8 S cm−1 at 30 °C) than pPEGMA, 10−7 S cm−1 at 30 °C, despite the slight increase of Tg for these systems compared to the single polymer (refer to Table 1). Thus, the conductivity values reflect that there are strong interactions between the nanofillers and methylene (CH2) groups of pPEGMA, that affect the reorientation and migration of polar groups (
σ vs. 1/T is not a straight line (Fig. 8a). This behaviour indicates diffusional motion of large chain segment over the entire range of temperature. Ea is the activation energy associated with the increasing of free volume that facilitates the segmental motions of the polymer.42,43 Meanwhile, the temperature-dependent conductivities of nanocomposites SN-MMT and SN-ZSM-5 show an Arrhenius type behaviour σ = σ°e(−Ea/κT) (Fig. 8b(i) and 8b(ii)), suggesting that the chain motion decreases. The surface of the anionic nanofillers interact with methylene (CH2) groups of pPEGMA restricting the polymer dynamic.19 As observed in Table 4, the conductivity of SN-MMT and SN-ZSM-5 is one order of magnitude lower (10−8 S cm−1 at 30 °C) than pPEGMA, 10−7 S cm−1 at 30 °C, despite the slight increase of Tg for these systems compared to the single polymer (refer to Table 1). Thus, the conductivity values reflect that there are strong interactions between the nanofillers and methylene (CH2) groups of pPEGMA, that affect the reorientation and migration of polar groups (![[double bond, length as m-dash]](https://www.rsc.org/images/entities/char_e001.gif) O), (–O–), (–OH) from pPEGMA chains to the polarized electrodes. This is what stems the ionic conduction for SN systems.
O), (–O–), (–OH) from pPEGMA chains to the polarized electrodes. This is what stems the ionic conduction for SN systems.
| Sample | σ (S cm−1) 30 °C | σ (S cm−1) 60 °C | Ea (eV) | R2 |
|---|---|---|---|---|
| pPEGMA | 1.1 × 10⁻⁷ | 4.3 × 10⁻⁷ | 0.074 | — |
| SN-MMT | 4.2 × 10⁻⁸ | 2.3 × 10⁻⁷ | 0.460 | 0.99 |
| TN-MMT | 4.0 × 10⁻⁴ | 1.4 × 10⁻³ | 0.485 | 0.99 |
| SN-ZSM5 | 2.3 × 10⁻⁸ | 1.0 × 10⁻⁷ | 0.378 | 0.99 |
| TN-ZSM5 | 9.4 × 10⁻⁶ | 9.2 × 10⁻⁵ | 0.610 | 0.99 |
In binary systems, the presence of high salt concentrations affects the conformational stability and density of pPEGMA chains, while the surface of the anionic nanofiller presents strong interactions with methylene (CH2) groups of pPEGMA and Li+ ion. All these effects influence the mobility of polymer chains and Li+ ion. The surface of the anionic nanofillers enables the introduction of Li+ into MMT galleries or ZSM-5 channels. However, the interactions nanofiller-Li+ are strong enough to hinder Li+ ion motion. Furthermore, the morphology of pPEGMA changes to a crosslinking amorphous matrix, whence the mobility of the pPEGMA chains significantly decreases.19,20 This behaviour indicates that plasticizing properties are lost, whereby there is no adherence between8 the blocking electrodes and binary samples. Thus, BN-MMT and BN-ZSM-5 systems present large impedances (not shown), hindering the determination of their ionic conductivities.
Ternary systems, TN-MMT and TN-ZSM-5 also show an Arrhenius type behavior (Fig. 8b(iii) and b(iv)). The activation energy for TN-MMT is lower (0.378 eV) than nanocomposites (SN-MMT and SN-ZSM-5) and TN-ZSM-5 (Table 4). The ionic conductivity for TN-MMT rises to 10−4 S cm−1 at 30 °C and 10−3 S cm−1 at 60 °C. According to the physicochemical and electrochemical characterizations, this study proposes that IL (PYR11TFSI) improves the contact arising in the nanofiller-pPEGMA interface, associated with the relaxation of the polymer chain (refer to the sketch presented in Fig. 9). For the nanofiller-Li+ interface, coulombic attraction between cations (PYR11)+ from IL and the surface anionic sites of nanofillers may occur, decreasing the aforementioned interaction. In MMT, cations (PYR11)+ from IL can introduce inside galleries due to their flexibility. (PYR11)+ are preferentially attracted to the anionic surface, decreasing the interaction MMT–Li+.19 This behaviour allows exchanging the Li+ ions by (PYR11)+ pinned to the anionic MMT surface (Fig. 9). For TN-ZSM-5, its low conductivity could be due Li+ ions remain fixed inside ZSM-5. The introduction of (PYR11)+ to the host channels is impeded since (PYR11)+ is larger compared to the diameter channel of ZSM-5 (≈0.56 nm).16 Thus, only Li+ ions outside ZSM-5 can be efficiently transferred (Fig. 9). Note that only free Li+ ions can be transported across ternary nanocomposites by hopping motion through the formation of a weak coordination shell formed between ether oxygen and carbonyl oxygen from pPEGMA chain. The migration of Li+ from one site to the neighbouring site is facilitated by the presence of holes.39 In this direction, anisotropic conductivity is exhibited for all NE (Fig. 8b(i)–(iv)), as demonstrated in anisotropic structures including 2D nanoplates and 3D channels.20
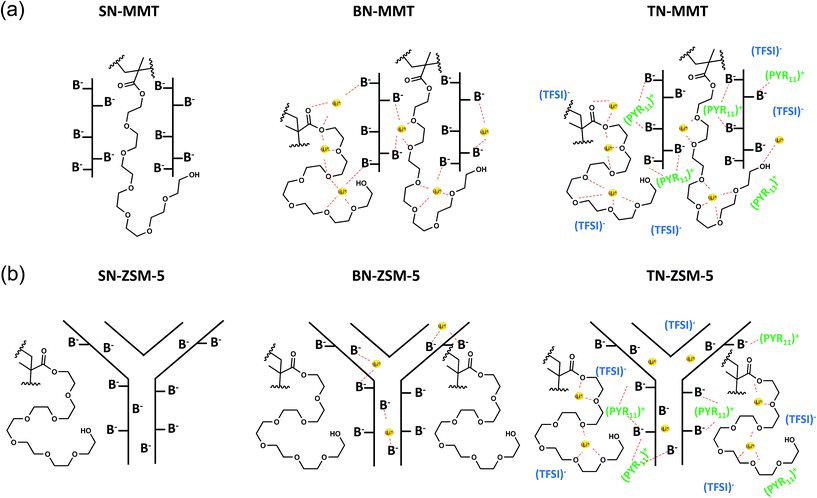 | ||
| Fig. 9 Schematic representation of pPEGMA, LiTFSI and PYR11TFSI across: (a) MMT galleries and (b) ZSM-channels. | ||
The experimental evidences and discussion presented above account for the lower energy barriers determined for TN-MMT, indicating a more facile ion transport compared to other NE. However, it is important to stand out the effect of ionic liquid in order to abate the interactions between nanofiller-pPEGMA and nanofiller-Li+ ion in TN, unlike what adversely occurs in BN. Thus, this feature enables to increase Li+ ion conductivity to considerably levels for hybrid materials at room temperature, and there are positive signals to project that will also improve the interface of TN with active material for a better performance in Li-ion batteries.
4 Conclusions
Novel polymer nanocomposite electrolytes were synthesized based on two different inorganic structures: clay montmorillonite (MMT) or zeolite (ZSM-5) at 1, 3 and 5 wt%, and using pPEGMA as novel polymer matrix. These materials were subsequently formulated with a lithium salt (LiTFSI) and an ionic liquid (PYR11TFSI). Sonication technique was successfully used to introduce the fillers into the polymer matrix, provided uniform dispersion and shattered aggregates of nanofillers to ensure a polymer amorphous structure. Particularly for MMT, materials with a better intercalated structure (inorganic nanofiller-pPEGMA) were obtained when sonication time was decreased to 3 h, and magnetic stirring was removed. SEM and TEM techniques revealed an efficient embedding of the fillers into the pPEGMA, whereas analyses conducted with TGA/DSC, FTIR and XRD showed that the thermal and morphological properties of the nanocomposites do not present significant variations when MMT and ZSM-5 were introduced into the polymer matrix.On the other hand, although there was not neither segregation of complex phases nor a significant cluster formation of pPEGMA–LiTFSI when the lithium salt was added to form the binary systems BN-MMT and BN-ZSM-5, both materials became relatively stiff, as a result of strong interaction between the surface of the anionic nanofiller with methylene (CH2) groups from pPEGMA, and particularly anionic nanofiller with Li+. These effects changed the morphology of pPEGMA into a crosslinking amorphous matrix (i.e. restriction of chain mobility), and the Li+ ion motion was hindered. As a result, plasticizing properties were lost and there was no adherence between the blocking electrodes and binary samples, which restricted the determination of the ionic conductivities for the BN-MMT and BN-ZSM-5 systems due to large impedances.
For the ternary systems TN-MMT and TN-ZSM-5, the Tg (−58 and −59 °C, respectively) considerably decrease with incorporation of IL (PYR11TFSI), suggesting weak intermolecular interactions between nanofiller-pPEGMA chains and nanofiller-Li+. XRD confirmed an increase of the interfacial layer separation for TN-MMT, which granted flexibility to the polymer chains. This behaviour stemmed significantly enhancements in the ionic conductivities of TN-MMT (4.0 × 10⁻⁴ S cm−1) and TN-ZSM-5 (9.4 × 10⁻⁶ S cm−1) at 30 °C. Additionally, these hybrid materials are able to dissociate a high salt concentration. In both ternary systems, the effect of ionic liquid was to abate the interactions arising between nanofiller-pPEGMA and nanofiller-Li+ ion, unlike what adversely occurred in BN. Thus, the nanofiller-Li+ interaction decreased as a result of the coulombic attraction generated between IL cations (PYR11)+ and the surface anionic sites of these nanofillers. The lower conductivity obtained for TN-ZSM-5 compared to TN-MMT was accounted for by considering that the introduction of (PYR11)+ to the host channels was impeded since (PYR11)+ is larger compared to the diameter channel of ZSM-5 (≈0.56 nm), whereby only Li+ ions outside ZSM-5 were efficiently transferred. Anisotropic conductivity was exhibited for these NE occurring by hopping motion through the formation of a weak coordination shell formed between ether oxygen and carbonyl oxygen from pPEGMA chain. The Li+ transport from one site to the neighbouring site was facilitated by the presence of holes.
The functionalized MMT and ZSM-5 nanocomposites exhibited adequate morphological, thermal and mechanical properties, and a significant enhancement of Li+ ion conductivity for green materials at room temperature to be considered as potential NE for Li-ion batteries. There is also sufficient evidence to consider that ternary materials will improve their interface with active materials for a better performance in Li-ion batteries, which will be the motivation of a forthcoming study.
Acknowledgements
Financial support is greatly appreciated from CONACYT (Grants No. 2010-155698, 2012-183230, 2013-205416 and 2014-237343). I. Romero-Ibarra also acknowledges the Cátedras-CONACYT program via project No. 1456 “Diseño y construcción de sistemas sustentables de generación y almacenamiento de energía”. Authors thank R. Rosas, J. E. Romero and P. Castillo for technical help.Notes and references
- B. Scrosati and J. Garche, J. Power Sources, 2010, 195, 2419–2430 CrossRef CAS.
- Advances in Lithium-Ion Batteries, ed. W. van Schalkwijk and B. Scrosati, Kluwer Academic/Plenum Publishers, 2002 Search PubMed.
- R. Koksbang, I. I. Olsen and D. Shackle, Solid State Ionics, 1994, 69, 320–335 CrossRef CAS.
- F. Yi, X. Yang, Y. Li and S. Fang, Polym. Adv. Technol., 1999, 10, 473–475 CrossRef CAS.
- C. Yang, H. Wei, L. Guan, J. Guo, Y. Wang, X. Yan, X. Zhang, S. Wei and Z. Guo, J. Mater. Chem. A, 2015, 3, 14929–14941 CAS.
- V. Di Noto, S. Lavina, G. A. Giffin, E. Negro and B. Scrosati, Electrochim. Acta, 2011, 57, 4–13 CrossRef CAS.
- Z. Xue, D. Heb and X. Xie, J. Mater. Chem. A, 2015, 3, 19218–19253 CAS.
- A. Mejía, N. García, J. Guzmán and P. Tiemplo, Eur. Polym. J., 2013, 49, 118–129 CrossRef.
- Z. Shen, G. P. Simon and Y.-B. Cheng, Eur. Polym. J., 2003, 39, 1917–1924 CrossRef CAS.
- D. J. A. Cameron, R. Bissessur and D. C. Dahn, Eur. Polym. J., 2012, 48, 1525–1537 CrossRef CAS.
- D. Devaux, R. Bouchet, D. Glé and R. Denoyel, Solid State Ionics, 2012, 227, 119–127 CrossRef CAS.
- P. G. Bruce, S. A. Campbell, P. Lightfoot and M. A. Mehta, Solid State Ionics, 1995, 78, 191–198 CrossRef CAS.
- R. Dupon, B. L. Papke, M. A. Ratner, D. H. Whitmore and D. F. Shriver, J. Am. Chem. Soc., 1982, 104, 6247–6251 CrossRef CAS.
- T. Niitani, M. Shimada, K. Kawamura, K. Dokko, Y.-H. Rho and K. Kanamura, Electrochem. Solid-State Lett., 2005, 8, A385–A388 CrossRef CAS.
- S.-K. Kim, D.-G. Kim, A. Lee, H.-S. Sohn, J. J. Wie, N. A. Nguyen, M. E. Mackay and J.-C. Lee, Macromolecules, 2012, 45, 9347–9356 CrossRef CAS.
- J. R. M. Giles, F. M. Gray, J. R. MacCallum and C. A. Vincent, Polymer, 1987, 28, 1977–1981 CrossRef CAS.
- I. M. Khan, D. Fish, Y. Delaviz and J. Smid, Die Makromolekulare Chemie, 1989, 190, 1069–1078 CrossRef CAS.
- A. C. Lopes, P. Martins and S. Lanceros-Mendez, Prog. Surf. Sci., 2014, 89, 239–277 CrossRef CAS.
- S. Mogurampelly and V. Ganesan, Macromolecules, 2015, 48, 2773–2786 CrossRef CAS.
- S. Cheng, D. M. Smith, Q. Pan, S. Wang and Y. Christopher, RSC Adv., 2015, 5, 48793–48810 RSC.
- Y. Nímah, M. Cheng, J. Cheng and J. Rick, J. Power Sources, 2015, 278, 375–381 CrossRef.
- C. Oriankhi, J. Chem. Educ., 2000, 77, 1138–1146 CrossRef.
- B. M. Weckhuysen and J. Yu, Chem. Soc. Rev., 2015, 44, 7022–7024 RSC.
- Z. Yuan and F. Liang, Curr. Org. Chem., 2014, 18, 2016–2036 CrossRef CAS.
- Z. Wang, J. Yu and R. Xu, Chem. Soc. Rev., 2012, 41, 1729–1741 RSC.
- M. H. Khanmirzaei and S. Ramesh, Measurement, 2014, 58, 68–72 CrossRef.
- Shalu, V. K. Singh and R. K. Singh, J. Mater. Chem. C, 2015, 3, 7305–7318 RSC.
- H. Fisher, Mater. Sci. Eng., C, 2003, 23, 763–772 CrossRef.
- B. Huber, L. Rossrukcer, J. Sundermeyer and B. Roling, Solid State Ionics, 2013, 247–248, 15–21 CrossRef CAS.
- J. Cardoso, O. Soria-Arteche, G. Vázquez, O. Solorza and I. González, J. Phys. Chem. C, 2010, 114, 14261–14268 CAS.
- R. J. Sengwa, S. Choudhary and P. Dhatarwal, Ionics, 2015, 21, 95–109 CrossRef CAS.
- J. Xi, X. Qiu and L. Chen, Solid State Ionics, 2006, 177, 709–713 CrossRef CAS.
- J. Bujdak, E. Hackett and E. P. Giannelis, Chem. Mater., 2000, 12, 2168–2174 CrossRef CAS.
- C. H. Manoratne, R. M. G. Rajapasque and M. A. K. L. I. Dissanayaque, Int. J. Electrochem. Sci., 2006, 1, 32–46 CAS.
- R. Prasanth, N. Shubha, H. H. Hng and M. Srinivasan, Eur. Polym. J., 2013, 49, 307–318 CrossRef CAS.
- M. Echeverri, N. Kim and T. Kyu, Macromolecules, 2012, 45, 6068–6077 CrossRef CAS.
- H.-W. Chen and F.-C. Chang, Polymer, 2001, 42, 9763–9769 CrossRef CAS.
- H. Xie and Y. Liu, J. Appl. Polym. Sci., 2001, 80, 903–912 CrossRef CAS.
- M. E. Jacob, E. Hackett and P. Giannelis, J. Mater. Chem., 2003, 13, 1–5 RSC.
- M. F. García Sánchez, J. C. ḾPeko, A. R. Ruiz Salvador, F. Fernández Gutierrez, G. Rodríguez Gattorno, A. Delgado and Y. E. Inastrilla, J. Chem. Educ., 2003, 80, 1062–1074 CrossRef.
- M.-F. García-Sánchez, N. Fernández, M.-L. Martínez-Sarrión, L. Mestres, G. Santana and A. R. Ruiz-Salvador, Mater. Sci. Eng., B, 2012, 177, 563–569 CrossRef.
- T. Miyamoto and K. Shibayama, J. Appl. Phys., 1973, 44, 5372–5376 CrossRef CAS.
- M. Ratner and A. Nitzan, Faraday Discuss. Chem. Soc., 1989, 88, 19–42 RSC.
Footnote |
| † Electronic supplementary information (ESI) available. See DOI: 10.1039/c5ra20620k |
| This journal is © The Royal Society of Chemistry 2016 |

