Novel nanoporous carbon derived from metal–organic frameworks with tunable electromagnetic wave absorption capabilities†
Xiaohui
Liang
a,
Bin
Quan
a,
Guangbin
Ji
*a,
Wei
Liu
a,
Yan
Cheng
a,
Baoshan
Zhang
b and
Youwei
Du
c
aCollege of Materials Science and Technology, Nanjing University of Aeronautics and Astronautics, Nanjing, 210016, P. R. China. E-mail: gbji@nuaa.edu.cn; Fax: +86-25-52112900; Tel: +86-25-52112902
bSchool of Electronic Science and Engineering, Nanjing University, Nanjing 210093, P. R. China
cLaboratory of Solid State Microstructures, Nanjing University, Nanjing 210093, P. R. China
First published on 30th September 2016
Abstract
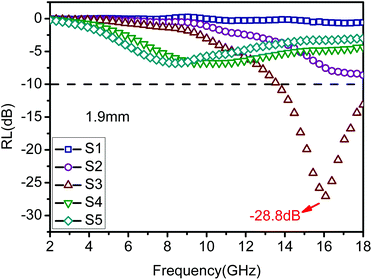
Nanoporous carbon materials derived from metal organic frameworks (MOFs) have attracted considerable attention due to their low density for microwave absorption. Nevertheless, their poor impedance matching has reduced the absorber performance. The design and fabrication of complex nanocarbon materials with outstanding impedance matching is still a challenge. Here, we prepared a core–shell structured ZIF-8@ZIF-67 crystal through a new seed-mediated growth method. After the thermal treatment of ZIF-8@ZIF-67 crystals, we obtained selectively nanoporous carbon materials consisting of ZnO/NPC as the cores and highly graphitic Co/NPC as the shells. The shell thicknesses of ZIF-67 can be tuned simply by varying the feeding molar ratios of Co2+/Zn2+. The composites exhibited excellent impedance matching and strong absorption. The composite ZnO/NPC@Co/NPC-0.5 samples filling with 50 wt% of paraffin show a maximum reflection loss (RL) of −28.8 dB at a thickness of 1.9 mm. In addition, a broad absorption bandwidth for RL <−10 dB which covers from 13.8–18 GHz can be obtained. Our study not only bridges diverse carbon-based materials with infinite metal–organic frameworks but also opens a new avenue for artificially designed nano-architectures with target functionalities.
Introduction
With the swift development of electromagnetic wave technology, electromagnetic interference (EMI) has become a serious problem in daily life, which may not only interrupt electronic devices, but also threaten human health. In order to solve these problems, microwave absorbing materials are indispensable. In general, the basic design principles for absorbing materials are electromagnetic wave attenuation capability and impedance matching. Clearly, weak attenuation would result in unsatisfactory behavior. In addition, poor impedance matching characteristics also lead to low reflection loss due to increased reflections on the surface. Moreover, an efficient absorbing material should not only satisfy the basic requirements of strong absorption but also the needs of practical applications, such as thin coating thickness and lightweight. In the past decade, extensive studies have been performed to develop lightweight absorbing materials including hollow structures,1 core–shell structures2 and magnetic/carbon composites.3 Among these structures, a kind of effective absorbing material, carbon-based composites, has drawn great attention due to their lower density, low cost and high electrical conductivity.4 Most studies have concentrated on graphene,5–9 carbon nanotubes10–13 and mesoporous carbon.14–16 Although carbon based absorbing materials in recent years have achieved good development, their microwave absorbing properties also need to be further improved. In addition, carbon material is a kind of dielectric material with relatively high complex permittivity and poor magnetic permeability, which cause the mismatch of impedance and limit its use as a microwave absorbing material. Therefore, a simple yet effective method to obtain carbon-based composites with outstanding microwave absorbing performance is urgently needed.Metal organic frameworks (MOFs)17–20 are a class of ultraporous materials fabricated by assembling metal ions with organic ligands in appropriate solvents, which have attracted considerable attention because of their exceptionally high accessible surface area, diverse structural topologies as well as tunable functionalities.21 Moreover, the potential applications of MOFs can be further improved and extended by incorporating other functional species within the MOFs. Most importantly, by taking advantage of their thermal behaviour and chemical reactivity, various porous carbons and metal oxides can be achieved easily through the direct pyrolysis of MOFs.22,23 For instance, microporous carbon polyhedra were produced through the calcination of Zn-based MOFs (ZIF-8) under an inert atmosphere.24 There also exist some core–shell structures of ZIF-8 such as ZIF-L@ZIF-8,25 ZIF-8@PDMS,26 metal/ZIF-8 crystals27 and ZIF-67@ZIF-8.28 In addition, Yamauchi et al.29 displayed that nanoporous carbon with magnetic Co nanoparticles (Co/NPC) can be prepared by thermal decomposition of a Co-based zeolitic imidazolate framework material (ZIF-67). The Co nanoparticles can be well protected by the carbon layer, which is attributed to the uniformity of the Co nanoparticles over the whole nanoporous carbon matrix. Moreover, our previous report also suggests that this kind of porous carbon material is a promising candidate for a lightweight microwave absorber due to its higher EM wave attenuation and lower density.30 Unfortunately, in the gigahertz (GHz) band range, nanoporous carbons with magnetic Co nanoparticles (Co@NPC) derived from the thermal decomposition of ZIF-67 do not show good EM absorbing properties due to their relatively high complex permittivity compared with that of air, which leads to impedance mismatching between the materials and air. To overcome these issues, heterogeneous hybridization is an effective methodology to fuse the advantages of different materials and endows the hybrid materials with novel chemical and physical properties and interfacial functionality.31,32 However, ZnO-containing nanomaterials can be used as high efficiency microwave-absorbing materials due to their complex permittivity and permeability.33–35 Thus, our target in this study is to realize core–shell ZnO/NPC@Co/NPC derived from core–shell MOFs, which can bring out novel chemical and physical properties that are not attainable from a single MOF precursor.
A zeolitic imidazolate framework (ZIF) is a well-known subfamily of MOFs formed through the coordination interaction between the metal ions and the imidazole derivatives.36 So we set out to prepare core–shell ZIF-8@ZIF-67 crystals, which consist of ZIF-8 crystals as the core and ZIF-67 crystals as the shell, through a seed-mediated growth method that is usually adopted to prepare core–shell structured materials.37 By the thermal treatment of ZIF-8@ZIF-67 crystals, novel nanoporous ZnO/NPC@Co/NPC materials consisting of ZnO/NPC as the core and highly graphitic carbon Co/NPC as the shell are successfully prepared (Fig. 1). The permittivity and permeability of the ZnO/NPC@Co/NPC and the shell thickness of Co/NPC significantly depend on the molar ratios of Co2+/Zn2+. The as-prepared ZnO/NPC@Co/NPC-0.5 showed outstanding microwave absorption properties. A maximum reflection loss (−28.8 dB) at 1.9 mm can be achieved. In addition, the approach is quite simple and useful for large-scale preparation.
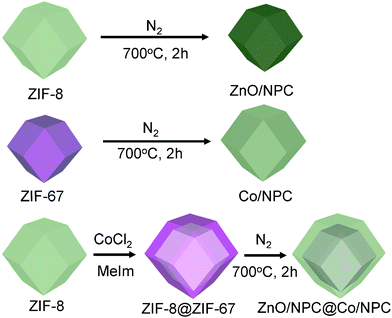 | ||
| Fig. 1 Synthesis scheme of ZIF-8 crystals and ZnO/NPC; ZIF-67 crystals and Co/NPC; core–shell ZIF-8@ZIF-67 crystals and ZnO/NPC@Co/NPC. MeIm represents 2-methylimidazole. | ||
Experimental section
Synthesis of ZIF-8 and ZIF-67 crystals
In a typical synthesis of ZIF-8, methanolic solutions of zinc nitrate hexahydrate (810 mg, 40 mL) and methanolic solutions of MeIm (526 mg, 40 mL) were mixed under stirring. Then the mixture was transferred into an autoclave and was kept for 12 h at 100 °C. A white powder was collected by centrifugation, washed several times with methanol, and dried at 60 °C. In the synthesis of ZIF-67, methanolic solutions (80 mL) of cobalt chloride (519 mg), polyvinylpyrrolidone K30 (PVP K30) (600 mg) and MeIm (2630 mg) were mixed under stirring. Then the mixture was kept at room temperature for 24 h. A bright purple powder of ZIF-67 was collected by centrifugation, washed several times with methanol, and dried at 60 °C.Synthesis of core–shell ZIF-8@ZIF-67 crystals and ZnO/NPC@Co/NPC
In a typical synthesis of core–shell ZIF-8@ZIF-67 crystals, ZIF-8 seeds (80 mg) were firstly well-dispersed in methanol (10 mL) under sonication for 30 min. Then a methanolic solution of cobalt chloride (177 mg, 3 mL) and after stirring for 20 min, a methanolic solution of MeIm (895 mg, 3 mL) were stepwise injected into the above mixture. After stirring for another 5 min, the mixture was transferred into an autoclave and kept at 100 °C for 12 h. During this time, the core–shell ZIF-8@ZIF-67 crystals were obtained. After cooling to room temperature, the sample was collected by centrifugation, washed several times with methanol, and dried at 80 °C. The molar ratio of Co2+/Zn2+ in the obtained ZIF-8@ZIF-67 crystals was 0.5. The shell thickness of ZIF-67 can be tuned by changing the amounts of methanolic solutions of cobalt and MeIm. The obtained core–shell ZIF-8@ZIF-67 crystals are denoted as ZIF-8@ZIF-67-x, where x indicates the molar ratio of Co2+/Zn2+ in the products. All the precursors were thermally converted to ZnO/NPC@Co/NPC materials through carbonization under a N2 flow at 700 °C for 2 h, with a heating rate of 2 °C min−1. In addition, the number of the core–shell ZnO/NPC@Co/NPC-x is listed in Table 1. As a control experiment, ZnO/NPC and Co/NPC were prepared by using single precursors (ZIF-8 and ZIF-67) under the same thermal conditions, which were denoted as S1 and S5, respectively.| Sample | Thermal conditions | Number | Molar ratio of Co2+/Zn2+ | Thickness of samples (mm) |
|---|---|---|---|---|
| Co/NPC | N2, 700 °C, 2 h | S1 | — | — |
| ZnO/NPC@Co/NPC-0.25 | N2, 700 °C, 2 h | S2 | 0.25 | 71 |
| ZnO/NPC@Co/NPC-0.5 | N2, 700 °C, 2 h | S3 | 0.5 | 99 |
| ZnO/NPC@Co/NPC-0.75 | N2, 700 °C, 2 h | S4 | 0.75 | 120 |
| ZnO/NPC | N2, 700 °C, 2 h | S5 | — | — |
Sample preparation for microwave absorption performance
The relative complex permittivity (εr) and permeability (μr) were measured by using a vector network analyzer (VNA, N5242A PNA-X, Agilent) in the frequency range 2–18 GHz. The measured samples were prepared by uniformly mixing 50 wt% of a powder hybrid with a wax matrix at 90 °C. The mixture was then pressed into ring shaped samples with an outer diameter of 7.00 mm and an inner diameter of 3.04 mm. In a coaxial wire analysis, εr of the dielectric material has been calculated from the experimental scattering parameters S11 (or S22) and S21 (or S12) using the standard Nicolson–Ross–Weir (NRW) algorithm.30Characterization of the samples
Powder X-ray diffraction (XRD) patterns were recorded using a Bruker D8 X-ray diffractometer with Ni filtered Cu Kα radiation (40 kV, 40 mA). The morphologies and sizes of the samples were characterized by using a field-emission scanning electron microscope (FESEM Hitachi-4800) and a transmission electron microscope (JEOL JSM-2010). The Brunauer–Emmett–Teller (BET) specific surface areas of the samples were determined using a high speed automated area and pore size analyzer (ASAP 2010). A vibrating sample magnetometer (VSM, Lakeshore, Model 7400 series) was used to measure the samples’ magnetic properties under an applied magnetic field of 10 kOe.Results and discussion
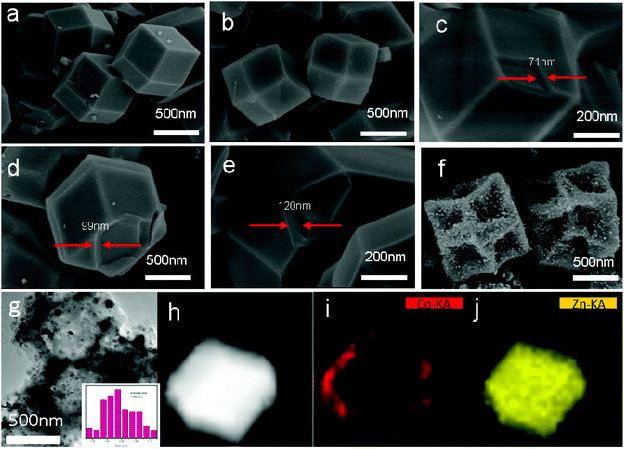
The core–shell MOFs (ZIF-8@ZIF-67-x) were prepared by a seed-mediated growth technique, as illustrated in Fig. 2c–e. ZIF-8 and ZIF-67 are possible candidates for the preparation of core–shell MOFs (ZIF-8@ZIF-67-x) due to their isoreticular structures as [M(MeIm)2]n (M = Zn for ZIF-8 and Co for ZIF-67) and their similar unit cell parameters between ZIF-8 (a = b = c = 16.9910 Å)38 and ZIF-67 (a = b = c = 16.9589 Å),36 which were determined by single crystal X-ray diffraction studies. To achieve this goal, uniformly sized ZIF-8 seeds and ZIF-67 seeds were first synthesized by the coordination reaction of Zn2+ ions and Co2+ with MeIm. SEM images confirmed that the obtained ZIF-8 and ZIF-67 consisted of uniformly dispersed crystals of rhombic dodecahedral shape, and the diameters of ZIF-8 and ZIF-67 were about 1 μm (Fig. 2a and b).For the preparation of core–shell ZIF-8@ZIF-67 crystals, here the ZIF-8 seeds were sonicated to gain the dispersed crystals. The good dispersity is quite important for uniform coating with the ZIF-67 shell. After adding a methanolic solution of CoCl2, the Co2+ ions were immobilized on the surface of ZIF-8 seeds through the coordinative interaction with MeIm units exposed on the surface, followed by the growth of the ZIF-67 shell via the interaction with additive MeIm linkers. The obtained core–shell MOF crystals by using ZIF-8 seeds were abbreviated as ZIF-8@ZIF-67-x (x = 0.25, 0.5 and 0.75, respectively).
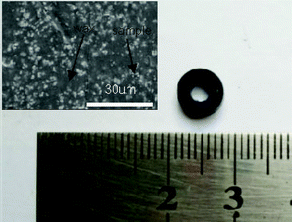
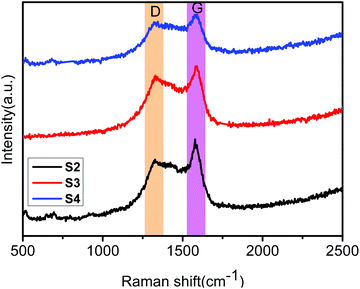
The obtained core–shell ZIF-8@ZIF-67 crystals were carefully characterized. Fig. 2h and i show the TEM image and elemental mappings for the sample consisting of ZIF-8 cores and ZIF-67 shells. The shell thickness of ZIF-8@ZIF-67 crystals was easily controlled by changing the feeding ratios of Co2+/Zn2+ (Fig. 2c–e). The core–shell ZIF-8@ZIF-67-x crystals show a well-defined rhombic dodecahedral morphology, which corresponds to the original morphology of the ZIF-8 seeds (Fig. 2a). As shown in Fig. 2c–e, when the edge part with cracks was observed, it was found that the ZIF-67 shell uniformly coated the ZIF-8 core with a thickness of 71 nm, 99 nm and 120 nm, respectively (Table 1). Fig. 2g and its inset show the size of S3 (around 1.055 μm). The digital photo of S3 is presented in Fig. 3 (the inset is its corresponding SEM images). It is clearly seen that the particle of S3 remains uniform in wax. The wide-angle PXRD patterns of ZIF-8, ZIF-67 and core–shell ZIF-8@ZIF-67-x crystals provided a better understanding of the core–shell crystals (Fig. 4a). The positions of the diffraction peaks of our prepared ZIF-8 and ZIF-67 crystals corresponded to the PXRD patterns simulated from the single crystal structures of ZIF-835 and ZIF-67.36 In addition, the wide-angle XRD patterns for S2, S3 and S4 (Fig. 4b) exhibited diffraction peaks at 41.2°, 44.2° and 47.5° that are identical to the diffraction of carbon, Co and ZnO. The signals of graphite can hardly be detected from the powder pattern, due to the weak scattering power and low crystallinity of graphite.39 Nevertheless, graphite in the hybrid can be readily identified by Raman spectroscopy (Fig. 5). Two strong peaks appearing at 1346 and 1587 cm−1, respectively, are the characteristic Raman signals of graphite.30 From Fig. 2f and g, one can see that the obtained S3 retained the original rhombic dodecahedral shape of the core–shell ZIF-8@ZIF-67 crystals with a slight shrinkage and distortion.
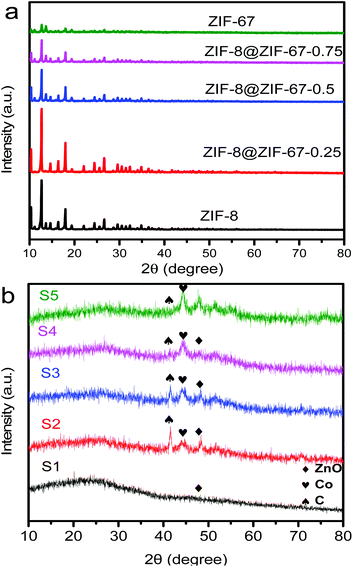 | ||
| Fig. 4 (a) Wide-angle PXRD patterns of the as-synthesized ZIF-8, ZIF-8@ZIF-67-0.25, ZIF-8@ZIF-67-0.5, ZIF-8@ZIF-67-0.75 and ZIF-67 crystals.(b) XRD patterns of S1, S2, S3, S4 and S5 samples. | ||
As revealed by SEM images (Fig. S1a†), the obtained ZnO/NPC particles retained the original rhombic dodecahedral shape from the parent ZIF-8 and exhibited a smooth surface without any large pores or cracks. In contrast, the Co/NPC particles prepared from ZIF-67 shrank significantly and showed a distorted, bumpy surface (Fig. S1d†). A similar situation was observed with ZnO/NPC@Co/NPC particles prepared from ZIF-8@ZIF-67 crystals (Fig. S1b and d†). With the increase of ZIF-67 shell thickness, the ZnO/NPC@Co/NPC particles that carbonized from ZIF-8@ZIF-67 displayed a more seriously distorted surface.
The graphitic degree of the samples was investigated in more detail by Raman spectroscopy. As shown in Fig. 5 and S2,† all samples present two strong peaks at 1346 cm−1 and 1587 cm−1, which can be assigned to the typical D and G bands of the carbon materials, respectively. This result indicates the existence of carbon in the samples. The D band is usually related to lattice disorder in sp2-hybridized C atoms or amorphous C deposits, whereas the G band is ascribed to the highly oriented sp2 hexagonal graphitic lattice.40 For the ZnO/NPC sample (Fig. S2a†), the intensity of the G band was uniform with the D band, indicating that the carbon in ZnO/NPC has a low degree of graphitization in the atomic carbon structure. In contrast, for other samples, the intensity of the D band was lower than that of the G band, revealing that the carbon has a higher degree of graphitization in the atomic carbon structure. The obvious enhancement of the G band indicates a higher degree of graphitization compared to the carbon structure as a result of metal Co catalysis for carbon at a high calcination temperature and long calcination time.30
The nitrogen adsorption isotherms obtained by means of DFT41 are shown in Fig. 6. The specific surface areas and total pore volumes were analyzed and are summarized in Table 2. The values of all the samples are extremely low in comparison to the original ZIF-67 crystals (1738 m2 g−1) due to the collapse of the well-defined microporous structure of ZIF-67 caused by the graphitization of amorphous carbon.25,42 The S2 and S3 with a thin Co/NPC thickness showed a high surface area (30.40 m2 g−1 and 168.23 m2 g−1), which also indirectly proves a successful tuning of the Co/NPC shell thickness. The micropore-size distribution curves of all the ZnO/NPC@Co/NPC-x samples show a great deal of disordered nanopores and a pore size distribution from 1 to 10 nm, which may be attributed to the collapse of the well-defined microporous structure of ZIF-67. Nevertheless, ZnO/NPC@Co/NPC-x still possesses a high surface area and total pore volume, which provide more active sites for reflection and scattering of electromagnetic waves, promoting the electromagnetic wave repeated absorption process more efficiently.
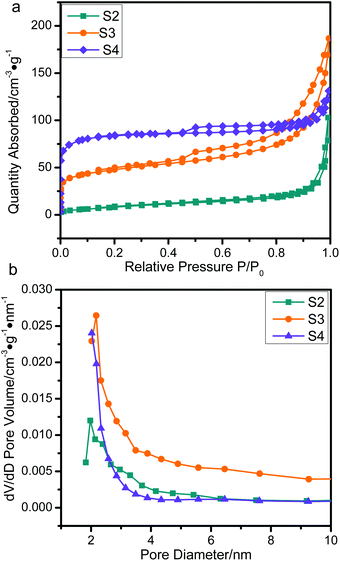 | ||
| Fig. 6 (a) N2 adsorption–desorption isotherms and (b) pore size distribution plots of S2, S3 and S4. | ||
| Sample | S BET (m2 g−1) | S Langmuir (m2 g−1) | V pore (cm3 g−1) | M s (emu g−1) |
|---|---|---|---|---|
| S2 | 30.40 | 42.30 | 0.1591 | 7 |
| S3 | 168.23 | 214.76 | 0.2887 | 38 |
| S4 | 318.80 | 358.40 | 0.2028 | 55 |
The magnetic hysteresis of ZnO/NPC@Co/NPC-x was carried out at room temperature using a vibrating sample magnetometer (Fig. 7), and the related saturation magnetization (Ms) values are listed in Table 2. It can also be found that the Ms of ZnO/NPC@Co/NPC-x increases from 7 to 55 emu g−1, which is attributed to the decreased carbon content26 and the increased Co concentration in the Co/NPC shells. ZnO/NPC@Co/NPC-0.75 has the largest saturation magnetization which may induce a high permeability. As shown in Fig. S3,† the ZnO/NPC@Co/NPC-0.75 has a higher real part of permeability.
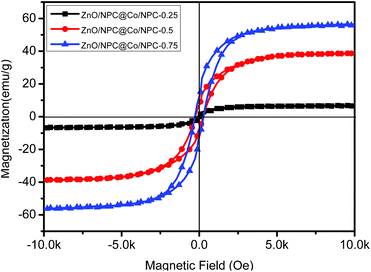 | ||
| Fig. 7 Field-dependent magnetization curve of ZnO/NPC@Co/NPC-x (x = 0.25, 0.5 and 0.75) measured at room temperature. | ||
In terms of the novel nanostructure of the modified samples, ZnO/NPC@Co/NPC-x, the dependence of samples’ complex permittivity (εr = ε′ − jε′′) and permeability ((μr = μ′ − jμ′′)) on frequency was investigated, where the real parts of complex permittivity (ε′) and complex permeability (μ′) represent the storage capability of electric and magnetic energy, and the imaginary parts (ε′′ and μ′′) stand for the loss capability of electric and magnetic energy.43 The μ′ and μ′′ values of all the samples are almost constant over the whole frequency range with a slight fluctuation μ′ ≈ 1.0 and μ′′ ≈ 0.0 (Fig. S3†), respectively, which suggests that all the obtained samples are one kind of weakly magnetic but high dielectric loss material.39 Here, we focus on the change in the complex permittivity of samples with Co/NPC shells of different thicknesses.
Compared with the ε′ and ε′′ of S1–S5 (Fig. 8), for the Co/NPC, the ε′ and ε′′ values were very high, indicating the very high storage capability of electric energy and dielectric loss of the Co/NPC, which can be attributed to the higher electrical conductivity of carbon. However, the ε′ and ε′′ values of ZnO/NPC were the lowest. Furthermore, the effect of the thickness of the Co/NPC shell during the synthesis process of ZnO/NPC@Co/NPC-x was studied. The results reveal that the permittivity and EM wave absorbing performance of the ZnO/NPC@Co/NPC-x samples significantly depend on the thickness of the Co/NPC shell. It can be seen that the ε′ and ε′′ values of ZnO/NPC@Co/NPC-x are augmented with an increase in the thickness of the Co/NPC shell. It is reasonable to conclude that the complex permittivity is crucially determined by the thickness of Co/NPC. In general, the real permittivity is an expression of the polarization ability of a material which mainly arises from the dipolar polarization and interfacial polarization at the microwave frequency.44–47 In this case, the dipolar polarization is provided mainly by nanoporous carbon, and the interfacial polarization comes mainly from the interface of the cooperative consequence of the Co shell, the core/shell interfaces and the dielectric ZnO cores.48 With the increase of Co/NPC shells, the total pore volume of ZnO/NPC@Co/NPC-0.5 was the largest according to the results in Table 2. This is because when the molar ratio of Co2+/Zn2+ is 0.75, the sample has a more serious distorted surface. Therefore, the ZnO/NPC@Co/NPC-0.75 has a lower pore volume. The interface of ZnO/NPC and Co/NPC is augmented as a result of increasing the thickness of Co/NPC shells, which brings about an increase of the interfacial polarization.
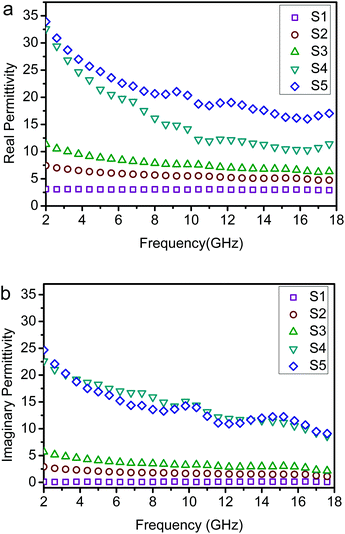 | ||
| Fig. 8 Measured frequency dependence of the permittivity of sample–paraffin (50 wt%) composites. (a) Real parts of the permittivity and (b) imaginary parts of the permittivity. | ||
The RL coefficients of the as-obtained samples were calculated from the measured relative complex permittivity and permeability values at a given frequency and layer thickness. According to transmission line theory, the RL coefficient (dB) can be defined with the following equations:49,50
| Zin = Z0(μr/εr)1/2tanh[j(2πfd/c)(μrεr)1/2] | (1) |
| RL = 20log|(Zin − Z0)/(Zin + Z0)| | (2) |
Furthermore, Fig. S4† shows the variation of RL values versus frequency for ZnO/NPC (Fig. S4a†) and Co/NPC (Fig. S4b†) at different thicknesses. However, the RL values for ZnO/NPC and Co/NPC cannot reach −10 dB within a thickness range of 1.0–5.0 mm. The poor RL values indicate that the ZnO/NPC and Co/NPC could not be used for practical applications. It is gratifying that the ZnO/NPC@Co/NPC-0.5 shows outstanding EM absorption performance (Fig. 10b). For ZnO/NPC@Co/NPC-0.5, a minimum RL of −45 dB can be obtained at 12.5 GHz with a thickness of 2.2 mm, and RL values less than −10 dB can be gained in the 4.3–18 GHz range with absorber thicknesses of 1–5 mm. In terms of ZnO/NPC@Co/NPC-0.25 (Fig. 10a), the minimum RL is only −13.7 dB at 15 GHz with a thickness of 2.5 mm. Unfortunately, in the frequency range of 2–18 GHz, the RL values of ZnO/NPC@Co/NPC-0.75 (Fig. 10c) cannot reach −10 dB with a thickness range of 1.0–5.0 mm. Moreover, the dependence of RL values on the sample thickness can be analyzed, as shown in Fig. 10, for all the samples, it is clear that the absorption peaks shift toward low frequency regions as the absorber thickness increases. The dependence of the RL peak on the sample thickness can be analyzed by the quarter-wavelength matching model, in which the relationship between the absorber thickness (d) and the peak frequency (f) can be described by using the following equation:51,52
 | (3) |
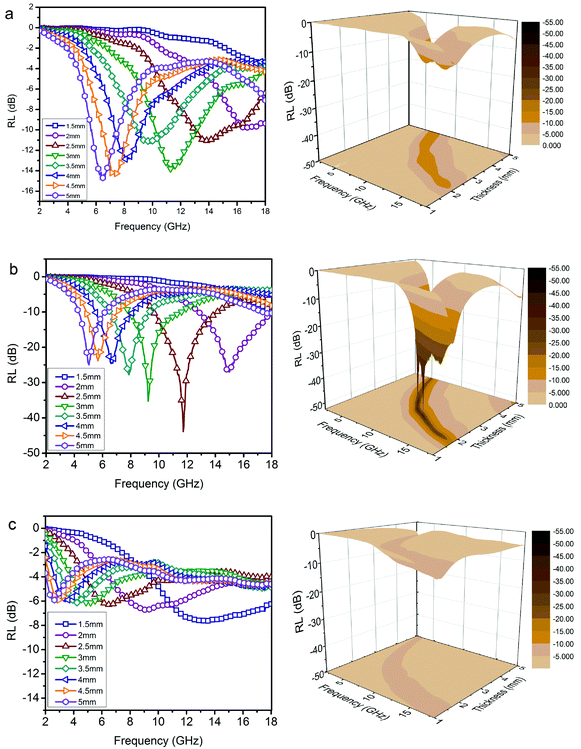 | ||
| Fig. 10 RL curves and 3D plots of the paraffin-based composites (50 wt%). (a) ZnO/NPC@Co/NPC-0.25; (b) ZnO/NPC@Co/NPC-0.5; (c) ZnO/NPC@Co/NPC-0.75. | ||
According to the quarter-wavelength matching model, the absorption peaks shift to the lower frequency range with an increase of thickness. Furthermore, based on eqn (2), when Zin is close to Z0, the optimal absorption performance of the absorber can be achieved. According to previous reports,53 when the matching thickness of the samples satisfies eqn (3), Z = |Zin/Z0| is close to 1. Therefore, when the relationship between the matching thickness and the matching frequency of the samples satisfies eqn (3), the minimum RL can be obtained. Compared with the EM absorption performance of the Co/NPC obtained from pure ZIF-67 and ZnO/NPC acquired from pure ZIF-8, the results suggest that the ZnO/NPC@Co/NPC-0.5 has remarkable absorbing characteristics in wide frequency bands in the 2–18 GHz range with thicknesses of 1.0–5.0 mm, which indicates that the application of EM wave absorption over the whole band (2–18 GHz) can be realized by adjusting the matching thickness.
It is generally accepted that there are two key factors which should be considered for an excellent absorber. One is the impedance match, requiring the equality of the electromagnetic parameters; the other is the best electromagnetic wave attenuation in the interior of the absorber. The value of Z = |Zin/Z0| obtained using eqn (2) was used to evaluate impedance matching. The attenuation constant α, which determines the attenuation properties of materials, can be determined as:54
 | (4) |
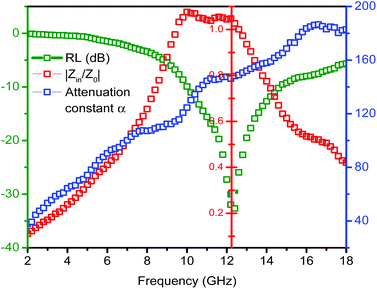
Here, we take ZnO/NPC@Co/NPC-0.5 as an example to elaborate the importance of considering the two factors for an outstanding absorber. Fig. 11 shows the frequency dependence of Z = |Zin/Z0| and the attenuation constant α for ZnO/NPC@Co/NPC-0.5, hence, the relationship between the frequency and the RL at the matching thickness (d = 2.2 mm) is also presented. When the attenuation constant α reaches a maximum value of 16.5 GHz, the minimum RL cannot be obtained and the relevant Z is close to 1.05 at the matching thickness of 2.2 mm. However, when the matching frequency is 12.3 GHz, the minimum RL can be achieved, meanwhile, the relevant Z is close to 1 at the matching thickness of 2.2 mm. Therefore, the results provide a significant guide for the design required for the microwave absorber. We not only consider the material attenuation capacity for the EM wave, but also must take into account the importance of impedance matching.
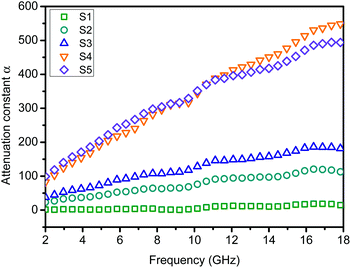
To understand the microwave absorbing performance enhancement mechanism of ZnO/NPC@Co/NPC-0.5, the dependence of the characteristic impedance and attenuation constant α on the frequency was investigated. From eqn (4), the higher values of ε′′ would result in higher α. As shown in Fig. 12, Co/NPC has the largest α in all frequency ranges, indicating excellent attenuation which is attributed to its higher ε′′. For Co/NPC, the outstanding electromagnetic wave damping capacity may come from electrical loss and polarization relaxation loss. The electrical loss is attributed to the generation of a leaking current in the conductive networks consisting of nanoporous carbon and metal Co.
The polarization relaxation mainly arises from dipolar polarization and interfacial polarization. In this case, the dipolar polarization is provided mainly by the pore wall edge of nanoporous carbon, and the interfacial polarization mainly comes from the interface of Co/carbon. However, the attenuation constant, α, of ZnO/NPC@Co/NPC-0.5 is significantly reduced due to its low ε′′. Nevertheless, ZnO/NPC@Co/NPC-0.5 also possesses a higher capacity for converting electromagnetic waves to other forms of energy. The high ε′′ of Co/NPC implies that Co/NPC has an outstanding attenuating capacity, but the higher ε′ also leads to a stronger reflection of incident EM waves on the material surface.55 Based on the above discussion, for improved EM-wave absorption properties, the main contribution should come from impedance matching. Thus, the introduction of Co/NPC to the obtained ZnO/NPC@Co/NPC-x is helpful.
In the above description, we can realize that the ε′ and ε′′ values of ZnO/NPC@Co/NPC-x decreased with an increase in the thickness of the Co/NPC shell. For a multiphase mixture, the most commonly used equation for predicting the dielectric constant of the composite is the logarithmic law of mixing, as shown in eqn (5):56
ln![[thin space (1/6-em)]](https://www.rsc.org/images/entities/char_2009.gif) ε′ = V1ln ε′ = V1ln![[thin space (1/6-em)]](https://www.rsc.org/images/entities/char_2009.gif) ε′1 + V2ln ε′1 + V2ln![[thin space (1/6-em)]](https://www.rsc.org/images/entities/char_2009.gif) ε′2 + V3ln ε′2 + V3ln![[thin space (1/6-em)]](https://www.rsc.org/images/entities/char_2009.gif) ε′3 ε′3 | (5) |
ε′′ is an expression of the electrical conductivity of the material. Based on the Debye theory, this can be expressed by using the following formula:57
 | (6) |
Conclusions
Core–shell ZIF-8@ZIF-67 crystals, which integrate the properties of single ZIF-8 and ZIF-67, are elaborately designed for the first time by applying a seed-mediated growth technique. The shell thicknesses of ZIF-67 can be tuned simply by varying the feeding molar ratios of Co2+/Zn2+. After the direct carbonization of core–shell ZIF-8@ZIF-67 crystals, a new type of selectively functionalized ZnO/NPC@Co/NPC material remains and the ZnO/NPC@Co/NPC-0.5 exhibited outstanding microwave absorption performance. The maximum reflection loss that can be achieved is −28.8 dB at an absorbent thickness of 1.9 mm and a broad absorption bandwidth of 4.2 GHz (RL values exceeding −10 dB) covers the 13.8–18 GHz frequency range. This study provides a good reference for future preparation of other carbon-based lightweight microwave absorbing materials derived from MOFs. Furthermore, the potential applications of the carbon-based materials can be developed and extended from water treatment and catalysis to the microwave absorbing domain.Acknowledgements
The authors acknowledge the financial support from the National Nature Science Foundation of China (no.: 11575085), the Aeronautics Sciences Foundation of China (no.: 2014ZF52072), the Open Research Fund of Jiangsu Provincial Key Laboratory for Nanotechnology of Nanjing University, the Qing Lan Project, Six Talent Peaks Project in Jiangsu Province (no.: XCL-035) and the project also founded by the Priority Academic Program Development of Jiangsu Higher Education Institutions (PAPD).References
- B. Zhao, G. Shao, B. B. Fan, W. Y. Zhao, Y. J. Xie and R. Zhang, J. Mater. Chem. A, 2015, 3, 10345 CAS.
- B. Zhao, G. Shao, B. B. Fan, W. Y. Zhao and R. Zhang, RSC Adv., 2014, 4, 57424 RSC.
- G. M. Li, L. C. Wang, W. X. Li, R. M. Ding and Y. Xu, Phys. Chem. Chem. Phys., 2014, 16, 12385 RSC.
- F. Qin and C. Brosseau, J. Appl. Phys., 2012, 111, 1301 Search PubMed.
- Y. Zhang, Y. Huang, T. F. Zhang, H. C. Chang, P. S. Xiao, H. H. Chen, Z. Y. Huang and Y. S. Chen, Adv. Mater., 2015, 27, 2049 CrossRef CAS PubMed.
- H. Zhang, A. J. Xie, C. P. Wang, H. S. Wang, Y. H. Shen and X. Y. Tian, J. Mater. Chem. A, 2013, 1, 8547 CAS.
- L. Wang, Y. Huang, X. Sun, H. J. Huang, P. B. Liu, M. Zong and Y. Wang, Nanoscale, 2014, 6, 3157 RSC.
- K. Singh, A. Ohlan, V. H. Pham, R. Balasubramaniyan, S. Varshney, J. Jang, S. H. Hur, W. M. Choi, M. Kumar, S. K. Dhawan, B.-S. Kong and J. S. Chung, Nanoscale, 2013, 5, 2411 RSC.
- D. Z. Chen, G. S. Wang, S. He, J. Liu, L. Guo and M. S. Cao, J. Mater. Chem. A, 2013, 1, 5996 CAS.
- R. C. Che, L. M. Peng, X. F. Duan, Q. Chen and X. L. Liang, Adv. Mater., 2004, 16, 401 CrossRef CAS.
- A. Wadhawan, D. Garrett and J. M. Perez, J. Appl. Phys., 2003, 83, 2683 CAS.
- K. R. Paton and A. H. Windle, Carbon, 2008, 46, 1935 CrossRef CAS.
- L. N. Wang, X. L. Jia, Y. F. Li, F. Yang, L. Q. Zhang, L. P. Liu, X. Ren and H. T. Yang, J. Mater. Chem. A, 2014, 2, 14940 CAS.
- G. Z. Shen, Y. W. Xu, B. Liu, P. Du, Y. Li, J. Zhu and D. Zhang, J. Alloys Compd., 2016, 680, 553 CrossRef CAS.
- Y. C. Du, T. Liu, B. Yu, H. B. Gao, P. Xu, J. Y. Wang, X. H. Wang and X. J. Han, Mater. Chem. Phys., 2012, 135, 884 CrossRef CAS.
- H. J. Wu, L. D. Wang, Y. M. Wang, S. L. Guo and H. Wu, Mater. Res. Innovations, 2014, 18, 273 CrossRef CAS.
- C. W. Abney, K. M. L. Taylor-Pashow, S. R. Russell, Y. Chen, R. Samantaray, J. V. Lockard and W. B. Lin, Chem. Mater., 2014, 26, 5231 CrossRef CAS.
- P. Falcaro, R. Ricco, C. M. Doherty, K. Liang, A. J. Hillb and M. J. Styles, Chem. Soc. Rev., 2014, 43, 5513 RSC.
- J. Zheng, C. Cheng, W. J. Fang, C. Chen, R. W. Yan, H. X. Huai and C. C. Wang, CrystEngComm, 2014, 16, 3960 RSC.
- S. Sorribas, B. Zornoza, C. Teillez and J. Coronas, Chem. Commun., 2012, 48, 9388 RSC.
- R. B. Wu, X. K. Qian, X. H. Rui, X. H. Liu, D. B. Ya, K. Zhou, J. Wei, Q. Y. Yan, X. Q. Feng, Y. Long, L. Y. Wang and Y. Z. Huang, Small, 2014, 10, 1932 CrossRef CAS PubMed.
- M. Hu, J. Reboul, S. Furukawa, N. L. Torad, Q. Ji, P. Srinivasu, K. Ariga, S. Kitagawa and Y. Yamauchi, J. Am. Chem. Soc., 2012, 134, 2864 CrossRef CAS PubMed.
- X. Xu, R. Cao, S. Jeong and J. Cho, Nano Lett., 2012, 12, 4988 CrossRef CAS PubMed.
- W. Chaikittisilp, M. Hu, H. Wang, H. S. Huang, T. Fujita, K. C. W. Wu, L. C. Chen, Y. Yamauchi and K. Ariga, Chem. Commun., 2012, 48, 7259 RSC.
- W. C. Lee, H. T. Chien, Y. Lo, H. C. Chiu, T. P. Wang and D. Y. Kang, ACS Appl. Mater. Interfaces, 2015, 7, 18353 CAS.
- M. Srivastava, P. K. Roy and A. Ramanan, RSC Adv., 2016, 6, 13426 RSC.
- H. Yin, J. Choi and A. C. K. Yip, Catal. Today, 2016, 265, 203 CrossRef CAS.
- J. Yang, F. J. Zhang, H. Y. Lu, X. Hong, H. L. Jiang, Y. Wu and Y. D. Li, Angew. Chem., Int. Ed., 2015, 127, 11039 CrossRef.
- N. L. Torad, M. Hu, S. Ishihara, H. Sukegawa, A. A. Belik, M. Imura, K. Ariga, Y. Sakka and Y. Yamauchi, Small, 2014, 10, 2096 CrossRef CAS PubMed.
- X. M. Zhang, G. B. Ji, W. Liu, B. Quan, X. H. Liang, C. M. Shang, Y. Cheng and Y. W. Du, Nanoscale, 2015, 7, 12932 RSC.
- S. Furukawa, K. Hirai, K. Nakagawa, Y. Takashima, R. Matsuda, T. Tsuruoka, M. Kondo, R. Haruki, D. Tanaka, H. Sakamoto, S. Shimomura, O. Sakata and S. Kitagawa, Angew. Chem., Int. Ed., 2009, 48, 1766 CrossRef CAS PubMed.
- T. H. Park, A. J. Hickman, K. Koh, S. Martin, A. G. Wong-Foy, M. S. Sanford and A. J. Matzger, J. Am. Chem. Soc., 2011, 133, 20138 CrossRef CAS PubMed.
- M. S. Cao, X. L. Shi, X. Y. Fang, H. B. Jin, Z. L. Hou, W. Zhou and Y. J. Chen, Appl. Phys. Lett., 2007, 91, 3110 Search PubMed.
- Y. J. Chen, M. S. Cao, T. H. Wang and Q. Wan, Appl. Phys. Lett., 2004, 84, 3367 CrossRef CAS.
- X. Tang and K. A. Hu, Mater. Sci. Eng., B, 2007, 139, 119 CrossRef CAS.
- R. Banerjee, A. Phan, B. Wang, C. Knobler, H. Furukawa, M. O'Keeffe and O. M. Yaghi, Science, 2008, 319, 939 CrossRef CAS PubMed.
- B. Xie, J. W. Song, L. M. Ren, Y. Y. Ji, J. X. Li and F. S. Xiao, Chem. Mater., 2008, 20, 4533 CrossRef CAS.
- K. S. Park, Z. Ni, A. P. Cote, J. Y. Choi, R. D. Huang, F. J. Uribe-Romo, H. K. Chae, M. O'Keeffe and O. M. Yaghi, Proc. Natl. Acad. Sci. U. S. A., 2006, 103, 10186 CrossRef CAS PubMed.
- Y. F. Wang, D. L. Chen, X. Yin, P. Xu, F. Wu and M. He, ACS Appl. Mater. Interfaces, 2015, 7, 26226 CAS.
- G. X. Tong, F. T. Liu, W. H. Wu, F. F. Du and J. G. Guan, J. Mater. Chem. A, 2014, 2, 7373 CAS.
- L. S. Cheng and R. T. Yang, Chem. Eng. Sci., 1994, 49, 2599 CrossRef CAS.
- N. L. Torad, R. R. Salunkhe, Y. Q. Li, H. Hamoudi, M. Imura, Y. Sakka, C. C. Hu and Y. Yamauchi, Chem. – Eur. J., 2014, 20, 7895 CrossRef CAS PubMed.
- T. Xia, C. Zhang, N. A. Oyler and X. B. Chen, Adv. Mater., 2013, 25, 6905 CrossRef CAS PubMed.
- B. Zhao, W. Y. Zhao, G. Shao, B. B. Fan and R. Zhang, ACS Appl. Mater. Interfaces, 2015, 7, 12951 CAS.
- Z. G. Fang, C. S. Li, J. Y. Sun, H. T. Zhang and J. S. Zhang, Carbon, 2007, 45, 2873 CrossRef CAS.
- Q. L. Liu, D. Zhang and T. X. Fan, Appl. Phys. Lett., 2008, 93, 3110 Search PubMed.
- P. C. P. Watts, W. K. Hsu, A. Barnes and B. Chambers, Adv. Mater., 2003, 15, 600 CrossRef CAS.
- B. Zhao, G. Shao, B. B. Fan, W. Y. Zhao and R. Zhang, Phys. Chem. Chem. Phys., 2015, 17, 6044 RSC.
- H. L. Lv, H. Q. Zhang, J. Zhao, G. B. Ji and Y. W. Du, Nano Res., 2016, 9, 1813 CrossRef CAS.
- B. Zhao, G. Shao, B. B. Fan, W. Y. Zhao and R. Zhang, Phys. Chem. Chem. Phys., 2015, 17, 2531 RSC.
- X. H. Liang, X. M. Zhang, W. Liu, D. M. Tang, B. S. Zhang and G. B. Ji, J. Mater. Chem. C, 2016, 4, 6816 RSC.
- B. Zhao, G. Shao, B. B. Fan, W. Y. Zhao and R. Zhang, Mater. Electron., 2015, 26, 5393 CrossRef CAS.
- X. H. Li, J. Feng, Y. P. Du, J. T. Bai, H. M. Fan, H. L. Zhang, Y. Peng and F. S. Li, J. Mater. Chem. A, 2015, 3, 5535 CAS.
- H. L. Lv, X. H. Liang, G. B. Ji and H. Q. Zhang, ACS Appl. Mater. Interfaces, 2015, 7, 9776 CAS.
- X. M. Zhang, G. B. Ji, W. Liu, X. X. Zhang, Q. W. Gao, Y. C. Li and Y. W. Du, J. Mater. Chem. C, 2016, 4, 1860 RSC.
- G. P. Zheng, X. W. Yin, S. H. Liu, X. M. Liu, J. L. Deng and Q. Li, J. Eur. Ceram. Soc., 2013, 33, 2173 CrossRef CAS.
- M. S. Cao, W. L. Song, Z. L. Hou, B. Wen and J. Yuan, Carbon, 2010, 48, 788 CrossRef CAS.
- J. Tang, R. R. Salunkhe, J. Liu, N. L. Torad, M. Imura, S. Furukawa and Y. Yamauchi, J. Am. Chem. Soc., 2015, 137, 1572 CrossRef CAS PubMed.
Footnote |
| † Electronic supplementary information (ESI) available: Additional photographs, and permittivity and permeability of samples. See DOI: 10.1039/c6qi00359a |
| This journal is © the Partner Organisations 2016 |

