 Open Access Article
Strong and tuneable wet adhesion with rationally designed layer-by-layer assembled triblock copolymer films†
Andrea
Träger
*a,
Samuel A.
Pendergraph
a,
Torbjörn
Pettersson
 ab,
Tobias
Halthur
cd,
Tommy
Nylander
e,
Anna
Carlmark
a and
Lars
Wågberg
*ab
aKTH Royal Institute of Technology, School of Chemical Science and Engineering, Department of Fibre and Polymer Technology, Teknikringen 56, SE-100 44 Stockholm, Sweden. E-mail: wagberg@kth.se
bKTH Royal Institute of Technology, Wallenberg Wood Science Centre, Teknikringen 56, SE-110 44 Stockholm, Sweden
cCR Competence AB, SE-221 00 Lund, Sweden
dMalmö University, Faculty of Health and Society, Department of Biomedical Science, SE-20506 Malmö, Sweden
eDepartment of Physical Chemistry, Lund University, SE-221 00 Lund, Sweden
First published on 8th October 2016
Abstract
In this study the wet adhesion between Layer-by-Layer (LbL) assembled films of triblock copolymer micelles was investigated. Through the LbL assembly of triblock copolymer micelles with hydrophobic, low glass transition temperature (Tg) middle blocks and ionic outer blocks, a network of energy dissipating polymer chains with electrostatic interactions serving as crosslinks can be built. Four triblock copolymers were synthesized through Atom Transfer Radical Polymerisation (ATRP). One pair had a poly(2-ethyl-hexyl methacrylate) middle block with cationic or anionic outer blocks. The other pair contained the same ionic outer blocks but poly(n-butyl methacrylate) as the middle block. The wet adhesion was evaluated with colloidal probe AFM. To our knowledge, wet adhesion of the magnitude measured in this study has not previously been measured on any polymer system with this technique. We are convinced that this type of block copolymer system grants the ability to control the geometry and adhesive strength in a number of nano- and macroscale applications.
Introduction
Block copolymers have attracted wide attention over the last decades.1–6 The interest arises from the ability of these molecules to micro-phase separate in bulk and self-assemble in selective solvents due to chemically distinct polymer blocks which are covalently bonded.4 There are several well established uses of block copolymers, such as styrene-butadiene rubbers in tires7 and compatibilisers in composite materials.8,9 Block copolymers containing blocks with different surface energies can be used to reduce the interfacial tension between two materials in a blend.3,10 There are also several emerging application areas for block copolymers, including templates for nanolithography2,11 and vehicles for controlled drug delivery.1,3 Block copolymers can be designed to self-assemble in aqueous solution to micelles with a hydrophilic corona and hydrophobic core, and the latter can as an example be loaded with a hydrophobic drug.12,13 These block copolymer micelles can be tuned to partly or fully disassemble to release the drug based on various parameters such as temperature, pH or the presence of a targeted receptor.3,14,15 Block copolymers have also been introduced into Layer-by-Layer (LbL) assembled thin films.14,16LbL assembly enables excellent control of the thickness and composition on a nano-metre scale.17 Since it garnered wide attention in the early 1990s, this technique has been used to assemble a broad variety of molecular systems.16–19 A few of the investigated areas are thermoresponsive drug delivery systems and other biomedical applications,14,20–23 flame-retardant paper,24 and energy storage devices.25–27 In our group, an LbL system with poly(allylamine hydrochloride) (PAH) and hyaluronic acid (HA) has previously been studied.28–30 These studies showed that paper sheets made from LbL modified pulp with nanometre-thin (<25 nm) layers of these polymers adsorbed onto the fibres exhibited significantly larger tensile strength and strain at failure, compared to sheets prepared from neat pulp fibres.28 In a subsequent study of the interactions between PAH/HA in LbL thin films, it was found that the wet adhesion of this LbL system as measured by colloidal probe atomic force microscopy (AFM) was 20 times higher than that of collagen and bone.29 This previous work concluded that LbL assembled thin films can be used as efficient adhesive joints between fibres to modify the mechanical properties of the papers made from the same, and that a strong wet-adhesion was measured for the system. Motivated by these previous results, we sought to investigate whether the characteristics of the adhesive joints can be fine-tuned by a more detailed tailoring of the polymers used. It would also be desirable to design a system which could obtain adhesion comparable with that of the previously studied systems, but with a lower number of layers added in the LbL assembly. Through the LbL assembly of triblock copolymer micelles with long, hydrophobic, low Tg middle blocks and short, alternately charged outer blocks we built a thin film consisting of a network of flexible, energy dissipating polymer chains with electrostatic interactions between the polyelectrolyte blocks as linkages. In this study, we have investigated the adhesion of LbL assembled films of triblock copolymer micelles, opening up yet another application area for block copolymers – as nanometre thin adhesive films with tailored thickness and softening properties.
Four triblock copolymers (ABA type) were synthesized and studied, two with poly(2-ethyl-hexyl methacrylate) (PEHMA) and two with poly(n-butyl methacrylate) (PBMA) as middle block. Ionic endblocks were augmented onto the periphery of the precursor hydrophobic middle block to form a cationic or anionic triblock copolymer. The cationic polymers had quaternized poly(dimethyl aminoethyl methacrylate) (QPDMAEMA) as outer blocks and the anionic ones poly(methacrylic acid) (PMAA). PEHMA has a Tg of around −10 °C (ref. 31) and PBMA of around 20 °C.32 These two were chosen to compare copolymers with middle blocks having glass transition temperatures below and at room temperature, respectively. Furthermore, all of the polymers were polymerised through Atom Transfer Radical Polymerisation (ATRP), where the living chain ends of the middle blocks were utilized as initiators for the outer blocks. ATRP enables good control over molecular architecture.33
Experimental
Detailed synthesis and characterisation of the synthesised polymers are found in the ESI,† along with a description of the preparation of cellulose model surfaces. The four triblock copolymers will be denoted PEHMA+ (for the QPDMAEMA-PEHMA-QPDMAEMA copolymer), PEHMA− (PMAA-PEHMA-PMAA), PBMA+ (QPDMAEMA-PBMA-QPDMAEMA) and PBMA− (PMAA-PBMA-PMAA), respectively, throughout the text.Micelle dispersion preparation
10 mg of triblock copolymer PEHMA+ or PBMA+ were dissolved in 2 g of DMF. This solution was then added dropwise, slowly to 18 g of MilliQ water. The resulting dispersion was dialyzed in a 2 L beaker with mild agitation against MilliQ water which was replaced 3 times a day for 3 days. Micelle preparation for the PMAA containing block copolymers followed the same procedure but with 10 mg of polymer dissolved in 4 g of DMF and then added to 36 g of MilliQ water. All micelle dispersions were diluted to 0.1 mg ml−1, filtered through a 1.2 μm filter (Supor® membrane, Acrodisic® filter, Pall Corporation) and then used without further adjustments unless otherwise stated.Preparation of layer-by-layer films
A freshly cleaved mica surface or cellulose model surface, was placed in the micelle dispersion for 15 min, and washed by dipping in three consecutive baths of MilliQ water. The surfaces were dried by N2(g), or placed in the next micelle dispersion, repeating the adsorption – washing cycle until the desired number of bilayers was reached. For AFM measurements in wet state, the layers were assembled in situ with 15 minutes of micelle adsorption followed by rinsing with MilliQ water before each measurement, i.e. without drying. For Colloidal Probe AFM, the substrates were a flat mica surface and a silica sphere.Characterisation
Oxidized silicon surfaces used for ellipsometry were prepared from silicon wafers (Okmetic OY, Espoo, Finland). The surfaces were gently boiled first in an alkaline solution (NH4OH, H2O2 and water, 1![[thin space (1/6-em)]](https://www.rsc.org/images/entities/char_2009.gif) :
:![[thin space (1/6-em)]](https://www.rsc.org/images/entities/char_2009.gif) 1
1![[thin space (1/6-em)]](https://www.rsc.org/images/entities/char_2009.gif) :
:![[thin space (1/6-em)]](https://www.rsc.org/images/entities/char_2009.gif) 5 by volume) for 5 min, rinsed three times in water, and then gently boiled in an acidic solution (HCl, H2O2 and water, 1
5 by volume) for 5 min, rinsed three times in water, and then gently boiled in an acidic solution (HCl, H2O2 and water, 1![[thin space (1/6-em)]](https://www.rsc.org/images/entities/char_2009.gif) :
:![[thin space (1/6-em)]](https://www.rsc.org/images/entities/char_2009.gif) 1
1![[thin space (1/6-em)]](https://www.rsc.org/images/entities/char_2009.gif) :
:![[thin space (1/6-em)]](https://www.rsc.org/images/entities/char_2009.gif) 5 by volume) for 5 min. Finally, the surfaces were rinsed in water three times and then in ethanol twice and stored in ethanol. Directly before ellipsometric measurements the cleaned silica surfaces were put in a alkaline NaOH solution for 30 minutes, then rinsed in water, dried by N2(g) and cleaned in a plasma oven for 5 min.
5 by volume) for 5 min. Finally, the surfaces were rinsed in water three times and then in ethanol twice and stored in ethanol. Directly before ellipsometric measurements the cleaned silica surfaces were put in a alkaline NaOH solution for 30 minutes, then rinsed in water, dried by N2(g) and cleaned in a plasma oven for 5 min.
Adsorption of the micelle dispersions to silica surfaces was monitored in situ to obtain time-resolved values of the thickness and refractive index of the films. Theoretical principles are described in literature,35 and the experimental setup was based on null ellipsometry according to the principles of Cuypers.36 The instrument used was a Rudolph thin film ellipsometer (type 436, Rudolph Research) automated according to the concept of Landgren and Jönsson.37 The instrument was equipped with a xenon arc lamp as the light source. Measurements were performed at 401.5 nm and an angle of incidence of 67.87°. The 5 mL trapezoid cuvette was equipped with a magnetic stirrer and thermostated to 25 °C. Determination of the complex refractive index of the silicon and the thickness and refractive index of the silicon oxide layer was performed using air and the aqueous phase as ambient media,37 and four zone measurements were conducted to reduce systematic errors.
The measurement was performed in a liquid cell with an adsorption step followed by rinsing before the next adsorption. Each reported value of film thickness or refractive index was an average of between 50–100 data points from one measurement during and after rinsing, when the liquid cell was filled with MilliQ water. Any change in refractive index of the solution in the liquid cell during adsorption did not affect the measured values, since the reported data was only collected when the liquid cell was filled with MilliQ water. The measurement was performed twice for each polymer system with the same trend during both measurements.
Results
Neat polymers
The middle block, either PEHMA or PBMA, was synthesized from a difunctional ATRP initiator with a five carbon spacer between the two initiating groups, to enable some distance between the bulky monomers, in particular 2-ethyl-hexyl methacrylate. These polymers were then used as macroinitiators for the subsequent ATRP of the outer blocks, either PDMAEMA or Pt-BMA. The PDMAEMA blocks were then quaternized to yield cationic charges, the Pt-BMA blocks were deprotected to methacrylic acid units, respectively. Reaction schemes of the synthesized triblock copolymers are shown in the ESI.† The properties of the four different triblock copolymers are summarized in Table 1. The molecular weights measured by SEC were smaller than the ones calculated from NMR spectra. The SEC was calibrated with polystyrene standards, and the synthesised polymers were unlikely to behave identically to polystyrene in solution. The true molecular weight of the block copolymers are therefore likely closer to the values calculated from NMR spectra.| Polymer | DPrespective block | M n (NMR) [g mol−1] | M n (SEC) [g mol−1] | Đ |
|---|---|---|---|---|
| a Calculated for the final polymers from 1H-NMR spectra of the protected or unquaternized precursors. b SEC results for the precursors. | ||||
| PEHMA homopolymer | 176 | 34![[thin space (1/6-em)]](https://www.rsc.org/images/entities/char_2009.gif) 900 900 |
24![[thin space (1/6-em)]](https://www.rsc.org/images/entities/char_2009.gif) 600 600 |
1.17 |
| PEHMA+ | 9-176-9a | 38![[thin space (1/6-em)]](https://www.rsc.org/images/entities/char_2009.gif) 000a 000a |
24![[thin space (1/6-em)]](https://www.rsc.org/images/entities/char_2009.gif) 400b 400b |
1.15b |
| PEHMA− | 15-176-15a | 36![[thin space (1/6-em)]](https://www.rsc.org/images/entities/char_2009.gif) 200a 200a |
29![[thin space (1/6-em)]](https://www.rsc.org/images/entities/char_2009.gif) 500b 500b |
1.17b |
| PEHMA homopolymer | 212 | 30![[thin space (1/6-em)]](https://www.rsc.org/images/entities/char_2009.gif) 200 200 |
24![[thin space (1/6-em)]](https://www.rsc.org/images/entities/char_2009.gif) 800 800 |
1.19 |
| PBMA+ | 10-212-10a | 33![[thin space (1/6-em)]](https://www.rsc.org/images/entities/char_2009.gif) 600a 600a |
27![[thin space (1/6-em)]](https://www.rsc.org/images/entities/char_2009.gif) 000b 000b |
1.15b |
| PBMA− | 15-212-15a | 32![[thin space (1/6-em)]](https://www.rsc.org/images/entities/char_2009.gif) 700a 700a |
28![[thin space (1/6-em)]](https://www.rsc.org/images/entities/char_2009.gif) 800b 800b |
1.18b |
The polymers had substantially longer middle blocks than outer blocks with DPs close to the targeted values, as shown through 1H-NMR. SEC of the protected or unquaternized precursors of the final triblock copolymers showed low molar-mass dispersities and monomodal curves, which indicate that the chain extensions were successful. The Tg of the PEHMA and PBMA homopolymers were measured to −11 °C and 33 °C, respectively, using DSC.
Micelle dispersions
The properties of micelle dispersions prepared from the four triblock copolymers are presented in Table 2. No significant change in hydrodynamic diameter of the micelles (dhyd) was detected with 5 or 10 mM NaCl added to the dispersions. Cryo-TEM showed spherical micelles for all four dispersions.| Triblock copolymer | d hyd [nm] | Zeta potential [mV] | Charge density [μeq g−1] | Unadjusted pH |
|---|---|---|---|---|
| PEHMA+ | 70 | 45 | 120 | 6.4 |
| PEHMA− | 170 | −40 | 120 | 6.5 |
| PBMA+ | 66 | 44 | 350 | 6.6 |
| PBMA− | 35 | −40 | 320 | 6.8 |
Adsorption behaviour
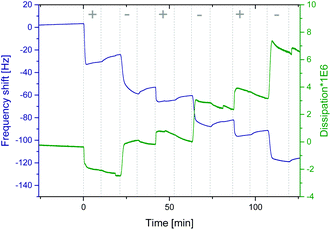
Fig. 1 shows a representative graph of a QCM-D measurement of neat PEHMA+ and PEHMA− dispersions (in the QCM figure denoted “+” and “−”, respectively) adsorbed onto a cellulose model surface. The dissipation decreased for the first adsorbed layer, which was likely the result of expulsion of water from the cellulose film when the mainly hydrophobic polymer chains are adsorbed onto it. One of the intended applications for these polymer systems was the modification of cellulose fibre–fibre joints. Therefore QCM-D measurements were performed both on spin coated cellulose surfaces and the neat silica surface of the QCM crystal, with a similar adsorption behaviour for both substrates. The aforementioned decrease in dissipation when the first layer was adsorbed was only seen when cellulose was used as substrate. QCM-D measurements were performed with both triblock copolymer micelle systems, PEHMA+/PEHMA− and PBMA+/PBMA−, which showed that both micelle systems did adsorb in multilayers onto the neat silica surface of the QCM crystal as well as cellulose model surfaces spin coated onto the crystal. Additional QCM graphs can be found in the ESI.† Ellipsometry showed that the increase in thickness was slight after the initial monolayer (Fig. 2), and not linearly correlated to the adsorbed mass. Rather than forming an increasingly thicker layer, the film apparently becomes denser during the LbL build-up, which was also reflected in an increasing film refractive index (see ESI† for graphs).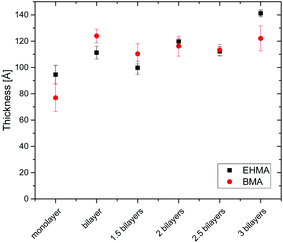 | ||
| Fig. 2 Wet thickness of LbL assembled films measured by ellipsometry, with standard deviation shown as error bars. | ||
In Fig. 3, AFM images in dry state of PEHMA+/PEHMA− adsorbed onto mica are shown. The surfaces were prepared as described under “Preparation of layer-by-layer films”. The structures seen on the monolayer image were roughly 4 nm in height and 80 nm in width. These structures were caused by the collapse of adsorbed micelles during drying. Fig. 4 shows AFM images in dry state of a monolayer of PBMA+ and a bilayer of PBMA+/PBMA− adsorbed onto a mica surface. Here, the structures seen were roughly 7 nm high and 50 nm in width. Fig. 5 shows the PEHMA system adsorbed onto cellulose model surfaces. The morphology of the cellulose surface changed when polymer was adsorbed to it, but the adsorbed structures no longer appeared spherical in shape.
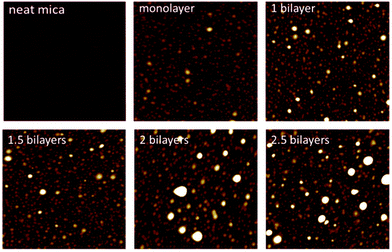 | ||
| Fig. 3 AFM images captured in dry state of PEHMA+ and PEHMA− adsorbed onto mica. The images are 2 × 2 μm in size and the z-range is 18 nm. | ||
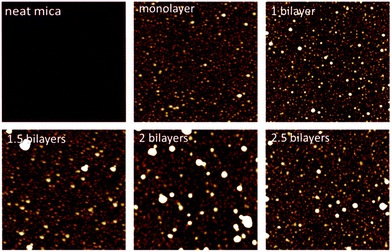 | ||
| Fig. 4 AFM images captured in dry state of PBMA+ and PBMA− adsorbed onto mica, the images are 2 × 2 μm in size and the z-range is 16 nm. | ||
 | ||
| Fig. 5 AFM images captured in dry state of PEHMA+ and PEHMA− adsorbed onto cellulose. The images are 1 × 1 μm in size and the z-rages is 44 nm. | ||
Adhesion measurements
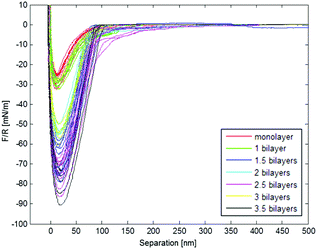
Fig. 6 shows a representative force vs. separation curve from colloidal probe AFM of multilayers of PEHMA+ and PEHMA−. When 3.5 bilayers were adsorbed to the mica surface and the silica probe, the pull-off force was around 90 mN m−1. In Fig. 7, the average energy dissipation is shown for each adsorbed layer.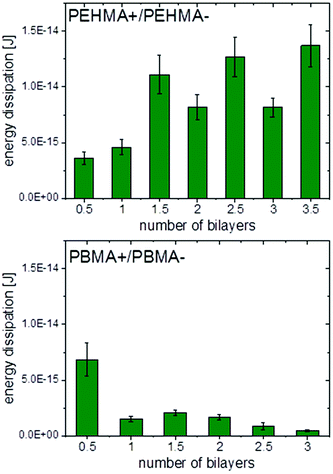 | ||
| Fig. 7 Energy dissipation for PEHMA+/PEHMA− (top) and PBMA+/PBMA− (bottom) obtained from Colloidal Probe AFM with standard deviation shown as error bars. | ||
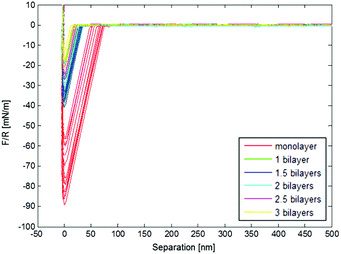
Results from Colloidal Probe AFM measurements of the PBMA system, Fig. 7 and 8, showed the opposite trend compared to PEHMA+/PEHMA−, with the pull-off force and energy dissipation decreasing as more layers were adsorbed.
The adsorption increases with salt present, and a higher pull-off force was obtained with fewer adsorbed layers of polymer, shown in Fig. 9.
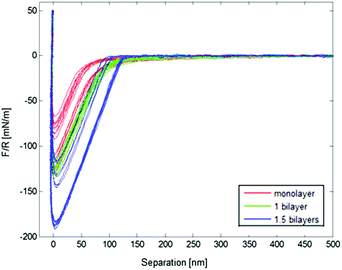 | ||
| Fig. 9 Normalised force vs. separation graph for PEHMA+/PEHMA− with 5 mM salt present during adsorption, obtained from Colloidal Probe AFM. | ||
Discussion
The synthesis and micellisation yielded triblock copolymer micelle dispersions, which were adsorbed as multilayers on various negatively charged surfaces (mica, silica, cellulose). Once the micelle dispersions of the triblock copolymers were formed, all handling of the polymers was conducted in water. This provided environmentally friendly processing conditions using a non-volatile solvent. Water as dispersant was essential for the subsequent step where an electrostatically associated film is created through the LbL assembly procedure. The main driving force for the adsorption of the micelles to the charged substrates was the increase in entropy caused by the release of counterions.42 Most organic solvents do not solvate ions as effectively as water, and hence do not facilitate the same entropy gain due to counterion release.In a previous study of the PAH/HA system, a normalised pull-off force of ∼16 mN m−1 was reached in colloidal probe AFM experiments, with three bilayers adsorbed and a surface delay of 10 s,29i.e. the probe was kept in contact with the surface for 10 seconds before retraction. The normalised pull-off force with the PEHMA system was more than 400% higher than the 16 mN m−1 without any surface delay. Had surface delay been used, the pull-off force would likely have been even higher, since the polymer chains on the two surfaces would have had more time to entangle and form interactions before separation. A comparison with the PAH/HA system is of particular interest to us, since it has been shown that the PAH/HA system can be used to modify cellulose to produce a paper material with improved mechanical properties, such as increased strainability. To further put the present results into context, a comparison of our adhesion results with literature is found as a table in the ESI.† To our knowledge, wet adhesion of the magnitude measured in this study has not previously been measured on any polymer system with colloidal probe AFM.
The work of adhesion was, with the exception of the first bilayer, stronger with PEHMA+ as outer layer than with PEHMA−. This trend was similar to the PAH/HA system, where a higher work of adhesion was seen with PAH than HA as external layer.29 There was a more than twofold increase in the work of adhesion between 1 bilayer and 1.5 bilayers. This was likely due to an increase in the number of molecular contacts between the two surfaces. After 1.5 bilayers the increase in work of adhesion starts to level off, with a ∼14% increase from 1.5 to 2.5 bilayers and ∼8% increase from 2.5 to 3.5 bilayers, suggesting that we are approaching the maximum contact reachable between the two surfaces with the present chemical system. The standard deviations for the three aforementioned samples are between 10–14%, i.e. the increases in work of adhesion seen between the same were within the respective standard deviations, graphically represented in Fig. 7.
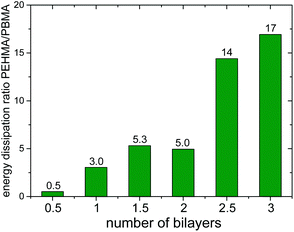
We suggest that the opposite trend for adhesive strength with increasing number of layers in the PBMA system compared to the PEHMA one was the result of the lower flexibility of PBMA due to its higher Tg.32 These observed results are in accordance with previous literature where model films were solvent casted onto mica.43 The normalised pull-off force with 3 bilayers of PBMA+/PBMA− adsorbed was comparable with the PAH/HA system, i.e. the PBMA system still exhibited strong adhesion compared to previously studied systems, but lower than the PEHMA system. For a monolayer of PBMA+, the normalised pull-off force was more than double that of the PAH/HA system with 3 bilayers of the latter adsorbed.29Fig. 10 shows a comparison of the work of adhesion between the PEHMA and PBMA systems. A monolayer of PBMA+ yielded higher adhesion than a monolayer of PEHMA+. However, beyond one layer, the PEHMA system yielded a substantially higher adhesion than the PBMA system. The micelles containing the PEHMA core were able to conform to the substrate or the underlying layer better than PBMA, enabling the formed films to obtain a high number of electrostatic linkages and van der Waals interactions on the time scale of contact time.44 The PBMA chains were less mobile which limits their ability to form electrostatic and van der Waals contacts under the same timescale. Under our experimental conditions we found the chain mobility to be more critical than having a more rigid polymer at the joint, in order to obtain strong adhesion between the modified surfaces.
The failure when probe and surface were separated was more abrupt for the PBMA system and occurred at a separation of only a few nanometres. The same failure was more gradual for the PEHMA system and occurs at a separation of around 20 nm, with a full loss of adhesion occurring at a distance between probe and surface of around 100 nm. In some cases, interaction was still seen at a separation of 200 nm. This behaviour is in concurrence with the previous discussion of the relatively rigid nature of the PBMA chains, compared to PEHMA. An estimate of the length of a fully extended and uncoiled chain of PEHMA− would give a value of ∼50 nm (the calculation is available in the ESI†). Of course it is unlikely to find the chains this extended in water with regard to the hydrophobic character of PEHMA, but it gives an indication of the theoretical maximum length of a chain. Since the distance over which we see an interaction was at least 100 nm, it cannot be single chains bridging the gap between the probe and surface. Several interacting polymer chains are needed to obtain an adhesion at the distances seen in Fig. 6.
To our knowledge, the highest pull-off force measured by colloidal probe AFM in wet state on polyelectrolyte homopolymers assembled with LbL is in the range of 15–20 mN m−1. The PEHMA system gave, as previously mentioned, a several times higher adhesion with a smaller number of layers added. This indicates that our system, with block copolymers having both hydrophobic and charged blocks adds to the adhesion in a way polyelectrolyte homopolymers cannot. One explanation is that more material may be added in each layer since we adsorb polymeric micelles instead of single polymers chains. Another is that there is both the possibility of electrostatic interactions between oppositely charged entities, and interactions between hydrophobic block with low surface tension, which interact unfavourably with the surrounding liquid medium – water. Furthermore, the soft block (i.e. above Tg) likely dissipated energy leading to the system tolerating a higher load before adhesive contact was lost.
The two studied systems have shown that our design of LbL films assembled from triblock copolymers with long, hydrophobic middle blocks and short, charged outer block yielded films with high wet adhesion. This concept can be extended to other chemistries of both outer and middle block, suitable for the application in mind. By choosing appropriate polymers, a stiffer or more strainable joint can be achieved. More than an order of magnitude in adhesive strength can be controlled by adjusting the number of layers deposited. We began this work with the aim of identifying a suitable additive to manipulate fibre-fibre joints in cellulosic materials to enhance their mechanical properties, such as increased strainability. However, we are convinced that their utility is not limited to this area. Our block copolymer LbL films provide a unique method to grant precise control of the thickness and the adhesion. We anticipate that these results can provide insight into applications demanding precise control of the adhesion and the release characteristics. The ability of these coatings to maintain a robust adhesion underwater enables the use in applications such as marine coatings or biomedical glues.
Conclusions
Triblock copolymers with short, charged outer blocks and long, hydrophobic middle blocks with different glass transition temperatures were synthesized through ATRP and the polymers formed micelles in aqueous dispersion. The micelles readily adsorbed in multilayers to cellulose, mica and silica surfaces. The PEHMA copolymer system yielded increasingly higher adhesion with a higher number of layers adsorbed. The trend for the PBMA polymers was the opposite; the higher Tg of the middle block caused decreasing adhesion of the LbL film. LbL films of PEHMA copolymers exhibited stronger adhesion with PEHMA+ as outer layer than with PEHMA− as outer layer. These two systems, PEHMA+/PEHMA− and PBMA+/PBMA− have shown that our basic concept of LbL films assembled from triblock copolymers with relatively long, hydrophobic middle blocks and short, charged outer blocks yielded films with very strong wet adhesion. This adhesive strength was several times higher than the wet adhesion measured in previous studies of PAH/HA, and between collagen and human bone.29,45,46 We are convinced that this type of block copolymer systems grant the ability to control the geometry and adhesive strength in a number of nano- and macroscale applications.Acknowledgements
The Swedish Research Council VR (Vetenskapsrådet) is gratefully acknowledged for funding this research project. Lars Wågberg and Torbjörn Pettersson also acknowledge Wallenberg Wood Science Centre at KTH for funding.References
- R. Duncan, Nat. Rev., 2003, 2, 347–360 CAS.
- R. A. Register, Nat. Nanotechnol., 2013, 8, 618–619 CrossRef CAS PubMed.
- F. H. Sacher, P. A. Rupar and I. Manners, Angew. Chem., Int. Ed., 2012, 51, 7898–7921 CrossRef PubMed.
- F. S. Bates, Annu. Rev. Phys. Chem., 1990, 41, 525–557 CrossRef CAS PubMed.
- S. F. Bates, M. A. Hillmyer, T. P. Lodge, C. M. Bates, K. T. Delaney and G. H. Fredrickson, Science, 2012, 336, 434–440 CrossRef PubMed.
- T. Ueki, R. Usui, Y. Kitazawa, T. P. Lodge and M. Watanabe, Macromolecules, 2015, 48, 5928–5933 CrossRef CAS.
- H. Lin, T. Bengisu and Z. Mourelatos, Dynamic Properties of Styrene-Butadiene Rubber for Automotive Applications, SAE Technical Paper 2009-01-2128, 2009 Search PubMed.
- S. Utsel, A. Carlmark, T. Pettersson, M. Bergström, E. E. Malmström and L. Wågberg, Eur. Polym. J., 2012, 48, 1195–1204 CrossRef CAS.
- T. Gegenhuber, A. H. Gröschel, T. I. Löbling, M. Drechsler, S. Ehlert, S. Förster and H. Schmalz, Macromolecules, 2015, 48, 1767–1776 CrossRef CAS.
- S. Utsel, C. Bruce, T. Pettersson, L. Fogelström, A. Carlmark, E. Malmström and L. Wågberg, ACS Appl. Mater. Interfaces, 2012, 4, 6796–6807 CAS.
- T. Li, Z. Wang, L. Schulte and S. Ndoni, Nanoscale, 2016, 8, 136–140 RSC.
- Q. N. Bui, Y. Li, M.-S. Jang, D. P. Huynh, J. H. Lee and D. S. Lee, Macromolecules, 2015, 48, 4046–4054 CrossRef CAS.
- S. Hassanzadeh, X. Feng, T. Pettersson and M. Hakkarainen, Polymer, 2015, 74, 193–204 CrossRef CAS.
- J. Zhou, M. V. Pishko and J. L. Lutkenhaus, Langmuir, 2014, 30, 5903–5910 CrossRef CAS PubMed.
- X. Liu, B. Chen, X. Li, L. Zhang, Y. Xu, Z. Liu, Z. Cheng and X. Zhu, Nanoscale, 2015, 7, 16399–16416 RSC.
- B. Qi, X. Tong and Y. Zhao, Macromolecules, 2006, 39, 5714–5719 CrossRef CAS.
- G. Decher and J. Schlenoff, Multilayer Thin Films: Sequential Assemlby of Nanocomposite Materials, John Wiley & Sons, 2nd edn, 2012 Search PubMed.
- G. Decher, Science, 1997, 277, 1232–1237 CrossRef CAS.
- H. Lee, R. Mensire, R. E. Cohen and M. F. Rubner, Macromolecules, 2012, 45, 347–355 CrossRef CAS.
- D. T. Haynie, L. Zhang, J. S. Rudra, W. Zhao, Y. Zhong and N. Palath, Biomacromolecules, 2005, 6, 2895–2913 CrossRef CAS PubMed.
- L. J. De Cock, S. De Koker, B. G. De Geest, J. Grooten, C. Vervaet, J. P. Remon, G. B. Sukhorukov and M. N. Antipina, Angew. Chem., Int. Ed., 2010, 49, 6954–6973 CrossRef CAS PubMed.
- P. T. Hammond, Adv. Mater., 2004, 16, 1271–1293 CrossRef CAS.
- K. M. Gattás-Asfura and C. L. Stabler, ACS Appl. Mater. Interfaces, 2013, 5, 9964–9974 Search PubMed.
- O. Köklükaya, F. Carosio, J. C. Grunlan and L. Wågberg, ACS Appl. Mater. Interfaces, 2015, 7, 23750–23759 Search PubMed.
- L. Shao, J.-W. Jeon and J. L. Lutkenhaus, J. Mater. Chem. A, 2014, 2, 14421–14428 CAS.
- M. Hamedi, E. Karabulut, A. Marais, A. Herland, G. Nyström and L. Wågberg, Angew. Chem., Int. Ed., 2013, 52, 12038–12042 CrossRef CAS PubMed.
- S. H. Lee, J. R. Harding, D. S. Liu, J. M. D'Arcy, Y. Shao-Horn and P. T. Hammond, Chem. Mater., 2014, 26, 2579–2585 CrossRef CAS.
- A. Marais, S. Utsel, E. Gustafsson and L. Wågberg, Carbohydr. Polym., 2014, 100, 218–224 CrossRef CAS PubMed.
- T. Pettersson, S. A. Pendergraph, S. Utsel, A. Marais, E. Gustafsson and L. Wågberg, Biomacromolecules, 2014, 15, 4420–4428 CrossRef CAS PubMed.
- A. Marais, S. A. Pendergraph and L. Wågberg, ACS Appl. Mater. Interfaces, 2015, 7, 15143–15147 CAS.
- H. Eslami and S. Zhu, Polym. Chem., 2006, 44, 1914–1925 CrossRef CAS.
- J. H. Lee and S. C. Kim, Polym. J., 1984, 16, 453–459 CrossRef CAS.
- K. Matyaszewski and J. Xia, Chem. Rev., 2001, 101, 2921–2990 CrossRef.
- M. Almgern, K. Edwards and G. Karlsson, Colloids Surf., A, 2000, 174, 3–21 CrossRef.
- R. M. A. Azzam and N. M. Bashara, Ellipsometry and Polarized Light, North-Holland Amsterdam, 1977 Search PubMed.
- P. A. Cuypers, Ph.D., Rijksuniversiteit Limburg, 1976.
- M. Landgren and B. Jönsson, J. Phys. Chem., 1993, 97, 1656–1660 CrossRef CAS.
- W. A. Ducker, T. J. Senden and R. M. Pashley, Nature, 1991, 353, 239–241 CrossRef CAS.
- E. Thormann, T. Pettersson and P. M. Claesson, Rev. Sci. Instrum., 2009, 80, 093701 CrossRef PubMed.
- J. E. Sader, J. M. Chon and P. Mulvaney, Rev. Sci. Instrum., 1999, 70, 3967 CrossRef CAS.
- T. Pettersson, N. Nordgren, M. W. Ruthland and A. Feiler, Rev. Sci. Instrum., 2007, 78, 093702 CrossRef PubMed.
- B. Kronberg, K. Holmberg and B. Lindman, in Surface Chemistry, John Wiley & Sons, Ltd., 2014, ch. 11, pp. 217–225 Search PubMed.
- G. Luengo, J. Pan, M. Heuberger and J. N. Israelachvili, Langmuir, 1998, 14, 3873–3881 CrossRef CAS.
- C. Creton and L. Leibler, J. Polym. Sci., Part B: Polym. Phys., 1996, 34, 545–554 CrossRef CAS.
- J. B. Thomson, J. H. Kindt, B. Drake, H. G. Hansma, D. E. Morse and P. K. Hansma, Nature, 2001, 414, 773–775 CrossRef PubMed.
- G. E. Fantner, T. Hassenkam, J. H. Kindt, J. C. Weaver, H. Birkedal, L. Pechenik, J. A. Cutroni, G. A. G. Cidade, G. D. Stucky, D. E. Morse and H. K. Paul, Nat. Mater., 2005, 4, 612–616 CrossRef CAS PubMed.
Footnote |
| † Electronic supplementary information (ESI) available: Additional characterisation of the synthesised materials. See DOI: 10.1039/c6nr05659h |
| This journal is © The Royal Society of Chemistry 2016 |

