
 Open Access Article
 This Open Access Article is licensed under a Creative Commons Attribution-Non Commercial 3.0 Unported Licence
The Atomic scale structure of liquid metal–electrolyte interfaces
B. M.
Murphy
*ab,
S.
Festersen
b and
O. M.
Magnussen
ab
aInstitute of Experimental and Applied Physics, Kiel University, Leibnizstr. 19, D-24098 Kiel, Germany. E-mail: murphy@physik.uni-kiel.de
bRuprect Haensel Laboratory, Kiel University, Leibnizstr. 19, D-24098 Kiel, Germany
First published on 12th May 2016
Abstract
Electrochemical interfaces between immiscible liquids have lately received renewed interest, both for gaining fundamental insight as well as for applications in nanomaterial synthesis. In this feature article we demonstrate that the atomic scale structure of these previously inaccessible interfaces nowadays can be explored by in situ synchrotron based X-ray scattering techniques. Exemplary studies of a prototypical electrochemical system – a liquid mercury electrode in pure NaCl solution – reveal that the liquid metal is terminated by a well-defined atomic layer. This layering decays on length scales of 0.5 nm into the Hg bulk and displays a potential and temperature dependent behaviour that can be explained by electrocapillary effects and contributions of the electronic charge distribution on the electrode. In similar studies of nanomaterial growth, performed for the electrochemical deposition of PbFBr, a complex nucleation and growth behaviour is found, involving a crystalline precursor layer prior to the 3D crystal growth. Operando X-ray scattering measurements provide detailed data on the processes of nanoscale film formation.
Introduction
From the end of the 1800s on and throughout the last century, liquid metals and in particular the liquid Hg–electrolyte interface have played a key role in the development of the theory of the electrical double layer and electrochemical adsorption.1–5 The liquid Hg electrode represents the earliest example of an electric potential induced variation in an interface property, namely interfacial tension, an effect known as electrocapillarity.3,6,7 Hg electrodes have also been instrumental in key experiments verifying traditional1–3 and modern4,5 theories of the electrochemical double layer and have been used in a wide range of electrochemical studies including electrodeposition,8 charge transfer9 and chemical analytics.9Interest in electrochemical liquid–liquid interfaces has increased again in recent years, coming from various directions. Extensive studies have been performed on interfaces between two immiscible electrolyte solutions (ITIES), focusing on ion and electron transfer.10,19 Simultaneously to these experimental efforts molecular simulation studies have started to address the liquid–liquid interface structure.11–13 Despite the lack of a long-range order, liquid–liquid interfaces exhibit characteristic well-defined structures, which need to be determined for a better understanding of the interface processes. The most important structural property of liquid–liquid interfaces is the density profile across the interface, which is linked with the interface width, the chemical composition of the liquids near the interface (e.g., segregation or depletion of species) and more complex phenomena, such as molecular layering (Fig. 1). Furthermore, as for any fluid interface dynamic effects have to be taken into account, specifically the presence of thermally excited surface waves (“capillary waves”). The presence of these waves results in an average mean-square displacement of the interface σCW2 = kBT/2πγ·ln(qmin/qmax), which is determined by the interface tension γ and the range of wavevectors qmin to qmax, which are given by the length scales where gravitational effects take over and the size of the molecules, respectively.14 It is an open question whether the conventional theoretical treatment of these capillary waves within a continuum model describes the interface roughness down to the molecular scale.10
 | ||
| Fig. 1 Atomic-scale structure and the corresponding density profile of a liquid–liquid interface. | ||
Besides giving fundamental insight these systems are of relevance to biomembrane studies and, in particular, of interest for material synthesis. A large variety of nanomaterials has been prepared via electrochemical and electroless deposition at liquid–liquid interfaces, including metals,15 oxides16,17 chalcogenides,18,19 polymers20,21 and plasmonic materials. Studies of electrodeposition at electrified liquid–liquid interfaces have revealed conditions for inhibiting and enhancing the growth of Au,22,23 Pt and Pd nanoparticles.10,24,25 In a similar way interest in the liquid Hg–electrolyte interface has renewed. As demonstrated by Maldonado and coworkers, deposition at liquid–liquid interfaces even allows the growth of nanostructured crystalline semiconductors such as Ge, Si and GaAs from oxide materials via a simple one-step, room-temperature electrochemical process.26–29
Despite the extensive work in these areas still very little is known about the precise structure of liquid–liquid interfaces and electrochemical processes at these phase boundaries. In contrast to solid–liquid interfaces where detailed atomic-scale data have been obtained by a variety of microscopic, spectroscopic and synchrotron based in situ techniques, accessing atomic scale information on liquid–liquid interfaces remains a major experimental challenge. For a long time to gain an understanding of the structure of liquid–liquid interfaces one had to rely on traditional electrochemical measurements, such as interface tension, capacitance and chronocoulometry. Although these methods can provide some insight, e.g. the surface excesses of adsorbed species, they do not allow determination of the atomic arrangement at the interface. This also holds true for more advanced probes, such as spatial scanning spectroelectrochemistry,30 which likewise reveal only macroscopic properties of the interface. Surface X-ray scattering methods can uniquely deliver such data – even for interfaces between two extended immiscible liquid phases – in situ and operando with an atomic-scale resolution. This was realized as early as in the 1990s;31 however, X-ray investigations of these deeply buried interfaces were hampered by experimental challenges that make these measurements by far more challenging than X-ray scattering studies of solid–liquid electrodes. These difficulties include mechanical stability, high X-ray absorption and the background and the problem that the sample cannot be tilted, requiring specialized X-ray diffractometers. Only in recent years atomic scale structural studies of these elusive interfaces have emerged, made possible by recent developments in synchrotron radiation sources capable of delivering X-ray beams of high photon energies and high brilliance.22,31–36 In the following section, we will discuss the experimental approaches employed for the X-ray scattering of liquid–liquid interfaces and present exemplary studies of the structure of the liquid metal–electrolyte interface that illustrate the level of structural detail obtainable by these measurements.
X-ray scattering from liquid–liquid interfaces
A key technique in the study of fluid interfaces is X-ray reflectivity (XRR) as it can assess the molecular scale interface structure even in the absence of a long-range order. XRR measures the intensity fraction R(qz) of an X-ray beam of wavelength λ impinging onto the interface at angle α and reflected at angle β = α. Here, qz = (4π/λ)·sinα is the magnitude of the scattering vector, which in reflectivity measurements is oriented along the surface normal. The background, resulting from scattering by the bulk liquids, may be measured by offsetting the detector out of the plane of reflection, and subtracting it from the specular signal. Due to the rapid decay of R(qz) with increasing qz the reflected X-ray intensity has to be measured over 7 to 9 orders of magnitude. The reflectivity provides direct access to the total electron density profile across the interface region. For most liquid interfaces R is well described by the master equation,37 which states that R(qz) is the Fresnel reflectivity RF(qz) of a perfectly sharp interface, multiplied by the square of the Fourier transform of the gradient d<ρe(z)>/dz, where <ρe(z)> is the total electron density averaged within the surface plane. For a single component liquid composed of heavier atoms ρe is dominated by the contributions of the ion cores and <ρe(z)> closely resembles the atomic distribution along the surface normal <ρ(z)> (convoluted by the radial electron density distribution function of the atoms). Typically, reflectivity measurements start at angles below the critical angle αc of the total external reflection of the X-ray beam, which is in the range of a few tenths of a degree at most. Under these conditions the beam is spread out over a centimetre of the sample within the reflection plane, requiring an extended planar interface area.Experimental studies of liquid interfaces provide many challenges. One of the biggest challenges is the need for deflecting the X-ray beam down on the (horizontal) interface. For experiments at synchrotron sources this requires dedicated liquid surface diffractometers with deflection optics. Liquid diffractometer designs similar to that by Als-Nielsen and Pershan37–43 achieve this by employing the Bragg reflection of a single crystal that is rotated around the axis of the incoming horizontal X-ray beam. The Bragg-reflected beam moves on the surface of a cone with the tip at the deflecting optics. Therefore both the sample and the detector have to be moved vertically and horizontally to follow the beam, as illustrated schematically in Fig. 2a. An alternative, more recent approach employs a more complex setup, where the incoming X-ray beam is scattered upwards via reflection at a first crystal with a Bragg angle θ1 and then bent downward again using a second crystal with a larger Bragg angle θ2, defining a plane in which the beam is located (Fig. 2b).44–47 The sample is placed at the intersection of this beam plane with a horizontal plane defined by the incoming beam at an angle of incidence α = 0 (“sample plane”). The sample's interface is positioned in the sample plane and the centre of the sample is located at the intersection of the original incoming beam axis (dashed line) with the twice deflected beam. By rotating the crystals around the incoming beam axis the angle of incidence α can be varied from 0 to a maximum angle αmax = 2(θ2 − θ1). A detailed introduction into scattering from liquid interfaces is provided by the excellent book by Pershan and Schlossman.48
 | ||
| Fig. 2 Liquid interface scattering geometry with (a) a single deflecting crystal and (b) a double crystal Bragg deflector. (c) Electrochemical cell for X-ray scattering studies of liquid metal–electrolyte interfaces. The X-ray beam enters and leaves the cell through glass windows and passes through the bulk of the electrolyte solution before and after reflection at the Hg surface. The entire cell is kept in an inert gas atmosphere to keep the electrolyte clean and free of oxygen. | ||
For studies of liquid–liquid interfaces the experimental challenges are even greater. Here the liquids have to be confined in a cell with the lower density liquid stacked on top of the denser one and the X-ray beam has to enter and leave the cell through (glass) windows (Fig. 2c). Because the curvature of the liquid meniscus at the cell wall cannot be avoided, the requirement of a sufficiently large planar interface entails a cell diameter of several centimetres. This leads to huge X-ray absorption losses and a substantially enhanced background scattering from both liquids. In practice, hard X-rays with photon energies above 18 keV are necessary to penetrate the liquid environment. The same problems occur in studies by other surface scattering techniques, such as measurements of the diffuse interface scattering or studies of the in-plane interface structure by scattering under grazing incident angles.
The results obtained in the following studies were obtained at the liquid surface diffractometer at beam line ID-9 of the Advanced Photon Source at Argonne National Laboratory and at the Liquid Interfaces Scattering Apparatus (LISA), installed at beamline P08 of the PETRAIII synchrotron source at DESY. The former uses the single crystal deflection scheme, making waiting times of 15 s necessary after each angle change to allow mechanical excitations of the surface to die down. The LISA diffractometer has pioneered the double crystal design in Bragg reflection geometry and allows measurements of an immobile, mechanically completely decoupled sample, providing high mechanical stability of the liquid interface. Both instruments allow studies at photon energies >20 keV and surface-normal wave vector transfers qz > 2.5 Å−1.
Liquid metal–electrolyte interface
An atomic scale insight into liquid metal electrodes was first gained in studies of the structure of the free liquid surface in contact with a gas phase. The theory predicted that the metal–vapour interface should result in a strong atomic layering in contrast to the monotonic behaviour displayed by dielectric liquids.49 This is due to the sudden decrease in the density of the conduction electrons at the conducting liquid–insulating vapour interface.50,51 Experimentally, this layering behaviour was observed first in XRR measurements at the surface of Hg14,52 and later found for other liquid metals such as gallium,53 indium,44 potassium,54,55 tin,56,57 bismuth56,57 and selected alloys.36,58,59 In the XRR data surface layering manifests as a distinct quasi-Bragg peak which occurs at a momentum transfer position qz ≈ 2/√3r, which is roughly determined by the atomic radius r of the metal. In the case of Hg qz = 2.2 Å−1 (ref. 52) and r = 1.60 Å. In contrast to the layer spacing which was found to be independent of temperature T, the surface roughness increased sharply with increasing T.14 Although an increase in the capillary wave roughness with temperature is expected, Hg is unique in exhibiting an increase greater than the dependence predicted by capillary wave theory.
In a first atomic resolution in situ XRR study of the liquid metal–electrolyte interface, liquid Hg electrodes in a 0.1 M NaF solution were investigated.34 The reflectivity was collected out to qz = 2.5 Å−1 (Fig. 3). The reflected signal at the expected detector angle β = α could be clearly separated from the high background scattering by the Hg and electrolyte bulk liquids (inset), allowing measurements of R(qz) over seven orders of magnitude. Similar as that at the liquid Hg–vapour interface, a quasi-Bragg peak was observed at 2.15 Å−1. This indicates a distinct layering of the Hg atoms near the surface of the liquid Hg electrode, as illustrated in Fig. 1. The intensity of the layering peak varied with the applied potential and had a maximum at 0.3 V vs. the potential of zero charge (pzc), whereas the layering peak's position was potentially independent.
 | ||
| Fig. 3 (a) X-ray reflectivity of the interface between liquid Hg and 0.01 M NaF solution at a potential of 0.28 V relative to the potential of zero charge. In addition to the XRR data the Fresnel reflectivity RF(qz) of an ideal sharp interface and of an interface profile broadened by 1.3 Å roughness and the Hg atomic form factor is shown. The peak at 2.2 Å−1 indicates Hg surface layering. In the inset profiles of the reflected beam at selected qz positions are displayed (measured at φ = 0.05 V). (b) Fresnel normalized reflectivity curve of the XRR data (after ref. 34). | ||
Recalling that R/RF is related to the laterally averaged surface normal electron density profile <ρe(z)>, it is possible to quantitatively model the profile across the interface. The standard description of the liquid metal layering is provided by the distorted crystal model (DCM).52,60,61 In this model <ρe(z)> is described by an infinite stack of atomic layers with an equal spacing d and a Gaussian width  , which has two contributions: σi is an intrinsic width, common to all layers, and σb characterizes the broadening and hence the decay of the layering with the depth nd. For the Hg–NaF interface this model gave layer spacing and decay lengths similar to those found for the Hg vapour interface.29
Very recently, more detailed studies of the atomic-scale Hg–electrolyte interface structure as a function of the temperature and potential were performed that employed a combination of XRR and measurements of the X-ray diffuse scattering (XDS) from the Hg surface.62 XDS gives information on the lateral distribution of the interface roughness, more precisely, the height–height correlation function of the interface.63 Because it is orders of magnitudes lower than the reflectivity, XDS measurements at liquid–liquid interfaces are particularly challenging. A characteristic example of XDS data for the Hg electrolyte interface is shown in Fig. 4a. The shape of the central peak at β = 0.012 rad is dominated by the specular reflectivity; the gradual decay of the intensity at higher and lower reflection angles is determined by the roughness due to surface waves and exhibits a power law dependence as expected from capillary wave theory.64,65 Also visible are the Yonada wings occurring at the position where the scattered beam angle β is equal to the critical angle αc. Quantitative analysis of the XDS measurements showed that (within the experimental errors) the capillary wave roughness was in good agreement with the interface tension γ(ϕ, T) for the Hg electrode in 0.01 M NaF.3,66 Specifically, γ(ϕ, T) extracted from the XDS data exhibited a roughly parabolic potential dependence as expected from the electrocapillary effect (Fig. 4b, top panel).34,36 Because the XDS measurements were limited by the signal-to-background ratio to lateral wave vector transfers qxy ≤ 10−3 Å−1, i.e. capillary waves with wavelengths above 100 nm, the good agreement with a theory employing a continuum model is not surprising. Deviations are only expected upon approaching atomic length scales, as indeed has been reported in XDS studies of the free surface of water.67,68 For liquid–liquid interfaces such studies are currently not possible. Nevertheless, deviations from classic capillary wave theory will influence the interface roughness and thus may contribute to the layer widths in the electron density profiles.69
 | ||
| Fig. 4 Results of combined XRR and XDS measurements of liquid Hg in 0.01 M NaF. (a) Typical example of the diffuse scattering as a function of exit angle β, obtained at qz = 0.9 Å−1, the Yonada wing is seen at 0.0025 rad. (b) Extracted electron density profiles as a function of the potential (for clarity the curves are offset by 1). The potential dependent (c) interfacial tension, (d) intrinsic width, common to all layers, and (e) density of the first Hg layer (relative to the density of bulk Hg) obtained from a quantitative analysis of the X-ray scattering data at 4 °C. The blue dashed line in (c) corresponds to the electrocapillary curve reported in ref. 66. | ||
To obtain better insight into the interface structure on nanometer length scales the capillary wave contribution was removed and the resulting total electron density profile was deconvoluted by the electron density distribution within the Hg atoms70 (i.e. the Fourier transform of the Hg atomic form factor). This procedure leads to profiles that largely reflect the atomic distribution of the Hg atoms in the surface normal direction (<ρ(z)>), which more clearly reveal the substantial changes in the interface structure with the potential and temperature (Fig. 4c). The results favour a model where the structural parameters of the Hg surface layer significantly differ from those of the subsequent layers underneath. In particular, the spacing between the topmost and the second Hg layer is smaller than the average layer spacing d. This resembles the tendency of surface layers on crystalline metal surfaces to undergo reconstruction or inward relaxation and is also supported by theoretical work on liquid metal surfaces.70 At 4° C the layer spacing d and the layer density are close to those of the (111) planes in crystalline Hg (d(111) = 2.62 Å) and the intrinsic width of the Hg surface layer is only 0.2 to 0.4 Å. The observations indicate that the surface of the liquid metal electrode is well-defined and close-packed on the atomic scale, as has been assumed in previous theoretical studies.71
Based on a detailed analysis of the potential and temperature dependence, several characteristic effects were found:69 first, a temperature dependent roughness anomaly known from the Hg–air interface14 also persisted at the Hg–electrolyte interface. Additionally, the layering period substantially increased with temperature. This increase was a factor of four larger than the Hg thermal expansion coefficient and may be caused by the thermal broadening of the atomic layers. Secondly, the interface is found to slightly broaden towards the electrolyte side as the potential becomes more negative (Fig. 4c). This effect may be related to the contribution of the conduction electrons to the X-ray scattering rather than to the distribution of the Hg ion cores. According to the Schmickler–Henderson theory of the Helmholtz capacitance, the conduction electron distribution at the interface is polarized by the strong electric field of the electrochemical double layer.72 The quantitative predictions for the magnitude of this effect at Hg electrodes are in good agreement with the changes observed in the XRR studies.
In addition to these, studies of Hg electrodes in non-specifically adsorbing electrolytes and XRR measurements of liquid Hg in highly concentrated solutions containing chemisorbing ions were performed by Duval et al.35 In these studies the Hg layering peak was weaker and depended much more strongly on the potential than that found in NaF solution, indicating a strong influence of the ion presence on Hg layering. Furthermore, a pronounced second peak at qz values around 1.5 Å−1 was observed, associated with an additional layer on the Hg surface. Surface excesses derived from the XRR data deviated strongly (even in sign) from those obtained by traditional electrochemical measurements. This was assigned to the contribution of a partial layer of Hg atoms at the interface that varied its composition as a function of the voltage, nature of the ions and the chemical environment. However, it is not clear whether these results may in part be affected by the unusual electrochemical conditions employed in these measurements. More detailed studies employing different (in particular lower) concentrations and a supporting electrolyte seem necessary to verify this behaviour.
Growth at liquid metal electrolyte interfaces
Exciting developments in material synthesis have recently renewed interest in immiscible liquid–liquid interfaces as a template for growth.15 Unlike solid interfaces, where strain and stress, heterogeneities, and defects strongly influence growth processes, fluid systems provide soft, defect- and stress-free interfaces. The growth process in liquid phases profits from the high mobility of atoms, molecules, and deposited particles as well as the self-assembly of ordered particle arrays at the interface.Atomic scale studies of electrochemical induced nucleation and growth at a liquid–liquid interface were performed by in situ X-ray scattering methods for liquid Hg electrodes in electrolyte solutions containing Pb2+, F−, and Br− ions.36 In this electrolyte Pb amalgamation occurs at negative potentials of −0.70 VHg/Hg2SO4 (see cyclic voltammogram in Fig. 5b). XRR studies in this regime (Fig. 5a) are identical to those in pure NaF solution, indicating the characteristic surface-layered structure of a clean Hg surface. Apparently, the deposited Pb atoms are dissolved in the Hg bulk and do not exhibit a tendency towards surface aggregation. Upon inducing the release of Pb2+ by stepping the potential to positive values of the amalgamation potential substantial changes in the reflectivity R(qz) emerge. In particular, pronounced oscillations are found, heralding the formation of an intriguing interface structure with a well-defined 7.6 Å-thick adlayer. In addition, the observation of Bragg reflections indicates the nucleation and growth of structurally related 3D crystallites on top of this adlayer (Fig. 5c), which are identified as PbFBr, preferentially aligned with the  axis along the interface normal. Quantitative analysis of the XRR data shows the adlayer to consist of a stack of five ionic layers, forming a single-unit-cell-thick crystalline PbFBr precursor film with (001) orientation. Because of the structural rigidity of this ultrathin crystalline layer, the capillary waves of the interface are substantially damped, resulting in a decrease in the interface roughness and a concomitant increase in intensity at higher qz.
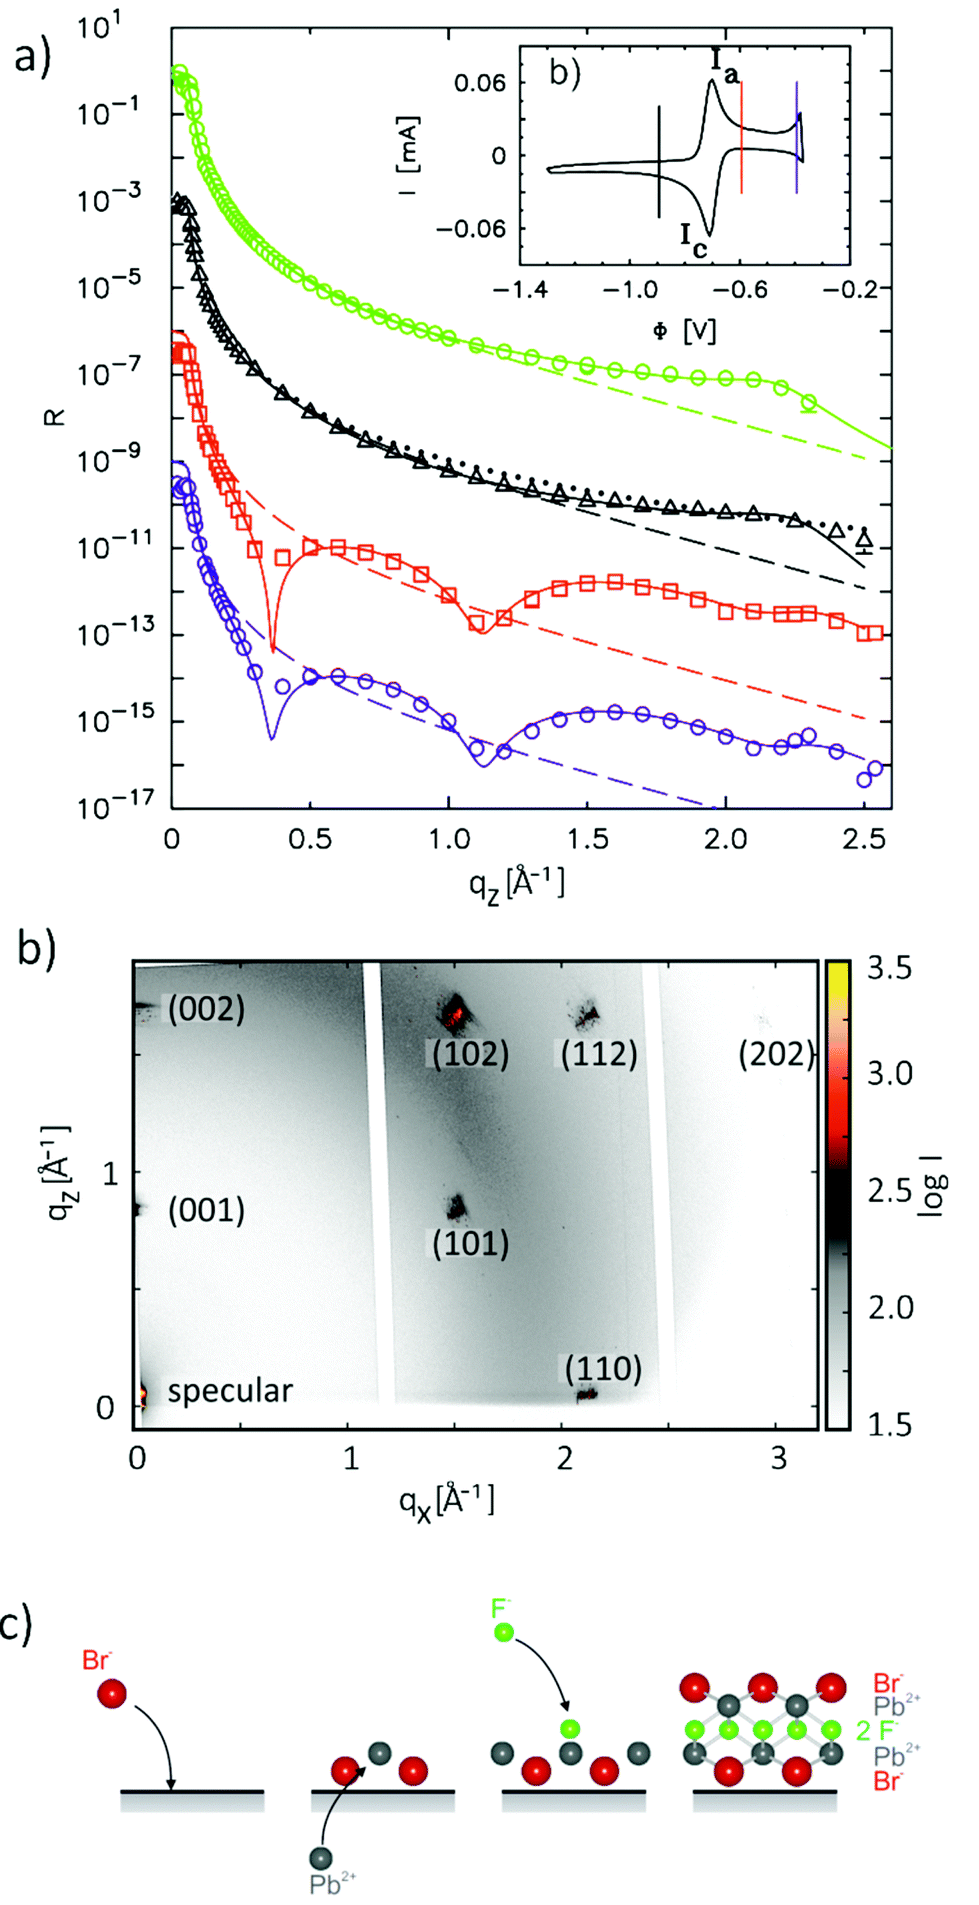 | ||
| Fig. 5 In situ X-ray scattering studies of nucleation and growth on liquid Hg in 0.01 M NaF + 0.01 M NaBr + 0.25 mM PbBr2 solution. (a) Measured XRR curves at −0.90 V (black triangles), −0.60 V (red squares), and −0.40 V (blue circles) as well as an XRR curve measured at the Hg −0.01 M NaF interface at −0.90 V (green circles). For clarity, the XRR curves are offset by a factor of 10−3. Solid lines correspond to the best fits by the models described in the text, the dashed lines to the reflectivity of an interface with a Gaussian roughness of σ = 1.00 Å. (b) Corresponding cyclic voltammogram (scan rate 5 mV s−1), with vertical lines marking the potentials of the XRR measurements. (c) Intensity maps in the qy–qz plane measured at −0.60 V α = 0.135°, showing Bragg reflections from a thin film of crystalline PbBrF on the Hg surface. (d) Schematic illustration of the formation of the PbFBr precursor layer (after ref. 36). | ||
The surprising formation of a film of defined thickness, consisting of a full unit cell with five atomic layers of different ionic compositions, can be explained by the combination of electrostatic and short range chemical interactions (Fig. 5c). In the deamalgamation regime the Hg surface is covered by an adlayer of adsorbed Br− anions, on which the released Pb2+ cations coadsorb. For electrostatic reasons the subsequent adsorption of oppositely charged ionic layers is required until full charge neutrality is achieved. The latter occurs only upon completing a full unit cell, because the charge density per unit area of the Pb2+ and F− layers is twice that of the Br− layers. The formation of simpler compounds consisting of fewer layers, e.g., PbBr2, is energetically less favourable due to the higher Gibbs enthalpy as compared to PbFBr.73 The precursor layer formation resembles the formation of mixed salt-like layers found in underpotential deposition processes on solid electrode surfaces; however, the adlayers in that case only consisted of anion/cation bilayers.
The 3D crystals of PbFBr deposited on top of the precursor film are likewise (001)-oriented, suggesting that the initial layer acts as a template for subsequent quasiepitaxial growth. The potential-dependent kinetics of this growth process and of the dissolution of the PbFBr deposit were monitored in recent potential step experiments. Using a 2D X-ray detector the specular reflectivity and the PbFBr Bragg peaks can be followed simultaneously in real time (see Fig. 5c). Examples of such measurements, showing the changes in reflectivity at qz = 0.75 Å−1 and in the intensity of the PbFBr (001) peak are presented in Fig. 6, together with the parallel recorded current density transients. Control experiments where the potential is stepped to −0.80 V (i.e. to potentials negative of the deamalgamation range) show no change in the reflectivity and no Bragg peaks. For jumps to −0.8 V the formation of the precursor layer occurs on a very short time scale, as indicated by the increase in the intensity of the specular component within 5 s. Subsequently, the reflectivity decreases linearly, to about two thirds of the initial intensity over the next 600 s. This process is accompanied by the appearance of the PbFBr Bragg peaks, which linearly increase in intensity over the same time period. Based on these observations, the PbFBr growth at this potential proceeds slowly but continuously and at an approximately constant rate. In contrast, at more positive potentials the Bragg peak intensity saturates after an initial rise, indicating the self-limiting growth of a PbFBr film with a (potential-dependent) thickness of several ten nanometers. This suggests that the fast growth at higher potentials results in more dense films that subsequently block the vertical transport of ions and thus further film growth. In all experiments the PbFBr deposit rapidly dissolves after stepping the potential back into the potential regime of amalgamation and the specular reflectivity returns to the intensity characteristic for the clean Hg electrolyte interface.
 | ||
| Fig. 6 Kinetic studies of PbFBr growth and dissolution on Hg in 0.01 M NaF + 0.01 M NaBr + 0.25 mM PbBr2 by operando X-ray scattering. Shown is the time dependent behaviour of the specular XRR signal at qz = 0.9 Å−1, (blue), of the PbFBr (001) Bragg peak (green) and of the simultaneously measured electrochemical current density (red) at four different potentials (after ref. 36). | ||
Conclusions
In this overview review article we demonstrated that the atomic-scale structure of liquid–liquid interfaces – one of the last frontiers in interface science – is now accessible to experimental studies. Key to this are surface scattering techniques employing X-ray radiation of high photon energy and utmost brilliance, available at modern synchrotron radiation sources, and dedicated instruments for studies of fluid interfaces. These methods have enabled real time in situ and operando investigations of these fascinating systems. Even the results on the small number of studies that have been studied up to now reveal that liquid–liquid electrochemical interfaces exhibit by far more complex phenomena than previously anticipated. For the Hg–electrolyte interface discussed in this work the structural data indicate an atomically sharp interface where the liquid electrode is terminated by a well-defined close-packed layer of Hg atoms. However, the Hg surface structure depends pronouncedly on the potential, temperature and chemical environment. Furthermore, the first studies of adsorption and deposition at this interface show surprising complexity, such as the formation of ultrathin crystalline layers between the two liquid phases. Clarifying whether such behaviour occurs also in other adsorbate systems and extending atomic-scale studies to other electrochemical liquid–liquid systems of current interest remain a task for future X-ray scattering studies.Acknowledgements
We thank the BMBF (project 05KS7FK3, 05K10FK2 and 05K130FK2) and the Deutsche Forschungsgemeinschaft via Ma 1618/18 for funding. We are very grateful for the excellent support provided by Oliver Seeck, Uta Ruett and the team at beamline P08 of PETRA III, DESY and Ivan Kuzmenko and his team at 9ID of the APS. We acknowledge access provided for both facilities. We also thank Benjamin Runge for fruitful discussions.Notes and references
- H. Helmholtz, Ann. Phys., 1879, 243, 337 CrossRef.
- M. Gouy, J. Phys. Theor. Appl., 1910, 9, 457 CrossRef.
- D. L. Chapman, The London, Edinburgh, and Dublin philosophical magazine and journal of science, 1913, vol. 25, p. 475 Search PubMed.
- G. T. Barnes and I. R. Gentle, in Interface Science, Oxford University Press, Oxford, 1st edn, 2005 Search PubMed.
- C. Buess-Herman, in Trends in interfacial electrochemistry, ed. A. F. Silva and D. Reidel, Dordrecht, 1986, pp. 205–253 Search PubMed.
- G. Lippmann, Ann. Phys., 1873, 225, 546 CrossRef.
- D. C. Grahame, Chem. Rev., 1947, 41, 441 CrossRef CAS PubMed.
- J. E. B. Randles, Discus. Faraday Soc., 1947, 1, 11 RSC.
- R. A. Marcus, Annu. Rev. Phys. Chem., 1964, 15, 155 CrossRef CAS.
- R. A. W. Dryfe, Adv. Chem. Phys., 2009, 141, 153 CrossRef CAS.
- K. Zhurov, E. J. Dickinson and R. G. Compton, J. Phys. Chem. B, 2011, 115, 6909 CrossRef CAS PubMed.
- N. Laanait, M. Mihaylov, B. Hou, H. Yu, P. Vanýsek, M. Meron, B. Lin, I. Benjamin and M. L. Schlossman, Proc. Natl. Acad. Sci. U. S. A., 2012, 109, 20326 CrossRef CAS PubMed.
- Z. Samec, Electrochim. Acta, 2012, 84, 21 CrossRef CAS.
- E. DiMasi, H. Tostmann, B. M. Ocko, P. S. Pershan and M. Deutsch, Phys. Rev. B: Condens. Matter, 1998, 58, 13419 CrossRef.
- R. Krishnaswamy and A. K. Sood, J. Mater. Chem., 2010, 20, 3539 RSC.
- S. N. Mlondo, P. J. Thomas and P. O'Brien, J. Am. Chem. Soc., 2009, 131, 6072 CrossRef CAS PubMed.
- U. K. Gautam, M. Ghosh and C. N. R. Rao, Langmuir, 2004, 20, 10775 CrossRef CAS PubMed.
- P. J. Thomas, E. Mbufu and P. O'Brien, Chem. Commun., 2013, 49, 118 RSC.
- D. Fan, P. J. Thomas and P. O'Brien, J. Am. Chem. Soc., 2008, 130, 10892 CrossRef CAS PubMed.
- N. Nuraje, K. Su, N. l. Yang and H. Matsui, ACS Nano, 2008, 2, 502 CrossRef CAS PubMed.
- C. N. R. Rao and K. P. Kalyanikutty, Acc. Chem. Res., 2008, 41, 489 CrossRef CAS PubMed.
- Y. Grunder, H. L. T. Ho, J. F. W. Mosselmans, S. L. M. Schroeder and R. A. W. Dryfe, Phys. Chem. Chem. Phys., 2011, 13, 15681 RSC.
- A. Uehara, S. G. Booth, S. Y. Chang, S. L. Schroeder, T. Imai, T. Hashimoto, J. F. Mosselmans and R. A. Dryfe, J. Am. Chem. Soc., 2015, 137, 15135 CrossRef CAS PubMed.
- M. Platt, R. A. W. Dryfe and E. P. L. Roberts, Electrochim. Acta, 2004, 49, 3937 CrossRef CAS.
- S. G. Booth and R. A. Dryfe, J. Phys. Chem. C, 2015, 119, 23295 CAS.
- A. I. Carim, S. M. Collins, J. M. Foley and S. Maldonado, J. Am. Chem. Soc., 2011, 133, 13292 CrossRef CAS PubMed.
- J. Gu, S. M. Collins, A. I. Carim, X. Hao, B. M. Bartlett and S. Maldonado, Nano Lett., 2012, 12, 4617 CrossRef CAS PubMed.
- E. Fahrenkrug, J. Gu and S. Maldonado, J. Am. Chem. Soc., 2013, 135, 330 CrossRef CAS PubMed.
- E. Fahrenkrug, J. Gu, S. Jeon, P. A. Veneman, R. S. Goldman and S. Maldonado, Nano Lett., 2014, 14, 847 CrossRef CAS PubMed.
- D. Izquierdo, A. Martinez, A. Heras, J. Lopez-Palacios, V. Ruiz, R. A. Dryfe and A. Colina, Anal. Chem., 2012, 84, 5723 CrossRef CAS PubMed.
- L. Bosio, R. Cortès, A. Defrain and M. Oumedzine, J. Non-Cryst. Solids, 1984, 61&62, 697 Search PubMed.
- G. M. Luo, S. Malkova, J. Yoon, D. G. Schultz, B. H. Lin, M. Meron, I. Benjamin, P. Vanysek and M. L. Schlossman, Science, 2006, 311, 216 CrossRef CAS PubMed.
- B. M. Murphy, M. Greve, B. Runge, C. T. Koops, A. Elsen, J. Stettner, O. H. Seeck and O. M. Magnussen, J. Synchrotron Radiat., 2014, 21, 45 CrossRef CAS PubMed.
- A. Elsen, B. M. Murphy, B. M. Ocko, L. Tamam, M. Deutsch, I. Kuzmenko and O. M. Magnussen, Phys. Rev. Lett., 2010, 104 Search PubMed.
- J. F. L. Duval, S. Bera, L. J. Michot, J. Daillant, L. Belloni, O. Konovalov and D. Pontoni, Phys. Rev. Lett., 2012, 108, 206102 CrossRef PubMed.
- A. Elsen, S. Festersen, B. Runge, C. T. Koops, B. M. Ocko, M. Deutsch, O. H. Seeck, B. M. Murphy and O. M. Magnussen, Proc. Natl. Acad. Sci. U. S. A., 2013, 110, 6663 CrossRef CAS PubMed.
- P. S. Pershan and J. Als-Nielsen, Phys. Rev. Lett., 1984, 52, 759 CrossRef CAS.
- P. S. Pershan, A. Braslau, A. H. Weiss and J. Als-Nielsen, Phys. Rev. A, 1987, 35, 4800 CrossRef CAS.
- J. Als-Nielsen, Physica B+C, 1984, 126, 145 CrossRef CAS.
- M. L. Schlossman, D. Synal, Y. M. Guan, M. Meron, G. Shea-McCarthy, Z. Q. Huang, A. Acero, S. M. Williams, S. A. Rice and P. J. Viccaro, Rev. Sci. Instrum., 1997, 68, 4372 CrossRef CAS.
- B. H. Lin, M. Meron, J. Gebhardt, T. Graber, M. L. Schlossman and P. J. Viccaro, Physica B, 2003, 336, 75 CrossRef CAS.
- D. M. Smilgies, N. Boudet, B. Struth and O. Konovalov, J. Synchrotron Radiat., 2005, 12, 329 CrossRef CAS PubMed.
- Y. F. Yano, T. Uruga, H. Tanida, H. Toyokawa, Y. Terada, M. Takagaki and H. Yamada, Eur. Phys. J.: Spec. Top., 2009, 167, 101 CrossRef.
- H. Reichert, V. Honkimaki, A. Snigirev, S. Engemann and H. Dosch, Physica B, 2003, 336, 46 CrossRef CAS.
- B. M. Murphy, M. Greve, B. Runge, C. T. Koops, A. Elsen, J. Stettner, O. H. Seeck and O. M. Magnussen, AIP Conf. Proc., 2010, 155–158 Search PubMed.
- T. Arnold, C. Nicklin, J. Rawle, J. Sutter, T. Bates, B. Nutter, G. McIntyre and M. Burt, J. Synchrotron Radiat., 2012, 19, 408 CrossRef CAS PubMed.
- B. M. Murphy, M. Greve, B. Runge, C. T. Koops, A. Elsen, J. Stettner, O. H. Seeck and O. M. Magnussen, A new Diffractometer for Studies of Liquid–Liquid Interfaces, 2010 Search PubMed.
- P. S. Pershan and M. L. Schlossman, in Liquid surfaces and interfaces, Cambride University Press, Cambridge, 2012 Search PubMed.
- M. P. D'Evelyn and S. A. Rice, J. Chem. Phys., 1983, 78, 5081 CrossRef.
- S. A. Rice, Proc. Natl. Acad. Sci. U. S. A., 1987, 84, 4709 CrossRef CAS.
- S. A. Rice, Mol. Simul., 2003, 29, 593 CrossRef CAS.
- O. M. Magnussen, B. M. Ocko, M. J. Regan, K. Penanen, P. S. Pershan and M. Deutsch, Phys. Rev. Lett., 1995, 74, 4444 CrossRef CAS PubMed.
- M. J. Regan, E. H. Kawamoto, S. Lee, P. S. Pershan, N. Maskil, M. Deutsch, O. M. Magnussen, B. M. Ocko and L. E. Berman, Phys. Rev. Lett., 1995, 75, 2498 CrossRef CAS PubMed.
- H. Tostmann, E. DiMasi, P. S. Pershan, B. M. Ocko, O. G. Shpyrko and M. Deutsch, Phys. Rev. B: Condens. Matter, 1999, 59, 783 CrossRef CAS.
- O. Shpyrko, P. Huber, A. Grigoriev, P. Pershan, B. Ocko, H. Tostmann and M. Deutsch, Phys. Rev. B: Condens. Matter, 2003, 67, 115405 CrossRef.
- O. G. Shpyrko, A. Y. Grigoriev, C. Steimer, P. S. Pershan, B. H. Lin, M. Meron, T. Graber, J. Gerbhardt, B. Ocko and M. Deutsch, Phys. Rev. B: Condens. Matter, 2004, 70, 224206 CrossRef.
- P. S. Pershan, S. E. Stoltz, O. G. Shpyrko, M. Deutsch, V. S. Balagurusamy, M. Meron, B. Lin and R. Streitel, Phys. Rev. B: Condens. Matter, 2009, 79, 115417 CrossRef.
- M. J. Regan, P. S. Pershan, O. M. Magnussen, B. M. Ocko, M. Deutsch and L. E. Berman, Phys. Rev. B: Condens. Matter, 1997, 55, 15874 CrossRef CAS.
- N. Lei, Z. Huang and S. A. Rice, J. Chem. Phys., 1997, 107, 4051 CrossRef CAS.
- P. S. Pershan and J. Alsnielsen, Phys. Rev. Lett., 1984, 52, 759 CrossRef CAS.
- E. Dimasi, H. Tostmann, B. M. Ocko, P. S. Pershan and M. Deutsch, Phys. Rev. B: Condens. Matter, 1998, 58, R13419 CrossRef CAS.
- Runge, Murphy, and magnussen, PRB, 2016 Search PubMed.
- S. K. Sinha, E. B. Sirota, S. Garoff and H. B. Stanley, Phys. Rev. B: Condens. Matter, 1988, 38, 2297 CrossRef.
- A. Braslau, P. S. Pershan, G. Swislow, B. M. Ocko and J. Als-Nielsen, Phys. Rev. A, 1988, 38, 2457 CrossRef.
- M. Tolan, G. Vacca, J. Wang, S. K. Sinha, Z. Li, M. H. Rafailovich, J. Sokolov, A. Gibaud, H. Lorenz and J. P. Kotthaus, Physica B, 1996, 221, 53 CrossRef CAS.
- N. H. Cuong, C. V. d'Alkaine, A. Jenard and H. D. Hurwitz, J. Electroanal. Chem. Interfacial Electrochem., 1974, 51, 377 CrossRef.
- C. Fradin, A. Braslau, D. Luzet, D. Smilgies, M. Alba, N. Boudet, K. Mecke and J. Daillant, Nature, 2000, 403, 871 CrossRef PubMed.
- S. Mora, J. Daillant, K. Mecke, D. Luzet, A. Braslau, M. Alba and B. Struth, Phys. Rev. Lett., 2003, 90, 216101 CrossRef CAS PubMed.
- B. Runge, S. Festersen, C. T. Koops, A. Elsen, M. Deutsch, B. M. Ocko, O. H. Seeck, B. M. Murphy and O. M. Magnussen, Phys. Rev. B, 201693165408 Search PubMed.
- D. S. Chekmarev, M. Zhao and S. A. Rice, Phys. Rev. E: Stat., Nonlinear, Soft Matter Phys., 1999, 59, 479 CrossRef CAS.
- J. Böcker, R. R. Nazmutdinov, E. Spohr and K. Heinzinger, Surf. Sci., 1995, 335, 372 CrossRef.
- D. Henderson and W. Schmickler, J. Chem. Phys., 1985, 82, 2825 CrossRef CAS.
- D. D. Wagman, W. H. Evans, V. B. Parker, R. H. Schumm and I. Halow, The NBS tables of chemical thermodynamic properties. Selected values for inorganic and C1 and C2 organic substances in SI units, DTIC Document, 1982 Search PubMed.
| This journal is © The Royal Society of Chemistry 2016 |