 Open Access Article
Creative Commons Attribution 3.0 Unported Licence
Autonomous movement induced in chemically powered active soft-oxometalates using dithionite as fuel†
Apabrita
Mallick
,
Dipti
Lai
and
Soumyajit
Roy
*
EFAML, Materials Science Centre, Department of Chemistry, Indian Institute of Science Education and Research, Kolkata-741246, India. E-mail: s.roy@iiserkol.ac.in
First published on 18th August 2015
Abstract
Synthesis of autonomously moving nano or micromotors is an immediate challenge in current nanoscience and nanotechnology. In this work we report a system based on soft-oxometalates (SOMs) which is very easy to synthesize and moves autonomously in response to chemical stimuli like that of a reducing agent-dithionite. The redox active MoVI sites of SOMs are used for oxidizing dithionite to generate SO2 to propel the micromotors. We explain this motion qualitatively and also show how surface interaction and adsorption isotherm of the evolved gas influence the power conversion efficiency of these micromotors.
Introduction
Synthesis of autonomously moving soft and active matter1 is an immediate challenge for modelling biological phenomenon. In recent times, although moving matter has been designed,2–5 its synthesis is tedious. Here we report a system based on soft-oxometalates6,7 (SOMs) which is very easy to synthesize and is used as a model system in our study. We now explore the current status in the field of micromotors.The first well known synthetic motor8 was prepared by Whitesides et al. in 2002 which used Pt catalyst to drive millimetre scale plastic disks. Synthetic motors of micrometer scale were prepared in 2004–2005.9,10 These micromotors were bimetallic rods of Pt–Au9 and Ni–Au10 of length 2–3 μm which catalytically decomposed H2O2 to H2O and O2 and moved with a speed of ∼10 μm s−1. The movement of synthetic micromotors is controlled by artificial stimuli such as chemical fuel,11–15 magnetic field,16–18 electric field,19–21 ultrasonic sound22 or light.23–25 Thus the operation of micromotors is dependent on the source of energy consumption and accordingly they can be classified as bubble propelled5,11,12 micromotors, self electrophoretically propelled13–15 micromotors, magnetically driven16–18 micromotors, electrically driven19–21 micromotors, ultrasound propelled22a,b micromotors and light driven23–25 micromotors. The movement26 of active motors can be in the form of translation,9 rotation,10 delivery27 or collective behaviour.24 Chemically powered micromotors12 are mainly propelled due to the gas generated by the surface catalytic decomposition9 of the fuel. Chemically propelled micromotors can be either bubble propelled11 or self electrophoretically5 propelled. The requirement of chemical fuels can be obviated by using micromotors which use physical sources for their energy requirement like magnetic micromotors16 driven in a magnetic field that convert their rotary motion to axial translation. Biocompatible fuel free micromotors can also be obtained from ultrasonic acoustic waves.22 In the low Reynold's number regime, Brownian motion plays the dominating role and thus the autonomous movement of micro objects is restricted.26 At microscale, interfacial forces dominate over inertia28 which is exploited to devise micromotors.
Soft-charged metal oxide based structures, the soft-oxometalates6 (SOMs), with metals in a high oxidation state provide us with an opportunity to induce autonomous movement in these SOMs. SOMs have also been moved using optical forces before by us.23 The redox chemistry of SOM provides a possibility for generating a gas by the oxidation of a reductant which can act as a fuel and in turn propel the SOMs. Here we exploit this possibility. More precisely, we take the step of inducing autonomous movement in heptamolybdate SOMs with the help of the chemical fuel dithionite. We ask whether it is possible to exploit the redox active MoVI sites on SOMs to generate SO2 gas by oxidation of the reductant dithionite. We address this question here.
Results and discussion
The chemistry of inducing motion in SOMs
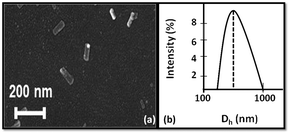
For our study, we choose dithionite as the fuel and metal oxide (oxomolybdate) as the reacting surface. We note that the SOMs are rod shaped in nature with their size in agreement with DLS and SEM results (see Fig. 1).The length of SOM rods from SEM is around 200 nm. From DLS the hydrodynamic diameter (Dh) is around 500 nm which is due to the tumbling motion of the rods that effectively gives rise to a sphere of 500 nm diameter.
The aqueous solution of sodium dithionite is unstable29 and in aerobic and acidic conditions (under the conditions of autonomous movement shown by the SOMs) it generates sulphur and sulphur dioxide. So we used freshly prepared solution of sodium dithionite for our experiment.
When an aqueous solution of sodium dithionite (Na2S2O4) is added to the dispersion of mildly acidic isopolyacids of SOMs, dithionite gets oxidised to SO2 and MoVI centres of SOM get reduced to MoV centres which ultimately generate molybdenum blue type SOMs and propels the SOMs. Thus propulsion of SOMs is the result of a redox reaction which gives rise to a gaseous oxidized product SO2 and a reduced molybdenum blue SOM which is blue in colour due to IVCT type transition (MoV → MoVI). The SO2 produced by the reaction of dithionite with heptamolybdate remains in the solution for a considerable amount of time which in turn propels these active SOM motors. So, the lifetime of active SOMs is also quite significant, though not infinite. In this reaction MoVI oxidises30 dithionite to SO2 in accordance with the following reaction (shown schematically):
| MoVI7O24 + S2O42− → molybdenum blue + 2SO2(g) |
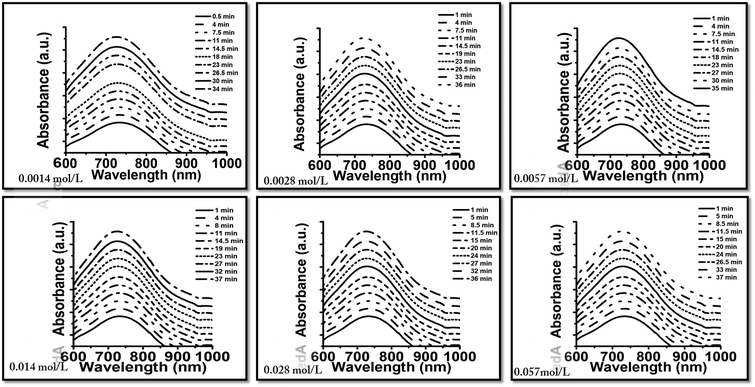
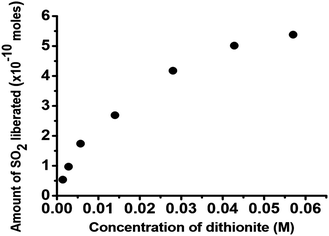
This redox process in fact causes the motion of the SOMs oxidizing the dithionite and reducing the SOMs. The propulsion of SOMs due to the oxidation of SO2 is coupled with the reduction of SOMs and thus the emergence of MoV → MoVI intervalence charge transfer (IVCT) in the molybdenum blue SOMs; the extent of SO2 evolution can hence be monitored by electronic absorption spectroscopy (Fig. 2). The extent of SO2 produced in the above reaction is coupled with the generation of blue SOMs which is signalled by the intensity of the MoVI → MoV IVCT band in blue SOMs. In this way we are able to find the extent of generation of SO2 from electronic absorption spectroscopy and we plot the amount of SO2 liberated against the loading variation of dithionite used for propelling the SOM micromotors (Fig. 3).
On the other hand motion is induced in SOMs (Fig. 4 and ESI†) due to the movement of the osmotic boundary between the reacting interface and the moving particle. To understand the effect of the fuel dithionite qualitatively, we load sodium dithionite of varying concentrations in the system. To analyse the individual movement of SOM particles we calculate the velocity of SOM at different concentrations of dithionite (Fig. 5(a)) and also determine the trajectories using ImageJ and TrackPy31 (Fig. 5(b)–(g)). The details of analysis are given in the experimental section.
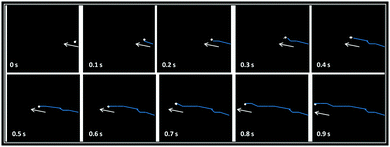 | ||
| Fig. 4 Time lapse images of moving SOM in 0.014 mol L−1 sodium dithionite. The direction of motion is shown by the arrow and the blue lines indicate the trace lines. | ||
The movement of SOMs in aqueous dispersion is entirely Brownian in nature. On addition of the fuel, reaction starts at the surface of the SOM and it shows directed autonomous translation. With the increase in the concentration of the fuel, the velocity of SOMs increases initially up to 52 body lengths s−1 (for 0.014 mol L−1 of sodium dithionite). But after that the velocity decreases even if the dithionite concentration is increased. At 0.0574 mol L−1 dithionite concentration the motion of SOMs is again Brownian in nature. Above 0.0574 mol L−1 we cannot track the movement of active SOMs because the colour of the dispersion becomes too dark (blue) for microscopic imaging. We demonstrate this graph of velocity of active SOMs and the trajectories in Fig. 5.
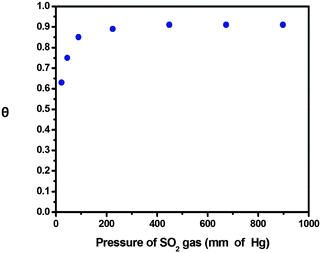
As we increase the fuel concentration, more and more sodium dithionite reacts with SOMs and more SO2 is produced. The thrust produced by the evolved gas on SOM increases. Consequently, SOM travels with increasing velocity till it reaches a tipping point. When more gas is evolved, more SO2 molecules get adsorbed on the surface of the SOM. Thus the unreacted SOM interface now interacts with a less amount of fuel and we observe a decrease in the velocity of SOMs. For sodium dithionite the tipping point is observed at 0.014 mol L−1 concentration. Beyond this concentration of 0.014 mol L−1 of sodium dithionite, we believe that the SOM surface sites are all saturated and this creates an additional viscous drag and consequently the velocity of SOMs drops. With further reaction, the osmotic boundary reaches equilibrium and there is no asymmetry between the osmotic boundary and the SOM surface. Thus the slip velocity decreases to near zero. Since all the reactions were carried out at a uniform temperature we can plot adsorption isotherm by calculating the area of SOM occupied by adsorbed SO2 where θ is the fraction of the surface that is covered with gaseous molecules and p is the pressure of SO2 gas.
From the graph (Fig. 6) it is evident that the fraction of occupied sites on active SOM surface increases with the increasing pressure of SO2. On increasing the concentration of dithionite, more SO2 gas is produced and the pressure of SO2 also increases as pressure is directly proportional to concentration. When all the active sites on SOM are occupied by the SO2 gas θ reaches a saturation point.
We can describe the motion of SOMs using osmophoresis. In this model, for the reaction rate dominated regime,32 the average velocity of the particles is given by
| Concentration of sodium dithionite (mol L−1) | α eff (nm2) |
|---|---|
| 0.0014 | 3.46 |
| 0.0028 | 2.78 |
| 0.0057 | 2.31 |
| 0.0140 | 1.54 |
| 0.0280 | 0.46 |
| 0.0430 | 0.12 |
where Pmech is the mechanical energy output and is given by Pmech = Fdragν = fν2 and Pchem is the chemical energy input and is given by Pchem = nΔrG.
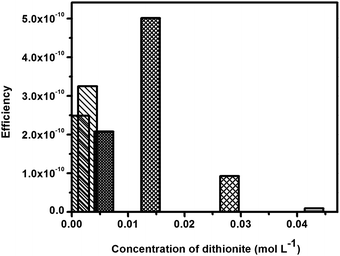
Here Fdrag is the drag force on the cylindrical SOM, f is the drag coefficient, μ is the dynamic viscosity of water, L is the length of SOM, R is its radius, ν is the motor speed, n is the gas evolution rate in units of mol per (SOM s) and ΔrG is the Gibbs free energy of the decomposition of dithionite. We calculate the values of Pmech and Pchem and find the energy efficiency of SOM micromotors (Table 2).
| Concentration of sodium dithionite (mol L−1) | P mech (Joules) | P chem (Joules) | Efficiency (η) |
|---|---|---|---|
| 0.0014 | 2.14 × 10⁻²² | 8.58 × 10⁻¹³ | 2.49 × 10⁻¹⁰ |
| 0.0028 | 5.56 × 10⁻²² | 1.71 × 10⁻¹² | 3.25 × 10⁻¹⁰ |
| 0.0057 | 7.15 × 10⁻²² | 3.43 × 10⁻¹² | 2.08 × 10⁻¹⁰ |
| 0.0140 | 4.30 × 10⁻²¹ | 8.58 × 10⁻¹² | 5.01 × 10⁻¹⁰ |
| 0.0280 | 1.58 × 10⁻²¹ | 1.71 × 10⁻¹¹ | 9.29 × 10⁻¹¹ |
| 0.0430 | 2.45 × 10⁻²² | 2.57 × 10⁻¹¹ | 9.53 × 10⁻¹² |
The power conversion efficiency (Fig. 7) of SOM micromotors using dithionite as the fuel varies in the order of 10−12 to 10−10. The maximum efficiency is observed to be 5.01 × 10⁻¹⁰ for 0.014 mol L−1 dithionite where the velocity of these SOM particles is also maximum.
Conclusion
To conclude, using molybdenum based soft-oxometalates (SOMs) and employing sodium dithionite as a fuel, we can make SOMs move. The motility of SOMs stems from the evolution of the SO2 gas by the oxidation of dithionite to SO2 with the concomitant reduction of Mo7-SOMs to molybdenum blue type SOMs. The reaction creates an osmotic boundary between the newly generated product (including the gas) and the unreacted reactant SOM surface. The chemical potential gradient between the SOM surface and the reactive osmotic interface (with evolving gas) gives rise to a slip velocity to the SOMs propelling them. The velocity of SOMs increases up to a certain limit (52 body lengths s−1) till the SOM surface is saturated with evolved gases as seen from adsorption isotherm. At such saturation value, the SOM velocity reaches a maximum of 52 body lengths s−1 and due to the viscous drag induced by the evolved gases on the SOM surface, the velocity decreases and finally drops to zero, when the viscous drag annuls the slip velocity. This explains that using a simple redox system and exploiting this potential in SOMs it is possible to construct SOM micromotors and in principle possibilities exist for fine-tuning their motion. The high propulsion velocity and facile synthesis of heptamolybdate SOM hold considerable importance in the field of active matter and can be used in future for cargo transport,34 catalysis35 and drug release.36 A more quantitative understanding of this phenomenon using other model systems is currently under investigation in our laboratory.Experimental details
Preparations
The reagents were purchased from commercial sources (Merck) and used without further purification. The glassware was cleaned in an acid bath, base bath and rinsed with isopropanol followed by acetone and kept in an oven for 48 hours prior to use.Instrumental analysis
Image analysis
Acknowledgements
SR gratefully acknowledges the grants from IISER-Kolkata, India, DST-fast track, BRNS-DAE grant, Mr Ritabrata Ghosh for helping with the imaging and Mr Abhrajit Laskar (IMSc, Chennai) for his help and support. The authors thank Prof. Ronojoy Adhikari (IMSc, Chennai) for helpful discussion.References
- S. Ghose and R. Adhikari, Phys. Rev. Lett., 2014, 112, 118102 CrossRef.
- S. Sengupta, D. Patra, I. Ortiz-Rivera, A. Agrawal, S. Shklyaev, K. K. Dey, U. Córdova-Figueroa, T. E. Mallouk and A. Sen, Nat. Chem., 2014, 6, 415–422 CrossRef CAS PubMed.
- J. Li, W. Gao, R. Dong, A. Pei, S. Sattayasamitsathit and J. Wang, Nat. Commun., 2014, 5, 5026 CrossRef CAS PubMed.
- K. Kim, X. Xu, J. Guo and D. Fan, Nat. Commun., 2014, 5, 3632 Search PubMed.
- S. Sanchez, A. N. Ananth, V. M. Fomin, M. Viehrig and O. G. Schmidt, J. Am. Chem. Soc., 2011, 133, 14860–14863 CrossRef CAS PubMed.
- S. Roy, CrystEngComm, 2014, 16, 4667–4676 RSC.
- S. Roy, Comments Inorg. Chem., 2011, 32, 113 CrossRef CAS PubMed.
- R. F. Ismagilov, A. Schwartz, N. Bowden and G. M. Whitesides, Angew. Chem., 2002, 114, 674–676 CrossRef.
- W. F. Paxton, K. C. Kistler, C. C. Olmeda, A. Sen, S. K. S. Angelo, Y. Cao, T. E. Mallouk, P. E. Lammert and V. H. Crespi, J. Am. Chem. Soc., 2004, 126, 13424–13431 CrossRef CAS PubMed.
- S. Fournier-Bidoz, A. C. Arsenault, I. Manners and G. A. Ozin, Chem. Commun., 2005, 441–443 RSC.
- J. Wang and W. Gao, ACS Nano, 2012, 6, 5745–5751 CrossRef CAS PubMed.
- W. Gao, S. Sattayasamitsathit, J. Orozco and J. Wang, J. Am. Chem. Soc., 2011, 133, 11862–11864 CrossRef CAS PubMed.
- S. Sattayasamitsathit, W. Gao, P. Calvo-Marzal, K. M. Manesh and J. Wang, ChemPhysChem, 2010, 11, 2802–2805 CrossRef CAS PubMed.
- R. Laocharoensuk, J. Burdick and J. Wang, ACS Nano, 2008, 2, 1069–1075 CrossRef CAS PubMed.
- N. S. Zacharia, Z. S. Sadeq and G. A. Ozin, Chem. Commun., 2009, 5856–5858 RSC.
- L. Zhang, T. Petit, Y. Lu, B. E. Kratochvil, K. E. Peyer, R. Pei, J. Lou and B. J. Nelson, ACS Nano, 2010, 4, 6228–6234 CrossRef CAS PubMed.
- A. Ghosh and P. Fischer, Nano Lett., 2009, 9, 2243–2245 CrossRef CAS PubMed.
- S. Tottori, L. Zhang, F. Qiu, K. K. Krawczyk, A. Franco-Obregón and B. J. Nelson, Adv. Mater., 2012, 24, 811–816 CrossRef CAS PubMed.
- G. Loget and A. Kuhn, J. Am. Chem. Soc., 2010, 1, 15918–15919 CrossRef PubMed.
- P. Calvo-Marzal, S. Sattayasamitsathit, S. Balasubramanian, J. R. Windmiller, C. Dao and J. Wang, Chem. Commun., 2010, 46, 1623–1624 RSC.
- S. T. Chang, V. N. Paunov, D. N. Petsev and O. D. Velev, Nat. Mater., 2007, 6, 235–240 CrossRef CAS PubMed.
- (a) V. Garcia-Gradilla, J. Orozco, S. Sattayasamitsathit, F. Soto, F. Kuralay, A. Pourazary, A. Katzenberg, W. Gao, Y. Shen and J. Wang, ACS Nano, 2013, 7, 9232–9240 CrossRef CAS PubMed; (b) Z. Wu, T. Li, J. Li, W. Gao, T. Xu, C. Christianson and W. Gao, ACS Nano, 2014, 8, 12041 CrossRef CAS PubMed.
- B. Roy, A. Sahasrabudhe, B. Parasar, N. Ghosh, P. Panigrahi, A. Banerjee and S. Roy, J. Mol. Eng. Mater., 2014, 2, 1440006 CrossRef.
- M. Ibele, T. E. Mallouk and A. Sen, Angew. Chem., Int. Ed., 2009, 48, 3308–3312 CrossRef CAS PubMed.
- Z. Wu, X. Lin, Y. Wu, T. Si, J. Sun and Q. He, ACS Nano, 2014, 8, 6097 CrossRef CAS PubMed.
- M. Guix, C. C. Mayorga-Martinez and A. Merkoçi, Chem. Rev., 2014, 114, 6285–6322 CrossRef CAS PubMed.
- S. Sattayasamitsathit, H. Kou, W. Gao, W. Thavarajah, K. Kaufmann, L. Zhang and J. Wang, Small, 2014, 10, 2830–2833 CrossRef CAS PubMed.
- T. R. Kline, W. F. Paxton, T. E. Mallouk and A. Sen, Angew. Chem., 2005, 117, 754–756 CrossRef PubMed.
- L. Burlamacchi, G. Guarini and E. Tiezzi, Trans. Faraday Soc., 1969, 65, 496 RSC.
- A. Muller, K. Das, E. Krickemyer and C. Kuhlmann, Inorg. Synth., 2004, 34, 191–200 Search PubMed.
- D. B. Allan, T. A. Caswell, N. C. Keim, Trackpyv0.2.ZENODO, 201410.5281/zenodo.9971 Search PubMed.
- A. Brown and W. Poon, Soft Matter, 2014, 10, 4016–4027 RSC.
- W. Wang, T.-Y. Chiang, D. Velegol and T. E. Mallouk, J. Am. Chem. Soc., 2013, 135, 10557–10565 CrossRef CAS PubMed.
- L. L. del Mercato, M. Carraro, A. Zizzari, M. Bianco, R. Miglietta, V. Arima, I. Viola, C. Nobile, A. Sorarù and D. Vilona, Chem. – Eur. J., 2014, 20, 10910–10914 CrossRef CAS PubMed.
- J. Li, V. V. Singh, S. Sattayasamitsathit, J. Orozco, K. Kaufmann, R. Dong, W. Gao, B. Jurado-Sanchez, Y. Fedorak and J. Wang, ACS Nano, 2014, 8, 11118–11125 CrossRef CAS PubMed.
- Z. Wu, Y. Wu, W. He, X. Lin, J. Sun and Q. He, Angew. Chem., Int. Ed., 2013, 52, 7000 CrossRef CAS PubMed.
Footnote |
| † Electronic supplementary information (ESI) available. See DOI: 10.1039/c5nj01097g |
| This journal is © The Royal Society of Chemistry and the Centre National de la Recherche Scientifique 2016 |

