 Open Access Article
Creative Commons Attribution 3.0 Unported Licence
Newport Green, a fluorescent sensor of weakly bound cellular Zn2+: competition with proteome for Zn2+†
Mohammad Rezaul
Karim
and
David H.
Petering
*
Department of Chemistry and Biochemistry, University of Wisconsin-Milwaukee, Milwaukee, WI 53201, USA. E-mail: petering@uwm.edu; Fax: +1 414-229-5530
First published on 25th November 2015
Abstract
Newport Green (NPG) is a recognized sensor of cellular Zn2+ that displays fluorescence enhancement upon binding to Zn2+. Because of its modest affinity for Zn2+, the extent of its capacity to bind cellular Zn2+ is unclear. The present study investigated the range of reactivity of NPGESTER with cells, isolated (Zn)-proteome, and model Zn-proteins. The sensor accumulated in pig kidney LLC-PK1 cells and was slowly (>40 min) hydrolyzed to the fluorescent, acid form, NPGACID. The powerful, cell permeant Zn2+ chelator, N,N,N′,N′-tetrakis(2-pyridylmethyl)-ethane-1,2-diamine (TPEN) failed to quench the growing fluorescence emission, indicating that Zn–NPGACID had not formed and NPG–Zn-protein adduct species probably were not present. Furthermore, NPGACID did not bind to Zn-carbonic anhydrase or Zn-alcohol dehydrogenase, two proteins that form adducts with some other sensors. Strikingly, most of the NPGACID that had been converted from NPGESTER was detected in the extracellular medium not the cells. As a result, after cells were incubated with NPGESTER and then Zn-pyrithione to raise the internal concentration of mobile Zn2+, Zn–NPGACID was only observed in the external medium. Residual cellular NPGACID was unable to bind extra intracellular Zn2+ delivered by pyrithione. Proteome isolated from the sonicated cell supernatant was also unreactive with NPGACID. Titration of proteome or glutathione with Zn2+ in the presence of NPGACID revealed that NPGACID only weakly competes for mobile Zn2+ in the presence of these cellular components. In addition, when proteomic Zn2+ was released by a nitric oxide donor or N-ethyl-maleimide, little Zn2+ was detected by NPGACID. However, exposure to nitric oxide independently enhanced the fluorescence properties of NPGACID. Thus, the biochemical properties of NPG related to cellular Zn2+ chelation deepen the question of how it functions as a Zn2+ sensor.
Introduction
A number of fluorescent biosensors have been synthesized during the past decade with the aim to detect and measure basal and elevated intracellular concentrations of metals.1–3 Such metallic species are variously described as labile, weakly bound, or accessible metal–ligand complexes, or free metal ions.4 Starting with a global view of intracellular metal ion (M) distribution among proteins and other ligands such as glutathione (L), | (1) |
M + S ⇌ M–S (Kstability![[thin space (1/6-em)]](https://www.rsc.org/images/entities/char_2009.gif) constant) constant) | (2) |
 | (3) |
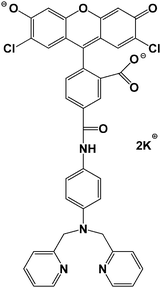
Sensors with a wide range of stability constants have been synthesized in order to detect metal ions linked with cellular M–Ligand complexes of different affinities for M.1,3,6 At the lower end of this spectrum of fluorophores is Newport Green, dipotassium salt (NPGA), having a stability constant of 105–106 (Fig. 1).1,5 It is able to detect Zn2+ in the micromolar range through an increase in its fluorescence emission at 530 nm.6
A number of papers have reported the use of NPG to image cells for labile Zn2+.7–14 The total concentration of Zn2+ in mammalian cells is thought to fall in the 100–500 μM range.15,16 In contrast, that of free or labile Zn2+ has been estimated between pM to nM.15–18 Evidently, NPG cannot image free Zn2+ ion in native systems because its stability constant for Zn2+ is too small. Thus, it must either interact with a significant fraction of cellular Zn2+ that has been mobilized from its tightly bound forms, or function like the sensors TSQ and Zinquin (ZQ) to form adduct species as in reaction (4):5,19,20
 | (4) |
Materials and methods
Chemicals and reagents
Newport Green, DCF diacetate (NPGE) and Newport Green dipotassium salt (NPGA) were purchased from Invitrogen. Newport Green was dissolved in DMSO and stored in the dark at −20 °C. All the other chemicals and reagents were purchased from either Fisher Scientific or Sigma-Aldrich at the highest grade available.Cell culture
The LLC-PK1 (pig kidney cells) cell line was purchased from the American Tissue Culture Company (ATCC). Cells were grown in Medium 199 with HEPES modification (Sigma) supplemented with 2.2 g L−1 NaHCO3, 50 mg L−1 penicillin G, 50 mg L−1 streptomycin and 4% fetal calf serum (FCS). CCRF-CEM human lymphocytic leukemia cells were cultured in suspension (0.5 × 10⁶ to 1.0 × 10⁶ cells per mL) in RPMI 1640 medium (Sigma) supplemented with 10% FCS and the same antibiotics. The cells were incubated at 37 °C in the presence of 5% CO2. Media for both cell lines was changed every 2–3 days until confluence or the maximum cell concentration was reached. Cells were subdivided either by trypsin treatment (LLC-PK1) to free cells from plates or after dilution in new media (CCRF-CEM).Fluorescence spectroscopy of LLC-PK1 cells
Cultured cells were grown in twenty 100 mm culture plates until confluence was attained. Culture media was discarded and the plates washed three times with cold cholate buffer, prepared by dissolving 2.47 g Na2HPO4, 0.53 g NaH2PO4, 17.0 g NaCl and 13.33 g choline chloride in 2 L MilliQ water. Cells were then gently scraped from the plates with a rubber cell scraper and pooled in Dulbecco's phosphate buffered saline (DPBS) (0.1 g L−1 MgCl2·6H2O, 0.2 g L−1 KCl, 0.2 g L−1 KH2PO4, 8.0 g L−1 NaCl, 1.15 g L−1 anhydrous Na2HPO4). Cells were collected by centrifugation at 680 g for 5 min and resuspended in 10 mL DPBS. The cell suspension was treated with 10 μM NPGE and incubated in the dark for one hour at 25 °C. For comparison, experiments were also conducted at 37 °C. To monitor the reaction between cells and NPGE, a 1 mL aliquot (ca. 2.7 × 10⁷ cells) was placed in a cuvette. Then, over a 40 min period and using an excitation wavelength of 505 nm, emission spectra were recorded between 515 nm and 600 nm with a Hitachi F-4500 fluorescence spectrophotometer. Afterwards, 10 μM N,N,N′,N′-tetrakis(2-pyridylmethyl)ethane-1,2-diamine (TPEN) was added and the fluorescence spectrum monitored for another 20 min. Finally, the reaction mixture was centrifuged using a microcentrifuge for about 5 min at 290 g to separate the extracellular medium and the cells, followed by resuspension of the cells in 1 mL DPBS.Cell viability assay
Trypsinized 107 LLC-PK1 cells were washed three times and resuspended in DPBS. Cells were then incubated with 10 μM NPGE for an hour at 25 °C. One hour later, 104 cells were reacted with 0.4% Trypan Blue solution in 1![[thin space (1/6-em)]](https://www.rsc.org/images/entities/char_2009.gif) :
:![[thin space (1/6-em)]](https://www.rsc.org/images/entities/char_2009.gif) 1 ratio and viable cells were counted immediately using a hemocytometer. The cell viability assay was also used with culture medium.
1 ratio and viable cells were counted immediately using a hemocytometer. The cell viability assay was also used with culture medium.
Binding of NPG to cell constituents
After one hour incubation of cells with NPGE (see above), 9 mL of cell suspension were taken through the cycle of centrifugation and resuspension in fresh DPBS three times to remove extracellular NPG. The last cell pellet was resuspended in 1 mL of cold MilliQ water. Cells were then lysed by sonication and centrifuged at 47![[thin space (1/6-em)]](https://www.rsc.org/images/entities/char_2009.gif) 000 g for 20 min at 4 °C to collect the cell supernatant. The supernatant was either loaded onto an 80 cm × 0.75 cm gel filtration column of Sephadex G-75 (GE Healthcare) equilibrated with 20 mM Tris buffer (pH 7.4) at room temperature or filtered through a Millipore Centricon Centrifuge filter (3 K MW cut off) at 4 °C to separate the high and low molecular weight fractions. During gel-filtration chromatography, the column was eluted with degassed 20 mM Tris-Cl (pH 7.4) and ninety fractions were collected. Emission spectra of all fractions were obtained as described above. The zinc content in each fraction was also detected by flame atomic absorption spectroscopy (AAS).
000 g for 20 min at 4 °C to collect the cell supernatant. The supernatant was either loaded onto an 80 cm × 0.75 cm gel filtration column of Sephadex G-75 (GE Healthcare) equilibrated with 20 mM Tris buffer (pH 7.4) at room temperature or filtered through a Millipore Centricon Centrifuge filter (3 K MW cut off) at 4 °C to separate the high and low molecular weight fractions. During gel-filtration chromatography, the column was eluted with degassed 20 mM Tris-Cl (pH 7.4) and ninety fractions were collected. Emission spectra of all fractions were obtained as described above. The zinc content in each fraction was also detected by flame atomic absorption spectroscopy (AAS).
Isolation of proteome using Sephadex G-75 chromatography
Cells were lysed by sonication and centrifuged at 47![[thin space (1/6-em)]](https://www.rsc.org/images/entities/char_2009.gif) 000 g for 20 min to collect the cell supernatant, which was then loaded onto a Sephadex G-75 column as above. The supernatant was eluted with degassed 20 mM Tris-Cl (pH 7.4) and 1 mL fractions were collected. Fractions within the high molecular weight region having absorbance at 280 nm were pooled. These pooled fractions were referred to as the proteome. The protein concentration was measured using a BioRad DC Protein Assay kit; 2.0 mg mL−1 bovine serum albumin (BSA) served as the standard. Initially, 25 μL of sample was mixed with 125 μL alkaline copper tartrate and 1 mL dilute Folin reagent.21,22 Then, 15 minutes later, the absorbance at 750 nm was recorded.
000 g for 20 min to collect the cell supernatant, which was then loaded onto a Sephadex G-75 column as above. The supernatant was eluted with degassed 20 mM Tris-Cl (pH 7.4) and 1 mL fractions were collected. Fractions within the high molecular weight region having absorbance at 280 nm were pooled. These pooled fractions were referred to as the proteome. The protein concentration was measured using a BioRad DC Protein Assay kit; 2.0 mg mL−1 bovine serum albumin (BSA) served as the standard. Initially, 25 μL of sample was mixed with 125 μL alkaline copper tartrate and 1 mL dilute Folin reagent.21,22 Then, 15 minutes later, the absorbance at 750 nm was recorded.
Isolation of subcellular proteomes
Subcellular proteomes were isolated as described with modifications.23 LLC-PK1 cells were collected and resuspended in 4 mL of pre-chilled homogenation buffer (0.25 M sucrose, 15 mM KCl, 1.5 mM MgSO4, and 10 mM Tris-Cl pH 7.4). The cell suspension was then homogenized using a pestle and centrifuged at 1000 g for 10 min at 4 °C. The pellet was saved as the nominal membrane-nuclear fraction. Supernatant was then centrifuged at 10![[thin space (1/6-em)]](https://www.rsc.org/images/entities/char_2009.gif) 000 g for 15 min at 4 °C. The pellet was retained as the mitochondrial fraction. Supernatant was centrifuged again at 100
000 g for 15 min at 4 °C. The pellet was retained as the mitochondrial fraction. Supernatant was centrifuged again at 100![[thin space (1/6-em)]](https://www.rsc.org/images/entities/char_2009.gif) 000 g at 4 °C and the resultant supernatant was designated the cytosolic proteome. The membrane-nuclear and mitochondrial fractions were sonicated and centrifuged at 47
000 g at 4 °C and the resultant supernatant was designated the cytosolic proteome. The membrane-nuclear and mitochondrial fractions were sonicated and centrifuged at 47![[thin space (1/6-em)]](https://www.rsc.org/images/entities/char_2009.gif) 000 g for 20 min at 4 °C and the resultant supernatants were labelled as ‘membrane/nuclear and mitochondrial proteomes, respectively.
000 g for 20 min at 4 °C and the resultant supernatants were labelled as ‘membrane/nuclear and mitochondrial proteomes, respectively.
Quantification of Zn2+ by atomic absorption spectrophotometry
The concentration of Zn2+ in solutions was determined by flame AAS. A GBC model 904 instrument employed an acetylene torch to atomize samples using an 80![[thin space (1/6-em)]](https://www.rsc.org/images/entities/char_2009.gif) :
:![[thin space (1/6-em)]](https://www.rsc.org/images/entities/char_2009.gif) 20 mixture of compressed air and acetylene. Zinc measurements were made with deuterium background correction. The instrument was calibrated before each run using standard Zn2+ solutions.
20 mixture of compressed air and acetylene. Zinc measurements were made with deuterium background correction. The instrument was calibrated before each run using standard Zn2+ solutions.
Quantification of sulfhydryl groups
The concentration of sulfhydryl groups was determined with Ellman's Reagent.24 Specifically, 60 μL of proteome sample was diluted with 540 μL 20 mM Tris-Cl, pH 7.4 and then incubated with 60 μL of 10 mM 5,5-dithiobis-2-nitrobenzoic acid (DTNB) for 30–60 min before the absorbance at 412 nm was obtained. An extinction coefficient of 13![[thin space (1/6-em)]](https://www.rsc.org/images/entities/char_2009.gif) 600 cm−1 M−1 was used to determine the concentration of reactive thiol groups in the samples.
600 cm−1 M−1 was used to determine the concentration of reactive thiol groups in the samples.
Results
Spectral properties of NPG and Zn–NPG
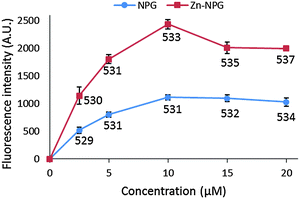
NPGE does not fluoresce but gains its fluorescent property upon conversion to NPGA. With excitation at 505 nm, NPGA emitted fluorescence with a wavelength maximum at 530 nm. However, the fluorescence of NPGA and Zn–NPGA were not linearly dependent on their concentration (Fig. 2). With increasing concentration, their fluorescence intensity increased non-linearly until a maximum value after which it declined. Moreover, the emission wavelength maximum changed with concentration. The declining fluorescence intensity of NPGA and Zn–NPGA at higher concentration might be due to the stacking of fluorescein, the reporter part of NPG. This behavior rules out an inner filter effect as a possible reason. Regardless of the cause, this property of NPGA makes it difficult to quantify the actual Zn2+ concentration simply from the observation of fluorescence response. When titrated with Zn2+, NPGA formed a 1![[thin space (1/6-em)]](https://www.rsc.org/images/entities/char_2009.gif) :
:![[thin space (1/6-em)]](https://www.rsc.org/images/entities/char_2009.gif) 1 complex with its emission wavelength maximum unaltered and about twice the intensity of the free ligand (Fig. S1 and S2, ESI†). The product rapidly reacted with TPEN, a cell permeant, high affinity chelator of Zn2+, returning the fluorescence to that of NPGA (Fig. S2, ESI†).
1 complex with its emission wavelength maximum unaltered and about twice the intensity of the free ligand (Fig. S1 and S2, ESI†). The product rapidly reacted with TPEN, a cell permeant, high affinity chelator of Zn2+, returning the fluorescence to that of NPGA (Fig. S2, ESI†).
Cell viability
As the cellular experiments in this study were performed in DPBS buffer at 25 °C for an hour or so, the cell viability was determined under such conditions using Trypan Blue exclusion assay. Cell viability under experimental conditions was calculated to be 90%, whereas cells kept in culture medium were found to be almost 100% viable.Reaction of NPGE with LLC-PK1 cells
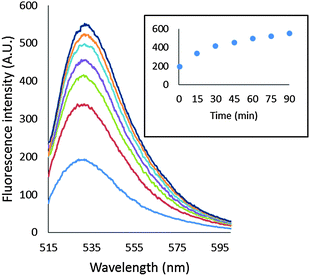
As a basis for addressing the question of what NPG images in cells, the reaction of NPGE with 107 LLC-PK1 cells in DPBS buffer was monitored by spectrofluorimetry at 25° and 37 °C. At 25 °C, fluorescence intensity increased slowly at 530 nm, reaching a maximum after 40 min, indicative at least of the conversion of some NPGE to NPGA catalyzed by cellular esterases (Fig. 3A). The background fluorescence of media and cells was insignificant in comparison with the fluorescence contributed by the formation of NPGA (Fig. S3, ESI†). Considering the initial extracellular concentration of NPGE, complete hydrolysis of the sensor would result in an intensity of about 5000 arbitrary units. Since the observed, maximal fluorescence was only about 1200 units, at most about 25% of NPGE had undergone reaction during this period. At that point, TPEN was added to quench the fluorescence of any Zn–NPGA that had formed. No reduction in fluorescence emission was observed over a period of 20 min, leading to the conclusion that detectable Zn–NPGA had not been produced in these cells. Since TPEN forms ternary adducts with Zn-proteins, the results also suggested that NPGA had not formed NPG–Zn-protein species that could be converted to TPEN–Zn-proteins.25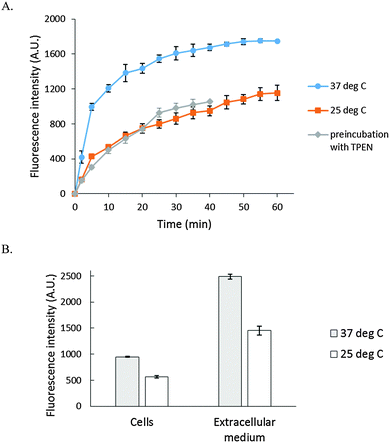 | ||
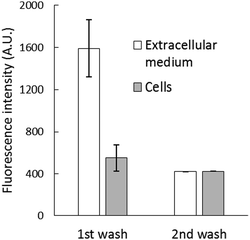
| Fig. 3 Reaction of LLC-PK1 cells with NPGE. (A) 107 LLC-PK1 cells suspended in 1 mL DPBS were treated with 10 μM NPGE for 40 min at 25 °C. Subsequently, 10 μM TPEN was added for another 20 min. The reaction was repeated at 37 °C. In the third case, 107 LLC-PK1 cells were preincubated with 10 μM TPEN for 20 min at 25 °C followed by the treatment with 10 μM NPGE for another 40 min. (B) The reaction mixture, after 1 h, was centrifuged at 290 g and the extracellular medium separated from the cells. The cells were resuspended in 1 mL DPBS. Error bar represents standard error for three measurements. The data were corrected for the background fluorescence signals of extracellular medium and of the cells without the dye (Fig. S3, ESI†). | ||
The reaction of NPGE with 107 LLC-PK1 cells at 37 °C was qualitatively similar to the one at 25 °C though as expected it proceeded at a faster rate. Moreover, treatment of cells with TPEN prior to addition of NPGE failed to modify the reaction, confirming the lack of interaction of NPG with intracellular Zn2+. Although the formation of Zn–NPGA was not supported at either temperature, it remained possible that ternary adducts of NPGA–Zn-proteins accounted for some of the fluorescence increase, and were unreactive with TPEN.
After the reaction, the cell suspension was centrifuged to separate the extracellular medium and cells, which were then resuspended in DPBS. Surprisingly, most of the fluorescence (about 70%) was found in the external medium (Fig. 3B), and it could not be quenched by the addition of 10 μM TPEN for 5 min (Fig. S4, ESI†). To investigate this surprising result, 2.7 × 10⁷ cells per mL were incubated with 10 μM NPGE in DPBS at 25 °C for 40 min followed by fluorescence emission analysis. The suspension (1) was centrifuged to produce extracellular supernatant (a), and the cells (2) were then resuspended in 1 mL of NPGE-free medium for 20 min. After a fluorescence measurement, supernatant (b) was isolated. The relative fluorescence emission properties of both suspensions and supernatants were determined. According to Fig. 4, most of the fluorescence was found in the extracellular part of the first cell suspension (a) and a significant fraction of the external medium of the second cell suspension (b). Since cell suspension 2 began its incubation with only intracellular NPGA and perhaps some NPGE, the fact that fluorescence made its way into the external medium demonstrated that NPGA underwent efflux from the cells during the 20 min period.
We considered the possibility that during the initial isolation of cells via scraping some cells were damaged resulting in progressive release of intracellular esterase activity and/or NPG into the external medium. However, we repeated this experiment with CCRF-CEM cells, a cell line that grows in suspension culture, and obtained the same result (Fig. S5, ESI†), ruling out the possibility that scraping had resulted in the appearance of NPGA in the extracellular medium.
These findings are consistent with two hypotheses, either (i) NPGE is accumulated by cells and undergoes internal esterase hydrolysis to NPGA which is then transported out of the cells or (ii) NPGE both moves into cells and is hydrolyzed on the extracellular surface of the cell. In the absence of extracellular NPGE, the ester leaves the cell and undergoes ester hydrolysis. In either case, the interaction of NPG with cells is considerably more complicated than anticipated and results in most of the detectable sensor residing in the external medium.
Location of NPGA among cell constituents
To characterize the intracellular properties of NPGA, cells isolated after one hour incubation with NPGE were lysed and the supernatant subjected to Sephadex G-75 chromatography. Proteome and low molecular weight fractions were assayed for Zn2+ and fluorescence. Zn2+ was associated with the high molecular weight proteome fractions, whereas fluorescent NPGA emerged from the column without bound Zn2+ well beyond the total volume of the column indicative of a favorable interaction between the Sephadex beads and NPGA (Fig. S6, ESI†). Possibly, the chromatographic separation altered the original supernatant distribution. To investigate this possibility, proteome and low molecular weight species were separated using the Centricon filtration system and a 3 kDa cut-off filter. The majority of NPGA (about 85% of total fluorescence intensity) was retained by the filter during centrifugation along with the proteome (Fig. S7, ESI†). Thus, NPGA was weakly associated with protein in the supernatant but was dissociated from the proteome during Sephadex chromatography.Reaction of NPGE with isolated proteome
In order to gain a more detailed understanding of the reaction of NPG with cells, an analogous set of experiments was conducted using isolated supernatant or proteome in place of whole cells. NPGE was slowly hydrolyzed to NPGA by supernatant or proteome, indicative of the presence of proteomic esterases that catalyze this conversion (Fig. 5). As in cells, much of the NPGA (84% of total fluorescence intensity) that was generated became associated with the proteome as shown by centrifugal filtration. The addition of TPEN failed to quench the proteome-associated fluorescence (Fig. S8, ESI†), consistent with the conclusion that NPGA–Zn-proteins did not form during the enhancement of fluorescence.Reactions of NPG with model Zn-proteins
The cellular and proteomic experiments with NPG indicate that the sensor does not successfully compete for native, proteomic Zn2+. But they do not exclude the possibility that NPG may form ternary adducts with Zn-proteins that are insensitive to the presence of TPEN. To address this issue, NPGE was reacted with two model Zn-proteins, alcohol dehydrogenase (Zn-ADH) and carbonic anhydrase (Zn-CA), that are known to form TPEN-sensitive ternary adducts with the Zn2+ sensors, TSQ and/or Zinquin.5,16 Upon incubation of NPGE with Zn-ADH, the fluorescence gradually increased with time. However, TPEN was unable to quench the fluorescence. Therefore, the fluorescence increase was indicative of the capacity of ADH to act upon NPGE as an esterase not the ability of NPG to associate with one of ADH's bound Zn2+ ions. ZQ removes 1 Zn2+ from this protein as Zn(ZQ)2 and binds to the other to form a fluorescent adduct.5 Both are quenched by TPEN as it acquires Zn2+ from Zn(ZQ)2 and displaces ZQ from ZQ–Zn-ADH to form TPEN–Zn-ADH.5 Together with this information, the current result strongly implies that NPG neither binds to nor extracts Zn2+ from this protein. Similar results were obtained with Zn-CA; the protein has NPGE esterase activity but is otherwise unreactive with NPG. Nevertheless, the majority of NPGA did associate with Zn2-ADH and Zn-CA according to Centricon filtration analysis.Stability of Zn–NPGA with proteome
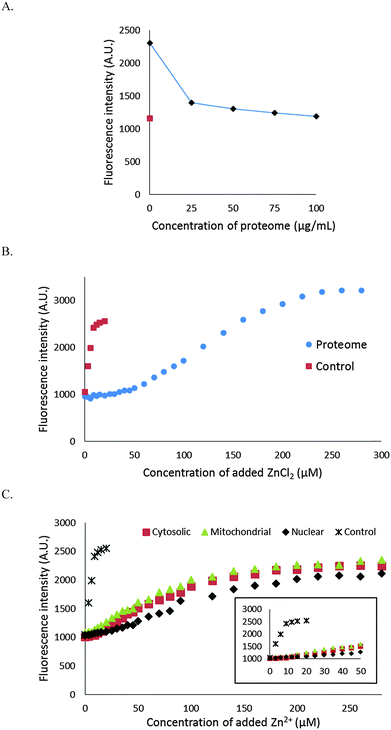
It was evident that NPGA cannot compete with native, protein bound Zn2+ to form Zn–NPGA. We then inquired whether it can compete for adventitiously bound Zn2+ that might be produced under certain physiological or pathological conditions. Initially, 10 μM Zn–NPGA was titrated with proteome to test whether this species exhibits stability in the presence of protein competitors for Zn2+. Fig. 6A shows that addition of proteome up to about 50 μg protein per mL (0–170 nM Zn2+ bound as Zn-protein) reduced the starting fluorescence intensity of Zn–NPGA to that of an equivalent concentration of NPGA. Thus, NPGA does not compete favorably with proteome for Zn2+.The capability of NPGA to compete with proteome for Zn2+ was probed another way: 4.2 mg mL−1 proteome containing 7 μM Zn-proteins was mixed with 10 μM NPGA initially in 20 mM Tris (pH 7.4) and then titrated with Zn2+ (Fig. 6B). NPGA fluorescence did not increase until Zn2+ reached 30–35 μM or about 5× the total proteomic concentration of Zn2+. At higher concentrations of Zn2+, fluorescence emission at 535 nm increased; but even at 100 μM Zn2+, stoichiometric Zn–NPGA had not been generated, showing that proteomic sites continued to partially sequester Zn2+ even at these large concentrations. Both experiments demonstrated that under the described conditions, NPGA has little, if any, capacity to compete with native proteome for Zn2+ that might be liberated from cellular binding sites during physiological or pathological processes.
We considered the possibility that proteins with substantial zinc buffering capacity might be distributed among some organelles and not able to interfere with NPGA's ability to image free or loosely bound Zn2+ in other compartments. To investigate this possibility, 1.7 mg mL−1 of cytosolic proteome (ca. 2.8 μM Zn2+), isolated by gentle homogenization of cells followed by centrifugation at 100![[thin space (1/6-em)]](https://www.rsc.org/images/entities/char_2009.gif) 000 × g, was mixed with 10 μM NPGA and subsequently titrated with Zn2+ (Fig. 6C). A detectable increase of fluorescence was not observed until the added Zn2+ reached about 10 μM. Beyond that, NPGA partially competed with cytosolic proteome for additional Zn2+. This result was in qualitative agreement with the findings with whole proteome in the previous experiment and indicated that a subset of proteins within the cytosolic proteome possesses substantially higher affinity for free or loosely bound Zn2+ than does NPGA. Similar results were obtained with membrane/nuclear and mitochondrial proteomes (Fig. 6C). All of the compartments displayed substantial Zn2+ buffering capacity.
000 × g, was mixed with 10 μM NPGA and subsequently titrated with Zn2+ (Fig. 6C). A detectable increase of fluorescence was not observed until the added Zn2+ reached about 10 μM. Beyond that, NPGA partially competed with cytosolic proteome for additional Zn2+. This result was in qualitative agreement with the findings with whole proteome in the previous experiment and indicated that a subset of proteins within the cytosolic proteome possesses substantially higher affinity for free or loosely bound Zn2+ than does NPGA. Similar results were obtained with membrane/nuclear and mitochondrial proteomes (Fig. 6C). All of the compartments displayed substantial Zn2+ buffering capacity.
Stability of Zn–NPGA with glutathione
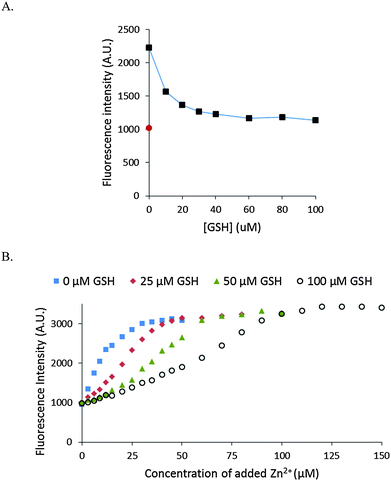
The stability of Zn–NPGA was also studied in the presence of glutathione (GSH). GSH exists in the cells in mM concentration and displays modest affinity for Zn2+ (104.2 (Zn-SG) and 105.7 (Zn(SG)2) pH 7.2, 25 °C).26 As little as 30 μM of GSH decreased the fluorescence intensity of 10 μM Zn–NPGA by almost 80% (Fig. 7A). The competition of glutathione for Zn2+ with NPGA was also confirmed by the titration of NPGA with Zn2+ in the presence of glutathione (Fig. 7B).Response of intracellular NPGA to added Zn2+
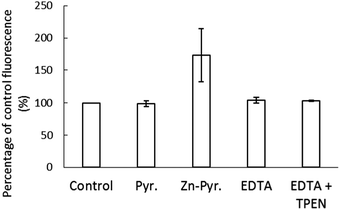
The stability of Zn–NPGA within the cellular environment was also investigated. To do so, 1.5 × 10⁷ LLC-PK1 cells were reacted with 10 μM NPGE for 30 min followed by washing to remove any remaining extracellular medium. The cells resuspended in DPBS were subsequently treated for 20 min with a pre-incubated mixture of 10 μM ZnCl2 and 2 μM pyrithione, which served as an ionophore to conduct Zn2+ into cells. During this time the internal concentration of Zn2+ increased from 1.8 nmoles per 107 cells to 2.6 nmoles per 107 cells, representing 15% of the added Zn2+. An increase of fluorescence (173% of control) was observed after the addition of Zn-pyrithione (Fig. 8). However, 10 μM EDTA rapidly reversed the fluorescence to 104% of control suggesting that the elevation in fluorescence was mostly due to the binding of extracellular Zn2+ to NPGA that had diffused out of the cells. The inability of 10 μM TPEN to quench the remaining fluorescence ruled out the possibility that the residual 4% increase in fluorescence originated from binding of added Zn2+ to intracellular NPGA. Instead, it probably arose from the continuing hydrolysis of intracellular non-fluorescent NPGE to fluorescent NPGA. Thus, although the intracellular Zn2+ concentration had increased almost 50%, no Zn–NPGA was observed in the cells. Therefore, the results indicated that the intracellular NPGA did not compete for adventitious Zn2+ within the cellular environment.Reaction of proteome with thiol reactive agents NO and NEM in the presence of NPGA
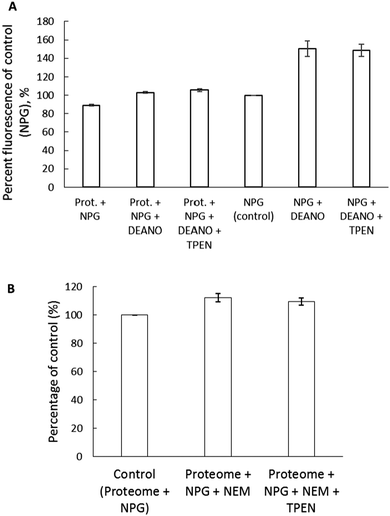
To further examine if NPGA can image Zn2+ released from Zn-proteins, 3.6 mg mL−1 proteome containing 12 μM Zn-proteins was reacted with 200 μM of the nitric oxide donor, diethylamine NONOate (DEA-NO) in the presence of 10 μM NPGA. The NO produced from the breakdown of DEA-NO can react with sulfhydryl groups in the Zn binding sites of the Zn-proteins resulting in the release of Zn2+.27 A 17% increase of fluorescence upon addition of DEA-NO was observed, which initially pointed to the release of Zn2+ and the subsequent formation of Zn–NPGA (Fig. 9A). However, the observation that TPEN did not reduce the fluorescence undermined this possibility. As a control, NPGA was reacted with DEA-NO to see if the sensor, itself, underwent reaction with DEA-NO. A 50% increase of fluorescence was observed upon its reaction with DEA-NO for 2 hours (Fig. 9A). Apparently, NPGA directly reacts with NO released from DEA-NO, resulting in an enhancement of fluorescence.NPGA's weak ability to image adventitious Zn2+ released from the Zn-proteome was further verified with the use of another thiol binding reagent, N-ethylmaleimide (NEM). 5.14 mg mL−1 proteome containing 17 μM Zn-proteins was reacted with NEM. A total of 500 μM NEM reduced the proteomic thiol concentration by almost 50% and caused about a 12% increase of fluorescence of 10 μM NPGA, maximally equivalent to the formation of about 1 μM Zn–NPGA (Fig. 9B). The addition of 30 μM TPEN for 30 min reduced the fluorescence to 109% of control. Thus, no more than 0.3 μM Zn–NPGA had actually formed. In contrast, substituting 20 μM Zinquin for NPGA, the higher affinity zinc sensor displayed a 47% increase of fluorescence after addition of only 100 μM NEM to the proteome. In the process, 25% of the proteomic zinc (4.2 μM) was labilized by NEM, much of it becoming bound to Zinquin.20
Discussion
NPG is a sensor that has been employed in a number of studies to image Zn2+.7–14 Within the general framework for understanding the behavior of metal sensors laid out in the Introduction, the use of NPG immediately raises questions. Its small stability constant for Zn2+ means that it has many potential competitors for available Zn2+ within the cell. Moreover, the results of this study indicate that the use of NPG is complicated by several of its chemical properties.In typical experiments, cells were initially incubated with NPGE, a charge neutral form of the sensor employed to facilitate its uptake. Within cells NPGE was converted to the negative charged NPGA, which has been thought to undergo little or no efflux from cells. The conversion of NPGE to NPGA also transformed it into a molecule that emits fluorescence with a wavelength maximum of 530 nm (Fig. 3A). Trapped within cells, NPGA is supposed to carry out its role of binding Zn2+ with a further enhancement in fluorescence.
The hydrolysis of NPGE to NPGA by esterases in LLC-PK1 cells was slow (Fig. 3A). Thus, the kinetics of NPGA formation may well overlap with putative reactions involving the mobilization of Zn2+ that are to be monitored by the formation of Zn–NPGA. Moreover, according to in vitro titration results, NPGA's Zn2+-dependent enhancement of fluorescence only doubled the signal of NPGA and did not change its emission spectrum. Thus, at best, Zn2+ binding is signaled by an increase in background fluorescence. Because of these characteristics, it is imperative to test for the formation of Zn–NPGA by adding TPEN, a powerful, cell-permeant chelator of Zn2+ that readily and rapidly undergoes ligand substitution with Zn–NPGA.10,11 In LLC-PK1 cells, the presence of TPEN did not alter the fluorescence emission of cells treated with NPGE (Fig. 3A). Therefore, it was concluded that NPGA did not compete effectively for Zn2+ in its native cellular distribution to form Zn–NPGA.
In other studies, TPEN readily quenched the fluorescence acquired by cells exposed to TSQ or Zinquin.5,20,25 Those sensors form ternary adducts with Zn-proteins as their mechanism of fluorescence enhancement. Detailed experiments showed that TPEN both obtained Zn2+ from Zn-proteins and replaced TSQ or ZQ in sensor-Zn-protein adducts as means to quench fluorescence.25 On the basis of those reports, it was also concluded that the invariance of NPGA-related fluorescence in the presence of TPEN indicated that NPGA probably did not form adduct species with Zn-proteins. Similar results were seen in the reaction of NPGE with Zn-alcohol dehydrogenase and Zn-carbonic anhydrase. The fluorescence increased as NPGE was hydrolyzed to NPGA by the enzymes, but the addition of TPEN failed to decrease the fluorescence intensity.
A peculiarity of the reaction of cells with NPGE was that much of the NPGA generated upon hydrolysis of NPGE was found in the extracellular medium at either 25° or 37 °C. Data in Fig. 3B and 4 demonstrated that intracellular NPG underwent efflux either as NPGE or NPGA and appeared in the extracellular compartment as NPGA. To the extent that such reactions occur, fluorescence enhancement attributable to the formation of Zn–NPGA might involve Zn2+ outside the cell.
Features of the reaction of NPGE with cellular components were explored further in experiments that incubated NPGE and NPGA with LLC-PK1 cell proteome. As with intact cells, the proteome was able to hydrolyze NPGE to NPGA (Fig. 5). However, subsequent incubation with TPEN exerted no effect on the observed fluorescence, consistent with the conclusion that NPGA neither formed Zn–NPGA nor NPGA–Zn-protein adducts during the reaction. With both cells and proteome, the majority of NPGA associated with the proteome possibly through interactions of the fluorescein ring with proteins. The interaction of NPGA with proteins was further supported by its binding to the model proteins alcohol dehydrogenase and carbonic anhydrase. In both cases, most of the fluorescence was found associated with the protein though not with protein-bound Zn2+. A recent paper also reported the association of NPG with proteomic fractions after gel filtration.28
The use of NPG as a Zn2+ sensor is rendered problematic by its small stability constant. Should a physiological or pathological process liberate Zn2+ in a concentration range (μM) that otherwise might make it accessible to reaction with NPG, numerous proteomic sites would also compete for binding.15,29 Thus, according to the results shown in Fig. 6B, about 30–35 μM Zn2+ could be added to proteome containing 7μM Zn2+ in the form of native Zn-proteins in the presence of 10 μM NPGA before any Zn–NPGA formed. Likewise, upon addition of 10 μM Zn–NPGA to the same concentration of proteome as above, the fluorescence due to the Zn2+ complex was totally quenched as Zn2+ was transferred to the proteome (data not shown). According to the first experiment, Zn2+ at about 5× the total concentration of the Zn-proteome must be present before proteomic binding sites for adventitious Zn2+ are sufficiently titrated to permit the appearance of Zn–NPGA. Similar zinc buffering capacity was obtained for the cytosolic, mitochondrial and nuclear proteomes (Fig. 6C).
Two experiments with thiol reactive reagents tested the primary hypothesis that NPGA cannot compete with proteome for Zn2+ that is mobilized from Zn-proteome. After Zn-proteome was reacted with the NO donor, DEA-NO, NPGA did not detect any accessible Zn2+ (Fig. 9A). It was apparent that components of the proteome bind the newly labilized Zn2+ with higher affinity than NPGA, further deepening the question whether NPG can serve as a reliable intracellular sensor of Zn2+.
A number of studies have employed NPGA to image intracellular Zn2+ released through induction by NO and have reported fluorescence enhancement attributed to the formation of Zn–NPGA.30,31 Ironically, in the absence of Zn2+, NPGA images NO with an enhancement of fluorescence emission and an unchanged emission maximum (Fig. 9A). Taken together, the present findings encourage a re-examination of the studies that have detected Zn2+ released in cells by NO donors.
Results with another thiol binding reagent, NEM, also fail to support the imaging of Zn2+ liberated from Zn-proteome by NPGA (Fig. 9B). Despite the reduction of sulfhydryl groups by 50% upon incubation of proteome with 500 μM NEM, only a non-significant enhancement of fluorescence intensity corresponding to about 0.3 μM Zn–NPGA was sensitive to the presence of TPEN. By contrast, Zinquin, a sensor with higher stability constant for Zn2+, binds proteomic Zn2+ mobilized by 100 μM NEM as Zn(ZQ)2.20 It appears that components of the proteome bind the newly labilized Zn2+ with higher affinity than NPGA, further underscoring the problems with using NPG as an intracellular sensor of Zn2+.
Besides proteome, the other major source of cellular metal binding sites is glutathione.29,32 As with proteome, Zn–NPGA was unstable in the presence of GSH in the micromolar concentration range (Fig. 7). Since, glutathione exists in millimolar concentrations within cells, it is evident that GSH as well as proteome constitutes a powerful competitor of NPGA for mobile Zn2+.
In vivo findings were consistent with these in vitro results. Cells pre-incubated with NPGE did respond to the addition of Zn2+ and the ionophore, pyrithione with a prompt increase in fluorescence (Fig. 8). However, most of the increase occurred in the extracellular medium where negatively charged EDTA competed with Zn–NPGA and diminished the observed fluorescence. This result was suggestive of the conversion of NPGE to NPGA within the cells followed by its efflux in agreement with the results shown in Fig. 4. The fluorescence that remained from NPGA within the cells was not impacted by the further addition of TPEN, even though pyrithione had shuttled in an amount of Zn2+ equal to 50% of the total proteomic concentration of Zn2+. It was evident that intracellular Zn2+ competitors had successfully prevented the formation of Zn–NPGA. Thus, it is unclear under what conditions NPGA might be able to image intracellular Zn2+ that has been mobilized by some process. According to proteomic titrations of Zn2+ in Fig. 6, more than the total Zn2+ content of the entire proteome would be required to detect Zn–NPGA. Possibly, much larger concentrations of intracellular NPGA would need to be present than could be achieved in the current work in order to compete for Zn2+ in the presence of proteome and GSH.
Under some extreme conditions, such as at very large concentration of added Zn2+, NPGA can apparently form Zn2+-NPGA with an enhancement of fluorescence emission.7,8,33–35 This may be expected either because extracellular Zn2+ is being imaged by NPGA released from cells or because after the adventitious cellular binding sites for zinc are saturated with added Zn2+, NPGA binds excess Zn2+ with an accompanying increase in fluorescence intensity.
Other studies using NPGA have reported stimulated Zn2+ release from different intracellular stores.10,11,13 According to our study, in the presence of adventitious proteome binding sites and high concentration of glutathione, NPGA is not likely to bind the released Zn2+ unless very large concentrations of extracellular Zn2+ are involved. Perhaps, the reported studies are dealing with the regions of the cells with low zinc buffering capacity or the experimental conditions induce the release of very large concentrations of Zn2+ that saturate the adventitious zinc binding sites before binding to NPGA. However, our inquiry into subcellular Zn2+ buffering capacity did not find such organelle compartments (Fig. 6).
A possibility is to use NPGA as an extracellular sensor of Zn2+ where Zn2+ buffering might be lower. Here, too, because of its modest stability constant for binding Zn2+, the ability of NPGA to serve as a sensor depends on the metal chelation capacity of the external medium. For example, if its composition were similar to that of plasma, a previous study of the reactivity of various Zn-bis-thiosemicarbazones with plasma demonstrated that Zn-complexes with apparent stability constants at pH 7 of 106 are not stable.36
Conclusion
A number of papers have reported positive results when using NPG as a Zn2+ sensor.7–14 In contrast, the present work questions the stability of Zn–NPGA in cell compartments. Because of its low stability constant for Zn2+, NPGA must compete with a host of adventitious proteomic sites possessing higher affinity for Zn2+. Therefore, these results bring into question what pools of Zn2+ inside or outside cells and tissues may be imaged by NPG.Acknowledgements
The authors acknowledge the support for this research from the NIH grants ES-024509 and GM-85114.References
- E. L. Que, D. W. Domaille and C. J. Chang, Chem. Rev., 2008, 108, 1517–1549 CrossRef CAS PubMed.
- M. D. Pluth, E. Tomat and S. Lippard, Annu. Rev. Biochem., 2011, 80, 333–355 CrossRef CAS PubMed.
- K. P. Carter, A. M. Young and A. E. Palmer, Chem. Rev., 2014, 114, 4564–4601 CrossRef CAS PubMed.
- D. H. Petering, Chemtracts: Inorg. Chem., 2004, 17, 569–580 CAS.
- A. B. Nowakowski and D. H. Petering, Inorg. Chem., 2011, 50, 10124–10133 CrossRef CAS PubMed.
- R. P. Haugland, Handbook of Fluorescent Probes and Research Products, Molecular Probes, Inc., Eugene, OR, 9th edn, 2002 Search PubMed.
- L. M. Canzoniero, D. M. Turetsky and D. W. Choi, J. Neurosci., 1999, 19, RC31 CAS.
- T. Priel, B. Aricha-Tamir and I. Sekler, Eur. J. Pharmacol., 2007, 565, 232–239 CrossRef CAS PubMed.
- C. J. Stork and Y. V. Li, J. Neurosci. Methods, 2006, 155, 180–186 CrossRef CAS PubMed.
- S. Yamasaki, K. Sakata-Sogawa, A. Hasegawa, T. Suzuki, K. Kabu, E. Sato, K. Tomohiro, S. Yamashita, M. Tokunaga, K. Nishida and T. J. Hirano, Chem. Biol., 2007, 177, 637–645 CAS.
- C. J. Stork and Y. V. Li, J. Neurosci., 2006, 26, 10430–10437 CrossRef CAS PubMed.
- B. Lukowiak, B. Vandewalle, R. Riachy, J. Kerr-Conte, V. Gmyr, S. Belaich, J. Lefebvre and F. Pattou, J. Histochem. Cytochem., 2001, 49, 519–527 CrossRef CAS PubMed.
- C. J. Stork and Y. V. Li, J. Mol. Signaling, 2010, 5, 5 CrossRef PubMed.
- E. Ohana, E. Hoch, C. Keaser, T. Kambe, O. Yifrach, M. Hershfinkel and I. Sekler, J. Biol. Chem., 2009, 284(26), 17677–17686 CrossRef CAS PubMed.
- A. Krezel and W. Maret, JBIC, J. Biol. Inorg. Chem., 2006, 11, 1049–1062 CrossRef CAS PubMed.
- D. J. Eide, Biochim. Biophys. Acta, 2006, 1763, 711–722 CrossRef CAS PubMed.
- C. E. Outten and T. V. O'Halloran, Science, 2001, 292, 2488–2492 CrossRef CAS PubMed.
- J. L. Vinkenborg, T. J. Nicolson, E. A. Bellomo, M. S. Koay, G. A. Rutter and M. Merkx, Nat. Methods, 2009, 6, 737–740 CrossRef CAS PubMed.
- J. W. Meeusen, H. Tomasiewicz, A. Nowakowski and D. H. Petering, Inorg. Chem., 2011, 50(16), 7563–7573 CrossRef CAS PubMed.
- A. Nowakowski and D. Petering, Metallomics, 2012, 4, 448–456 RSC.
- O. H. Lowry, N. J. Rosebrough, A. L. Farr and R. J. Randall, J. Biol. Chem., 1951, 193, 265–275 CAS.
- G. L. Peterson, Anal. Biochem., 1979, 100, 201–220 CrossRef CAS PubMed.
- D. H. Petering, J. Loftsgaarden, J. Schneider and B. Fowler, Environ. Health Perspect., 1984, 54, 73–81 CrossRef CAS PubMed.
- G. Ellman and H. Lysko, Anal. Biochem., 1979, 93, 98–102 CrossRef CAS PubMed.
- J. W. Meeusen, A. Nowakowski and D. H. Petering, Inorg. Chem., 2012, 51, 3625–3632 CrossRef CAS PubMed.
- M. J. Walsh and B. A. Ahner, J. Inorg. Biochem., 2013, 128, 112–123 CrossRef CAS PubMed.
- M. Malavolta, L. Costarelli, R. Giacconi, E. Muti, G. Bernardini, S. Tesei, C. Cipriano and E. Mocchegiani, Cytometry, Part A, 2006, 69, 1043–1053 CrossRef PubMed.
- J. A. Figueroa, K. S. Vignesh, G. S. Deepe Jr and J. Caruso, Metallomics, 2014, 6, 301–315 RSC.
- A. Nowakowski, M. Karim and D. H. Petering, Zinc proteomics, Encyclopedia of Inorganic and Bioinorganic Chemistry, 2015, pp. 1–10 Search PubMed.
- C. Kruczek, B. Gorg, V. Keitel, E. Pirev, K. D. Kroncke, F. Schliess and D. Haussinger, Glia, 2009, 57, 79–92 CrossRef PubMed.
- Y. Jang, H. Wang, J. Xi, R. A. Muller, E. A. Norfleet and Z. Xu, Cardiovasc. Res., 2007, 75, 426–433 CrossRef CAS PubMed.
- W. Maret, Metallomics, 2015, 7, 202–211 RSC.
- G. A. Kerchner, L. M. T. Canzoniero, S. P. Yu, C. Ling and D. W. Choi, J. Physiol., 2000, 528(1), 39–52 CrossRef CAS.
- G. Kovacs, N. Montalbetti, M. Franz, S. Graeter, A. Simonin and M. A. Hediger, Cell Calcium, 2013, 54, 276–286 CrossRef CAS PubMed.
- S. L. Sensi, H. Z. Yin, S. G. Carriedo, S. S. Rao and J. H. Weiss, Proc. Natl. Acad. Sci. U. S. A., 1999, 96, 2414–2419 CrossRef CAS.
- D. H. Petering, Biochem. Pharmacol., 1974, 23(3), 567–576 CrossRef CAS PubMed.
Footnotes |
| † Electronic supplementary information (ESI) available. See DOI: 10.1039/c5mt00167f |
| ‡ Abbreviations: AAS, flame atomic absorption spectrophotometry; CCRF-CEM, human lymphocytic leukemia cells; DEA-NO, diethylamine NONOate; DPBS, Dulbecco’s phosphate buffered saline; DTNB, 5,5-dithiobis-2-nitrobenzonic acid; LLC-PK1 pig kidney tubule cells; NPG, Newport Green; NPGA, NPG acid form; NPGE, NPG ester form; S, Sensor; TPEN, N,N,N′,N′-tetrakis(2-pyridylmethyl)ethane-1,2-diamine. |
| This journal is © The Royal Society of Chemistry 2016 |

