 Open Access Article
Creative Commons Attribution 3.0 Unported Licence
Review: imaging technologies for flow cytometry
Yuanyuan
Han
,
Yi
Gu
 ,
Alex Ce
Zhang
and
Yu-Hwa
Lo
*
Department of Electrical and Computer Engineering, University of California, San Diego, California 92093, USA. E-mail: ylo@ucsd.edu
First published on 31st October 2016
Abstract
High-throughput single cell imaging is a critical enabling and driving technology in molecular and cellular biology, biotechnology, medicine and related areas. Imaging flow cytometry combines the single-cell imaging capabilities of microscopy with the high-throughput capabilities of conventional flow cytometry. Recent advances in imaging flow cytometry are remarkably revolutionizing single-cell analysis. This article describes recent imaging flow cytometry technologies and their challenges.
1. Introduction
Flow cytometry is a widespread and powerful technique employed in cell counting, biomarker detection and cell sorting. After the Coulter Principle was discovered in 1953 and Fulwyler applied this principle to sort cells in 1965, optical detections were soon adopted by flow cytometry and fluorescence-activated cell sorter (FACS) systems since the late 1960s.1,2 Soon afterwards, when false positive occurrence became a concern, imaging-in-flow techniques, including flying spot scanners, slit-imaging onto an array, laser strobes, and mirror tracking, were seen as invaluable in understanding discrepancies in cell measurements due to cell orientation and dynamics in fluid flow.3–6 At the same time, because of flow cytometry's successful applications in immunology and thanks to the growing appreciation of researchers for the complexity of the immune system, further technological advances have focused on satisfying the increasing need for polychromatic approaches to flow cytometry; researchers have developed flow cytometry to simultaneously measure 19 parameters—17 fluorescence and 2 scatter parameters in a high-speed manner.7 The broadly useful technology—flow cytometry—has been evolving slowly until imaging flow cytometry (IFC) became a resurgence of interest in the past decade.8,9 Due to its high-throughput and multiparametric analysis, by supporting detection of single cell properties at rates from hundreds to 100![[thin space (1/6-em)]](https://www.rsc.org/images/entities/char_2009.gif) 000 cells per second, conventional flow cytometry is an irreplaceable cytologic instrumentation when a study of high-volume cell populations and subpopulations needs to be performed.10–12 Meanwhile, due to the lack of spatial resolution in exchange for higher throughput, users have to make gating decisions blind to some of the most informative and relevant sample attributes contained in cell images.13–15 Imaging is indubitably indispensable for cell analysis because images effectively convey certain messages about cells, such as cell size, shape, morphology, and distribution or location of labeled biomolecules within cells. As cellular morphology analysis plays an important role in various biological studies and clinical diagnoses, such as cancer screening, conventional flow cytometry is much anticipated to incorporate imaging capabilities.16–18 Increasing flow cytometry's spatial resolution provides high-speed comprehensive analysis and in-depth imagery of every individual cell. In addition, some erroneous results yielded in conventional flow cytometry can be eliminated by acquiring and analyzing the cell images to, for example, distinguish between cells, debris, and clusters of cells.
000 cells per second, conventional flow cytometry is an irreplaceable cytologic instrumentation when a study of high-volume cell populations and subpopulations needs to be performed.10–12 Meanwhile, due to the lack of spatial resolution in exchange for higher throughput, users have to make gating decisions blind to some of the most informative and relevant sample attributes contained in cell images.13–15 Imaging is indubitably indispensable for cell analysis because images effectively convey certain messages about cells, such as cell size, shape, morphology, and distribution or location of labeled biomolecules within cells. As cellular morphology analysis plays an important role in various biological studies and clinical diagnoses, such as cancer screening, conventional flow cytometry is much anticipated to incorporate imaging capabilities.16–18 Increasing flow cytometry's spatial resolution provides high-speed comprehensive analysis and in-depth imagery of every individual cell. In addition, some erroneous results yielded in conventional flow cytometry can be eliminated by acquiring and analyzing the cell images to, for example, distinguish between cells, debris, and clusters of cells.
In contrast to pure quantitative measurements provided by conventional flow cytometry, a technique invented in the seventeenth century, microscopy allows capturing cell images that contain a wealth of information about a cell. While conventional flow cytometry measures forward scattered light to estimate the relative cell size, microscopy yields the exact cell size through its bright field image. Advances in the microscopy technique have realized both 3-dimensional and super resolutions that allow imaging of the biological structure and function beyond the diffraction limit, producing extraordinarily detailed fluorescent cell images, but it can take as long as several minutes to produce such high-content images. Automated microscopy coupled with automated image analysis can be relatively fast with a typical throughput of several hundreds of cells per second. The technology called laser scanning cytometry (LSC) allows automated high-throughput image analysis to identify and measure cell properties with multiple spectra and high spatial resolution for measuring dynamic processes.19–24 Although LSC and high-throughput microscopy are suitable for studying complex biological pathways in a time-lapse manner, they are designed to work only with adherent cells. There are also some bottlenecks for high-throughput microscopy systems, including mechanical stability when motorized stages and autofocus drives are required, image analysis problems caused by non-uniform illumination and cell-to-cell unmixing, sample and liquid handling,25 and above all, low throughput and yield in cell sorting. On the other hand, the development in mobile devices, especially in cell-phone cameras, has facilitated several cost-effective and field-portable imaging technologies, including lens-free optofluidic microscopy and cell-phone-based optofluidic fluorescent imaging cytometry.26,27 These miniaturized and automated lab-on-a-chip platforms provide commendable image quality and even three-dimensional cell representations in some examples.28,29 Yet, these systems are most suitable for a relatively small sample volume and cannot match the high throughput of conventional flow cytometers.
A parallel microfluidic cytometer (PMC) has been implemented to compromise between high throughput and high content, but has very limited 1-dimensional spatial resolution to resolve many sub-cellular components and structures compared to 2-dimensional cell images.30,31 Recent advances in imaging technologies, electronics, and digital computing have enabled imaging flow cytometry (IFC).32,33 As an integration of fluorescence microscopy and conventional flow cytometry, IFC combines flow cytometry's single-cell identification and high throughput with microscopy's cell image acquisition. Therefore, it becomes an ideal approach to simultaneously fulfill both analysis of morphological characteristics and phenotypic characterization of single cells within an enormous and heterogeneous population.34 Also, as the interest in performing IFC systems grows, the necessity of combining this technique with cell sorting becomes evident.35–38
The basic idea behind IFC is scaling up flow cytometric spatial resolution to analyze more properties of cells. IFC, in this review, aims at the fluidic-based platforms that have optical imaging functionality at informative spatial resolution while retaining the main features of conventional flow cytometry. This article aims at discussing recent IFC technologies and also those advances developed targeting at IFC. The following sections will describe recent IFC technologies, review their strengths and challenges, and also discuss the outlook for IFC.
2. Technologies and methods
Taking both high throughput, i.e. high temporal resolution, and high spatial resolution into account, signal detection is the key challenge due to the fundamental trade-off between acquisition speed, sensitivity, and amount of information. Detectors used in imaging platforms can be divided into two types: 1) multipixelated imaging devices, such as charge-coupled device (CCD) and complementary metal-oxide-semiconductor (CMOS), and 2) single pixel photodetectors, such as photomultiplier tube (PMT) and avalanche photodiode (APD). The rest of this section will discuss IFC platforms that employ these two types of detectors separately.2.1. Camera-based IFC
CCDs and CMOSs have a dense array of individual sensors in a 2-dimensional (2D) arrangement. Therefore, in an IFC system that uses CCD or CMOS as a detector, by employing wide-field illumination, 2D cell images can be produced as long as a sufficient number of photons are sensed within a given exposure time by those individual sensors of such camera devices placed at the image plane. The conundrum in this case is to increase the speed of such imaging tools. When applied in IFC that is on a cell-to-cell basis, the field of view is typically only 10s μm by 10s μm, so the large number of pixels in a CCD or CMOS camera is wisely re-arranged to work in parallel, either spatially or temporally.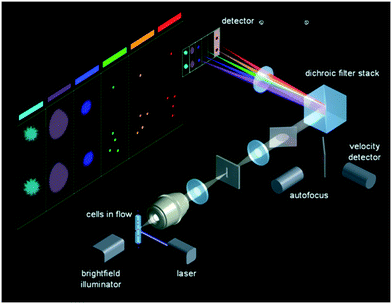 | ||
| Fig. 1 Optics of ImageStream. Reproduced from ref. 40 with permission from the EMD Millipore Corporation. | ||
Because the translation of the cell is exactly synchronized with the vertical charge transfer of each pixel on the CCD, using the TDI reading out technique requires a closely controlled fluidic system to ensure cells are centered and flow at a constant speed without rotation. This strict requirement hinders the system to adopt a sorting mechanism, since any minor fluidic disturbance from downstream cell sorting can cause imaging instability. One limitation of the system speed is the inherent data downloading method of CCD: every unit sensor passively collects incoming photons and stores electrons till the whole line/array has been read out; accumulated charges are transferred from the unit sensor to its neighbor before they are dumped into the charge amplifier to be converted into voltage. This working scenario constrains the system's data access rate. On the other side, obtaining enough sensitivity without any gain like electron multiplication also prevents the system to reach throughput higher than 3000 cells per second.
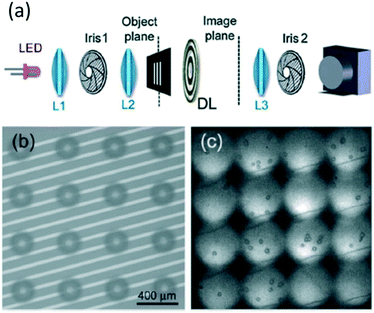 | ||
| Fig. 2 Multiple field-of-view imaging flow cytometer. (a) Diffractive lens wide-field imaging system. L1 collimates the LED. L2 is a condenser that images Iris 1 onto the object plane. DL is the diffractive lens providing multiple fields of view. L3 is a relay lens. (b) 16 object planes. (c) 16 imaging planes. Sample: 3.5 μm latex beads. Reproduced from ref. 41 with permission from the Royal Society of Chemistry. | ||
Despite that having more parallel fields of view means higher throughput, it is not always extendable due to field aberration caused by the diffractive lens. While field aberration is relatively less severe in MIFC systems since cells can be hydrodynamically focused and the field of view does not need to be significantly larger than single cells, typically 20 μm, chromatic aberration brought about by the diffractive lens makes MIFC work only in monochromatic mode. Light of various wavelengths has various light paths in an optical system that contains a diffractive lens. Its incompatibility with multi-mode and multi-spectral imaging becomes a hurdle of this IFC technique.
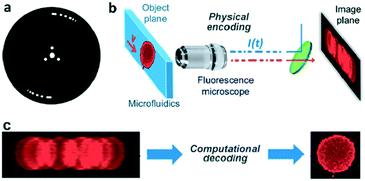 | ||
| Fig. 3 Coded excitation fluorescence microscope. (a) Chopper wheel that modulates the excitation beam with a pseudo-random code. (b) A microfluidic device imaged using a 40× fluorescence imaging microscope. (c) Raw blur encoded images captured by the camera and decoded images after the computational approach. Reproduced from ref. 42 with permission from the Optical Society. | ||
2.2. PMT-based IFC
PMTs have superb sensitivity at photon counting levels and high dynamic range because of their internal tandem electron multiplication and gain adjustment. PMTs can also provide higher bandwidth and lower dark noise than CCD/CMOS cameras to support high-throughput IFC systems. However, the readout of single-pixel PMTs presents the number of photons detected only in the time domain, which contains no spatial information. In some high-speed microscopy laser scanning cytometry techniques, PMTs are combined with laser spot scanning to collect the entire light emitted or scattered by the illuminated cell and output a temporal signal. Cell images are then retrieved by assembling the intensity signal in the time domain according to the laser scanning position. Therefore, the overall throughput is limited by the speed of serial beam scanning. Instead of relying on mechanical beam scanning, several techniques have been developed to transfer spatial information to either the frequency domain or time domain in order to make use of PMT's extra bandwidth that has not been fully utilized in conventional flow cytometers.![[thin space (1/6-em)]](https://www.rsc.org/images/entities/char_2009.gif) 000 cells per second. In addition to one-to-one spatial–spectral mapping, encoding one location with multiple wavelengths is also available for more efficient measurements.46
000 cells per second. In addition to one-to-one spatial–spectral mapping, encoding one location with multiple wavelengths is also available for more efficient measurements.46
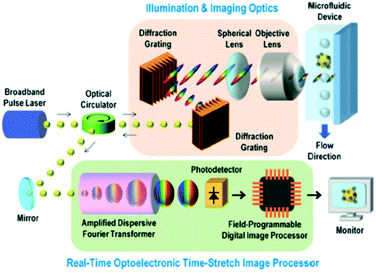 | ||
| Fig. 4 Schematic of the STEAM flow analyzer. Imaging and illumination optics takes blur-free images by encoding object location information into the spectral domain. ADFT converts spectral information into the time domain through the time-stretching method and processed using a real-time imaging processor. Reproduced from ref. 45 with permission from PNAS. | ||
Besides producing bright-field images, STEAM can produce phase-contrast images of cells by generating two 1D orthogonally polarized spectral rainbows for illumination.47,48 However, due to the high attenuation in the visible spectral range of one key optical component applied in the time-stretching-based system—optical fiber—and the incoherence of fluorescence, this technology has not been able to produce fluorescence images, which is an essential function in numerous applications of cell analysis. Incorporating 1D fluorescence detection by employing additional lasers enables the system to retain features of conventional flow cytometry, but such fluorescence signals do not benefit from the time-stretching technique.49,50 Another bottleneck of this technique, also due to the limited working spectral range up to the near-infrared regime (i.e. around 1000 nm), is that the spatial resolution does not go beyond the wavelength-related diffraction limit.
![[thin space (1/6-em)]](https://www.rsc.org/images/entities/char_2009.gif) 000 cells per second. In addition, by increasing the bandwidth from that of the employed AOD, the speed of this imaging technique is further exploited to be limited by fluorescence lifetime.53
000 cells per second. In addition, by increasing the bandwidth from that of the employed AOD, the speed of this imaging technique is further exploited to be limited by fluorescence lifetime.53
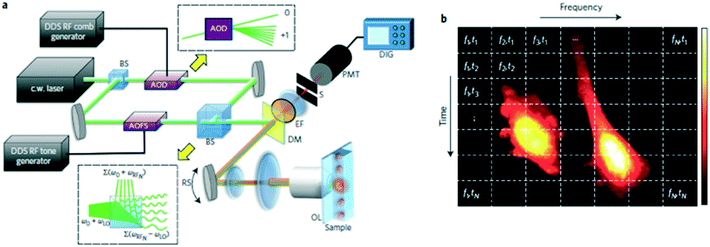 | ||
| Fig. 5 FIRE microscopy. (a) Schematic diagram of the FIRE microscope. BS, beam splitter; AOD, acousto-optic deflector; AOFS, acousto-optic frequency shifter; DM, dichroic mirror; EF, fluorescence emission filter; OL, objective lens; PMT, photomultiplier tube; DIG, 250 MS digital recording oscilloscope; RS, resonant scanning mirror. Upper inset: the AOD produces a single diffracted first-order beam for each radiofrequency comb frequency. Lower inset: beat frequency generation at the MZI output. (b) Gabor lattice diagram of FIRE's frequency-domain multiplexing approach. Points in the same horizontal line are excited in parallel at distinct radiofrequencies. The horizontal line is scanned by a galvo-mirror to acquire a 2D image. Reproduced from ref. 51 with permission from the Nature Publishing Group. | ||
Because the time-domain signal from a FIRE system is a Fourier superposition of the radiofrequency-tagged emission from one row of pixels, a Fourier transform is required in data processing. This can make realization of real-time processing and instant result generation difficult for the system. Besides, the operations of the key components in a FIRE system—AOD and AOFS—are wavelength-dependent, which makes multicolor imaging very challenging. In addition, because this radiofrequency tagging technique is only applied to coherent light sources, the FIRE system is not suitable for bright-field imaging where an LED source is preferred to avoid speckle noise and interference.
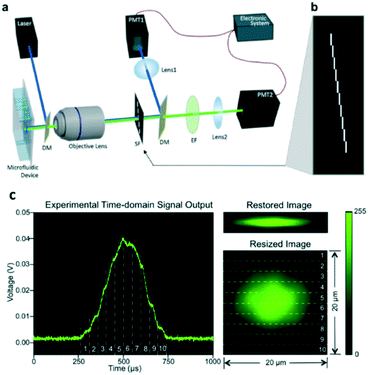 | ||
| Fig. 6 Implementation of spatial–temporal transformation-based IFC. (a) Schematic diagram of the imaging flow cytometer system. DM, dichroic mirror; SF, spatial filter; EF, emission filter; PMT, photomultiplier tube. (b) Spatial filter design that has ten 100 μm by 1 mm slits positioned apart in a way that one is immediately after another in both the x-direction and y-direction. (c) Experimental result: time-domain PMT output signal of fluorescent light from an A549 cell stained with CellTrace CFSE, corresponding original fluorescence image restored using an algorithm, and corresponding resized fluorescence image to show the real size of the cell. The numbered regions segmented by dashed lines demonstrate the correspondence between the time-domain signal and the resulting image. Size is labelled in the figure. Reproduced from ref. 54 with permission from the Nature Publishing Group. | ||
In addition, by adding more PMTs, dichroic mirrors and more light sources, the system has been extended to work in a multi-parameter manner—multicolor fluorescence, bright-field and dark-field imaging. As shown in Fig. 7, two-color fluorescence, transmission and backscattering cell images are demonstrated.
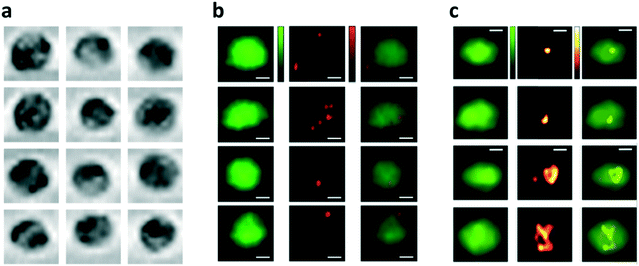 | ||
| Fig. 7 Demonstration of bright-field, two-color fluorescence and backscattering cell images. Scale bars are 5 μm. (a) Bright-field images of MDA-MB-231 human breast cancer cells flowing at 0.2 m s−1. (b) Representative two-color fluorescence images of MDA-MB-231 human breast cancer cells stained with CellTrace CFSE, with 1 μm fluorescent beads attached to the cell membrane, flowing in the microfluidic channel at 0.25 m s−1.47 (c) Representative fluorescence plus backscattering cell images from spatial filter-based imaging flow cytometry. All images are of A549 human lung adenocarcinoma epithelial cells, stained with CellTrace CFSE, flowing at a velocity of 0.2 m s−1. Reproduced from ref. 54 with permission from the Nature Publishing Group. | ||
3. Challenges: high-throughput and real-time image analysis
Apart from the aforementioned challenges of each technique (Table 1), the biggest challenge of IFC lies in acquiring, storing and processing a massive number of cell images.59–61 There are many software packages and tools for use in high-throughput image analysis, mainly for microscopy platforms, including CellProfiler and ImageJ, but in general, the pipelines of these tools are for offline image analysis.62 Fortunately, some of the difficult image processing problems in high-throughput microscopy and LSC can be avoided in IFC. For example, due to cell-to-cell and cell-to-substrate adhesion, strategies for image segmentation such as threshold, watershed and edge-detection have been under development for decades, but still a bottleneck of the automated image analysis in microscopy. This problem has little effect on IFC where the cells are placed in suspension and interrogated on a single-cell basis.63–67 For blood cells, bone marrow cells, and many cancer cells flowing in the blood vessels, IFC is the most promising approach to study their morphological changes.| Features | ImageStream | Multiple-view | Temporally coded excitation | STEAM | FIRE | Spatial–temporal transformation |
|---|---|---|---|---|---|---|
| FC: conventional flow cytometry. | ||||||
| Illumination (spectral range) | Laser | LED | Laser | Pulse laser (near-infrared) | Laser | Laser |
| LED | LED | LED | ||||
| Detector | TDI CCD | CMOS | CMOS | Single-pixel detector | PMT | PMT |
| Modality | Fluorescence | Transmission | Fluorescence | Transmission | Fluorescence | Fluorescence |
| Transmission | Transmission | Phase contrast | Transmission | |||
| Side-scatter | Back-scatter | |||||
| Data transfer & computation complexity | Simple | Simple | Simple | Complex | Complex | Simple |
| Inherit functions from FC | Yes | No | Yes | No | Yes | Yes |
| Compatibility with sorting | No | No | No | No | No | Yes |
| Image resolution | Moderate | Moderate | High | Moderate | High | Moderate |
| Throughput (cells per s) | Up to 1000 | ∼10![[thin space (1/6-em)]](https://www.rsc.org/images/entities/char_2009.gif) 000 000 |
∼2000 | Up to 100![[thin space (1/6-em)]](https://www.rsc.org/images/entities/char_2009.gif) 000 000 |
∼50![[thin space (1/6-em)]](https://www.rsc.org/images/entities/char_2009.gif) 000 000 |
>1000 |
| Real-time processing solution | Yes | No | No | Yes | No | Yes |
| Reference | 32 | 41 | 42 | 45 | 51 | 54 |
Compared to the data format in conventional flow cytometry, including integral, peak and width of light intensity, cell images produced by IFC are much more complex. Since IFC can produce thousands of multi-spectral cell images per second, files generated by IFC can tremendously burden the digital image transportation and processing realized by the back-end data handling unit. Assuming that a field-of-view of 40 μm by 40 μm is represented by an image of 100 pixels by 100 pixels, at least 100 MB data are generated in one second at a throughput of 10![[thin space (1/6-em)]](https://www.rsc.org/images/entities/char_2009.gif) 000 cells per second. Therefore, a test of a few minutes can easily create a data file beyond 10s of GB. For a possible solution, a compressive sensing theory-based method has recently been explored to build analog compression directly into the acquisition process so that the sampling can be significantly more efficient.68,69 Some machine learning techniques can also be applied to data processing for richer information carried out by IFC systems.66,70
000 cells per second. Therefore, a test of a few minutes can easily create a data file beyond 10s of GB. For a possible solution, a compressive sensing theory-based method has recently been explored to build analog compression directly into the acquisition process so that the sampling can be significantly more efficient.68,69 Some machine learning techniques can also be applied to data processing for richer information carried out by IFC systems.66,70
Computational requirements for IFC platforms are unprecedented. All IFC systems demonstrated to date perform image analysis offline. In order to combine cell sorting with IFC to fully realize its tremendous potential, real-time image construction and analysis is required. Hence, the ability to produce, measure, and analyze cell images, and sort cells in a real-time manner will be the next major milestone for IFC. Possible approaches to extract cell characteristics in real time include the use of field-programmable gate arrays (FPGA) or graphics processing units (GPU) to implement various image processing and machine learning algorithms.
4. Conclusion
With the advent of big-data era, life scientists started to grapple with massive volumes of data. Recent advances in high-throughput IFC allow continuous high-throughput capture of cell images. Various technologies have made the generation of multiparametric imaging files highly feasible although efficient analysis and utilization of this huge amount of data remain a challenge. Multimodality (i.e. transmission, scattering and fluorescence), functional flexibility (i.e. operation as conventional flow cytometry or IFC at users' choice), and compatibility with cell sorting are the three principal areas of development for IFC to gain wide acceptance as a workhorse for biomedical research and clinical applications.Acknowledgements
This work was performed in part at the San Diego Nanotechnology Infrastructure (SDNI) of UCSD, a member of the National Nanotechnology Coordinated Infrastructure, which is supported by the National Science Foundation (Grant ECCS-1542148). Research reported in this publication was supported by the National Institute of General Medical Sciences (NIGMS) of the National Institutes of Health under award number R21GM107977 and the National Institute of Biomedical Imaging and Bioengineering (NIBIB) of the National Institutes of Health under award number R43EB021129. The content is solely the responsibility of the authors and does not necessarily represent the official views of the National Institutes of Health. Yuhwa Lo has an equity interest in NanoCellect, Inc., a company that may potentially benefit from the research results, and also serves as a member of the company's Scientific Advisory Board.References
- M. J. Fulwyler, Electronic separation of biological cells by volume, Science, 1965, 150, 910–911 CAS.
- H. R. Hulett, W. A. Bonner, J. Barrett and L. A. Herzenberg, Cell Sorting: Automated Separation of Mammalian Cells as a Function of Intracellular Fluorescence, Science, 1969, 166, 747–749 CAS.
- D. B. Kay, J. L. Cambier and L. L. Wheeless, Imaging in flow, J. Histochem. Cytochem., 1979, 27, 329–334 CrossRef CAS PubMed.
- V. Kachel, G. Benker, K. Lichtnau, G. Valet and E. Glossner, Fast imaging in flow: a means of combining flow-cytometry and image analysis, J. Histochem. Cytochem., 1979, 27, 335–341 CrossRef CAS PubMed.
- J. L. Cambier, D. B. Kay and L. L. Wheeless, A multidimensional slit-scan flow system, J. Histochem. Cytochem., 1979, 27, 321–324 CrossRef CAS PubMed.
- L. A. Kamentsky, Future Directions for Flow Cytometry, J. Histochem. Cytochem., 1979, 27, 1649–1651 CrossRef CAS PubMed.
- S. P. Perfetto, P. K. Chattopadhyay and M. Roederer, Seventeen-colour flow cytometry: unravelling the immune system, Nat. Rev. Immunol., 2004, 4, 648–655 CrossRef CAS PubMed.
- L. A. Herzenberg, et al., The history and future of the Fluorescence Activated Cell Sorter and flow cytometry: A view from Stanford, Clin. Chem., 2002, 48, 1819–1827 CAS.
- N. S. Barteneva, E. Fasler-Kan and I. A. Vorobjev, Imaging Flow Cytometry: Coping with Heterogeneity in Biological Systems, J. Histochem. Cytochem., 2012, 60, 723–733 CrossRef CAS PubMed.
- S. H. Cho, et al., Review Article: Recent advancements in optofluidic flow cytometer, Biomicrofluidics, 2010, 4, 43001 CrossRef PubMed.
- L. Jiang, et al., Monitoring the progression of cell death and the disassembly of dying cells by flow cytometry, Nat. Protoc., 2016, 11, 655–663 CrossRef CAS PubMed.
- O. D. Laerum and T. Farsund, Clinical application of flow cytometry: a review, Cytometry, 1981, 2, 1–13 CrossRef CAS PubMed.
- E. Lugli, M. Roederer and A. Cossarizza, Data analysis in flow cytometry: the future just started, Cytometry, Part A, 2010, 77, 705–713 CrossRef PubMed.
- N. Aghaeepour, et al., Critical assessment of automated flow cytometry data analysis techniques, Nat. Methods, 2013, 10, 228–238 CrossRef CAS PubMed.
- C. E. Pedreira, E. S. Costa, Q. Lecrevisse, J. J. M. van Dongen and A. Orfao, Overview of clinical flow cytometry data analysis: Recent advances and future challenges, Trends Biotechnol., 2013, 31, 415–425 CrossRef CAS PubMed.
- J. V. Forment and S. P. Jackson, A flow cytometry-based method to simplify the analysis and quantification of protein association to chromatin in mammalian cells, Nat. Protoc., 2015, 10, 1297–1307 CrossRef CAS PubMed.
- L. Samsel, et al., Imaging flow cytometry for morphologic and phenotypic characterization of rare circulating endothelial cells, Cytometry, Part B, 2013, 84, 379–389 CrossRef PubMed.
- S. E. Headland, H. R. Jones, A. S. V. D'Sa, M. Perretti and L. V. Norling, Cutting-edge analysis of extracellular microparticles using ImageStream(X) imaging flow cytometry, Sci. Rep., 2014, 4, 5237 CAS.
- Z. Darzynkiewicz, E. Bedner, X. Li, W. Gorczyca and M. R. Melamed, Laser-scanning cytometry: a new instrumentation with many applications, Exp. Cell Res., 1999, 249, 1–12 CrossRef CAS PubMed.
- P. Pozarowski, E. Holden and Z. Darzynkiewicz, Laser Scanning Cytometry: Principles and Applications, Methods Mol. Biol., 2006, 319, 165–192 CAS.
- M. M. Harnett, Laser scanning cytometry: understanding the immune system in situ, Nat. Rev. Immunol., 2007, 7, 897–904 CrossRef CAS PubMed.
- M. Henriksen, Quantitative imaging cytometry: instrumentation of choice for automated cellular and tissue analysis, Nat. Methods, 2010, 7, i–ii Search PubMed.
- P. Pozarowski, E. Holden and Z. Darzynkiewicz, Laser Scanning Cytometry: Principles and Applications--An Update, Methods Mol. Biol., 2013, 931, 187–212 CAS.
- J. A. Hutcheson, et al., A light sheet confocal microscope for image cytometry with a variable linear slit detector, Proc. SPIE, 2016, 9720, 97200U CrossRef.
- M. Oheim, Advances and challenges in high-throughput microscopy for live-cell subcellular imaging, Expert Opin. Drug Discovery, 2011, 6, 1299–1315 CrossRef CAS PubMed.
- H. Zhu, S. Mavandadi, A. F. Coskun, O. Yaglidere and A. Ozcan, Optofluidic fluorescent imaging cytometry on a cell phone, Anal. Chem., 2011, 83, 6641–6647 CrossRef CAS PubMed.
- X. Cui, et al., Lensless high-resolution on-chip optofluidic microscopes for Caenorhabditis elegans and cell imaging, Proc. Natl. Acad. Sci. U. S. A., 2008, 105, 10670–10675 CrossRef CAS PubMed.
- Q. Wei, et al., On-chip cytometry using plasmonic nanoparticle enhanced lensfree holography, Sci. Rep., 2013, 3, 1699 Search PubMed.
- W. Bishara, S. O. Isikman and A. Ozcan, Lensfree optofluidic microscopy and tomography, Ann. Biomed. Eng., 2012, 40, 251–262 CrossRef PubMed.
- M. C. Cheung, B. McKenna, S. S. Wang, D. Wolf and D. J. Ehrlich, Image-based cell-resolved screening assays in flow, Cytometry, Part A, 2015, 87, 541–548 CrossRef CAS PubMed.
- B. K. McKenna, J. G. Evans, M. C. Cheung and D. J. Ehrlich, A parallel microfluidic flow cytometer for high-content screening, Nat. Methods, 2011, 8, 401–403 CrossRef CAS PubMed.
- D. A. Basiji, W. E. Ortyn, L. Liang, V. Venkatachalam and P. Morrissey, Cellular Image Analysis and Imaging by Flow Cytometry, Clin. Lab. Med., 2007, 27, 653–670 CrossRef PubMed.
- K. E. Mcgrath, T. P. Bushnell and J. Palis, Multispectral Imaging of Hematopoietic Cells: Where Flow Meets Morphology, J. Immunol. Methods, 2008, 336, 91–97 CrossRef CAS PubMed.
- I. A. Vorobjev and N. S. Barteneva, Imaging Flow Cytometry Methods and protocols, Springer Science+Business Media, 2016 Search PubMed.
- S. H. Cho, C. H. Chen, F. S. Tsai, J. M. Godin and Y.-H. Lo, Human mammalian cell sorting using a highly integrated micro-fabricated fluorescence-activated cell sorter (microFACS), Lab Chip, 2010, 10, 1567–1573 RSC.
- L. Schmid, D. A. Weitz and T. Franke, Sorting drops and cells with acoustics: acoustic microfluidic fluorescence-activated cell sorter, Lab Chip, 2014, 14, 3710–3718 RSC.
- L. Ren, et al., A high-throughput acoustic cell sorter, Lab Chip, 2015, 15, 3870–3879 RSC.
- C. W. Shields, C. D. Reyes and G. P. López, Microfluidic cell sorting: a review of the advances in the separation of cells from debulking to rare cell isolation, Lab Chip, 2015, 15, 1230–1249 RSC.
- G. S. Elliott, Moving pictures: imaging flow cytometry for drug development, Comb. Chem. High Throughput Screening, 2009, 12, 849–859 CrossRef CAS PubMed.
- EMD Millipore, INSPIRE®, 18, 2012, at <http://www.pedsresearch.org/_files/INSPIRE_User_Manual_MkII_082912.pdf>. Accessed August 2016.
- E. Schonbrun, S. S. Gorthi and D. Schaak, Microfabricated multiple field of view imaging flow cytometry, Lab Chip, 2012, 12, 268–273 RSC.
- S. S. Gorthi, D. Schaak and E. Schonbrun, Fluorescence imaging of flowing cells using a temporally coded excitation, Opt. Express, 2013, 21, 5164–5170 CrossRef CAS PubMed.
- K. Goda, K. K. Tsia and B. Jalali, Serial time-encoded amplified imaging for real-time observation of fast dynamic phenomena, Nature, 2009, 458, 1145–1149 CrossRef CAS PubMed.
- K. Goda, A. Motafakker-Fard, K. K. Tsia and B. Jalali, Serial Time Encoded Amplified Microscopy (STEAM) for high-throughput detection of rare cells, in IEEE Photonics Society Winter Topicals Meeting Series 2, TuB2.2, 2010 Search PubMed.
- K. Goda, et al., High-throughput single-microparticle imaging flow analyzer, Proc. Natl. Acad. Sci. U. S. A., 2012, 109, 11630–11635 CrossRef CAS PubMed.
- E. Huang, Q. Ma and Z. Liu, Ultrafast Imaging using Spectral Resonance Modulation, Sci. Rep., 2016, 6, 25240 CrossRef CAS PubMed.
- A. Mahjoubfar, C. Chen, K. R. Niazi, S. Rabizadeh and B. Jalali, Label-free high-throughput cell screening in flow, Biomed. Opt. Express, 2013, 4, 1618–1625 CrossRef PubMed.
- A. K. S. Lau, H. C. Shum, K. K. Y. Wong and K. K. Tsia, Optofluidic time-stretch imaging – an emerging tool for high-throughput imaging flow cytometry, Lab Chip, 2016, 16, 1743–1756 RSC.
- M. Ugawa, et al., High-throughput optofluidic particle profiling with morphological and chemical specificity, Opt. Lett., 2015, 40, 4803–4806 CrossRef PubMed.
- C. Lei, et al., High-throughput time-stretch microscopy with morphological and chemical specificity, Proc. SPIE, 2016, 9720, 97200X CrossRef.
- E. D. Diebold, B. W. Buckley, D. R. Gossett and B. Jalali, Digitally synthesized beat frequency multiplexing for sub-millisecond fluorescence microscopy, Nat. Photonics, 2013, 7, 806–810 CrossRef CAS.
- H. Mikami, H. Kobayashi, S. Hamad, Y. Ozeki and K. Goda, Ultrafast Confocal Fluorescence Microscopy by Frequency-Division-Multiplexed Multi-Line Focusing, in CLEO AM4O.5, 2016 Search PubMed.
- H. Mikami, et al., Enhanced speed in fluorescence imaging using beat frequency multiplexing, Proc. SPIE, 2016, 9720, 97200T CrossRef.
- Y. Han and Y.-H. Lo, Imaging Cells in Flow Cytometer Using Spatial–Temporal Transformation, Sci. Rep., 2015, 5, 13267 CrossRef CAS PubMed.
- Y. Han and Y.-H. Lo, Imaging flow cytometer using computation and spatially coded filter, Proc. SPIE, 2016, 9720, 972010 CrossRef.
- J. Godin, et al., Microfluidics and photonics for bio-System-on-a-Chip: A review of advancements in technology towards a microfluidic flow cytometry chip, J. Biophotonics, 2008, 1, 355–376 CrossRef CAS PubMed.
- M. E. Piyasena and S. W. Graves, The intersection of flow cytometry with microfluidics and microfabrication, Lab Chip, 2014, 14, 1044–1059 RSC.
- V. K. Jagannadh, M. D. Mackenzie, P. Pal, A. K. Kar and S. S. Gorthi, Imaging flow cytometry with femtosecond laser-micromachined glass microfluidic channels, IEEE J. Sel. Top. Quantum Electron., 2015, 21, 6800106 CrossRef.
- V. Marx, Biology: The big challenges of big data, Nature, 2013, 498, 255–260 CrossRef CAS PubMed.
- M. May, LIFE SCIENCE TECHNOLOGIES: Big biological impacts from big data, Science, 2014, 344, 1298–1300 CrossRef.
- H. T. K. Tse, et al., Strategies for Implementing Hardware-Assisted High-Throughput Cellular Image Analysis, J. Lab. Autom., 2011, 16, 422–430 CrossRef PubMed.
- R. Wollman and N. Stuurman, High throughput microscopy: from raw images to discoveries, J. Cell Sci., 2007, 120, 3715–3722 CrossRef CAS PubMed.
- D. R. Gossett, et al., Hydrodynamic stretching of single cells for large population mechanical phenotyping, Proc. Natl. Acad. Sci. U. S. A., 2012, 109, 7630–7635 CrossRef CAS PubMed.
- Y. Zheng, J. Nguyen, Y. Wei and Y. Sun, Recent advances in microfluidic techniques for single-cell biophysical characterization, Lab Chip, 2013, 13, 2464–2483 RSC.
- K. Galler, K. Bräutigam, C. Grosse, J. Popp and U. Neugebauer, Making a big thing of a small cell--recent advances in single cell analysis, Analyst, 2014, 139, 1237–1273 RSC.
- T. Blasi, et al., Label-free cell cycle analysis for high-throughput imaging flow cytometry, Nat. Commun., 2016, 7, 10256 CrossRef CAS PubMed.
- C. L. Chen, et al., Deep Learning in Label-free Cell Classification, Sci. Rep., 2016, 6, 21471 CrossRef CAS PubMed.
- B. T. Bosworth and M. A. Foster, High-speed ultrawideband photonically enabled compressed sensing of sparse radio frequency signals, Opt. Lett., 2013, 38, 4892–4895 CrossRef PubMed.
- B. T. Bosworth, et al., Continuous high-rate photonically-enabled compressed sensing (CHiRP-CS) for high speed flow microscopy, Imaging Appl. Opt., OSA Technical Digest (online), Optical Society of (2015) Search PubMed.
- A. C. Zhang, et al., Computational cell analysis for label-free detection of cell properties in a microfluidic laminar flow, Analyst, 2016, 141, 4142–4150 RSC.
| This journal is © The Royal Society of Chemistry 2016 |
