 Open Access Article
Creative Commons Attribution 3.0 Unported Licence
The microfluidic lighthouse: an omnidirectional gradient generator†
A.
Nakajima
a,
M.
Ishida
b,
T.
Fujimori
b,
Y.
Wakamoto
 ab and
S.
Sawai
*abc
aResearch Center for Complex Systems Biology, Graduate School of Arts and Sciences, The University of Tokyo, Komaba, Meguro-ku, Tokyo 153-8902, Japan. E-mail: cssawai@mail.ecc.u-tokyo.ac.jp
bDepartment of Basic Science, Graduate School of Arts and Sciences, The University of Tokyo, Japan
cPRESTO, Japan Science and Technology Agency, Kawaguchi-shi, Saitama 332-0012, Japan
First published on 5th October 2016
Abstract
Studies of chemotactic cell migration rely heavily on various assay systems designed to evaluate the ability of cells to move in response to attractant molecules. In particular, the development of microfluidics-based devices in recent years has made it possible to spatially distribute attractant molecules in graded profiles that are sufficiently stable and precise to test theoretical predictions regarding the accuracy and efficiency of chemotaxis and the underlying mechanism of stimulus perception. However, because the gradient is fixed in a direction orthogonal to the laminar flow and thus the chamber geometry, conventional devices are limited for the study of cell re-orientation to gradients that move or change directions. Here, we describe the development of a simple radially symmetric microfluidics device that can deliver laminar flow in 360°. A stimulant introduced either from the central inlet or by photo uncaging is focused into the laminar flow in a direction determined by the relative rate of regulated flow from multiple side channels. Schemes for flow regulation and an extended duplexed device were designed to generate and move gradients in desired orientations and speed, and then tested to steer cell migration of Dictyostelium and neutrophil-like HL60 cells. The device provided a high degree of freedom in the positioning and orientation of attractant gradients, and thus may serve as a versatile platform for studying cell migration, re-orientation, and steering.
Introduction
Gradients of diffusible and adhesive molecules serve as guiding cues for the directional movement and polarization in a wide variety of moving cells. In wound healing, the migration of fibroblasts is coordinated by gradients of growth factors.1 During inflammation in the lymph nodes and damaged tissues, neutrophils swarm and aggregate towards peptide and chemokine sources.2,3 Migration of tumour cells towards growth factors is thought to play a critical role in the spreading of cancer.4 It is widely accepted that these motile cells determine the direction of their movement based on spatial differences in the concentration of attractant molecules.5,6 In addition, chemotaxis of fast-moving cells such as Dictyostelium and neutrophils also appear to use temporal components of the signal cues. Although less understood compared to gradient sensing, the ability of these cells to move towards chemoattractants depends on whether the concentration is increasing or decreasing over time.7–10 This is best exemplified in Dictyostelium, where cells aggregate by moving towards the incoming waves of extracellular cAMP by responding to the front but not to the waveback. A recent study11 demonstrated that the ability of Dictyostelium cells to distinguish the wavefront and waveback is largely dictated by temporal changes in chemoattractant concentration occurring on a specific time scale. In neutrophils, although evidence is more limited, the chemotactic response also appears to be differentially regulated according to whether the chemoattractant concentration is increasing or decreasing over time.12–14 In order to further evaluate these properties, a system for precisely and reproducibly manipulating attractant profiles in time and space is required.Recent progress in microfluidics and micro- and nano-devices has vastly improved the precision and ease by which one can generate and control a gradient stimulus in time and space.15,16 In the so-called pyramidal or ‘Christmas-tree’ gradient generator,17 the source attractant and diluent are mixed in a series of bifurcating channels so that the final concentrations of the attractant from the neighbouring channels will be linearly graded in space. The design has been extended to parallel two pyramidal mixers that allow switching between independent gradients to include dynamic gradients.18 Another avenue of development is based on the use of a Y-junction (2-inlet/1-outlet).19,20 Here, the source attractant and diluent buffer are supplied from the inlets so that a gradient is formed by diffusion of the molecules between the two layers of laminar flow. Using a two-layer Y-junction system, a convection-based gradient generator21 was developed in which time-variable gradients formed by adjacent laminar flow in the top layer were allowed to diffuse to the lower layer through discrete holes. Similar in design is the triple-junction chamber (3-inlet/1-outlet), in which the slope of a bell-shaped gradient can be controlled by focusing the laminar flow.11,22,23 By changing the relative flow rates from the side ports, the focused flow is bent such that the bell-shaped gradient traverses one direction. These devices allow a gradient to be simply turned on or off, reversed, or displaced in the form of a traveling wave.
Whether forming a static or dynamic gradient, the caveat of the flow-based devices described above is that the gradient must always face the transversal direction; i.e. perpendicular to the flow (θ = 0° or 180°). Thus, gradient-generating devices cannot be used to examine the re-orientation and steering of cell migration, where the position and orientation of an applied gradient must be carefully coordinated in relation to the pre-existing cell polarity and pseudopodial extensions.24 This geometrical constraint can be partially circumvented in a multi-directional flow device (8-inlet/8-outlet),25 where a stimulus flow can be pointed in 8 discrete directions from the centre of the chamber (θ = 0°, ±45°, ±90°, ±135°, 180°), allowing one to switch between gradients at an acute angle of 45°. Using this device design, a gradient cannot be presented at an arbitrary position and its orientation is limited. More recently, floating microfluidics devices have been reported.14,26 Because changing the gradient position requires displacement of the device, a transient disturbance in the flow profile and hence the gradient profile is difficult to avoid.26 Alternatively, an advection-based device with 3 inlets27 in principle can generate gradients facing θ = 0°, 120°, 240°, and intermediate angles during transient source switching. The device is well suited for studying cells that are not compatible with flow, such as bacteria or cells with high sensitivity to shear. In contrast, because generation and dissipation of a gradient is based on diffusion, the switching is gradual, requiring approximately 1 h for a full 360 degree rotation. A more classic approach using an attractant-filled glass needle is perhaps the most versatile when it comes to generating a gradient in an arbitrary direction. However, gradient re-orientation requires re-positioning of the needle, which introduces fluctuations in the concentration profile. Resetting of a gradient relies on passive diffusion and thus, is slow compared to flow-based methods (Fig. S1, ESI†).
Here, we report the development of a ‘microfluidic lighthouse’, a simple radial flow chamber that can freely orient laminar flow in all 360° in a two-dimensional plane. The device allows for continuous control of the concentration gradient direction on the timescale of seconds to minutes, making it possible to study the ability of cells to re-orient towards a gradient presented in an arbitrary direction. The main highlights of the new device are: 1) gradients can be delivered to and from any direction in the observation area and the direction can be changed within 30 s with high precision, 2) a bell-shaped gradient of a conserved shape can be propagated repeatedly along a circular trajectory with a fixed angular velocity requiring no more than 2 min to complete one rotation, and 3) gradients approaching from reversed angles of choice between approximately ±0 to ±90 degrees can be generated either by combining the core device with a flow photolysis approach or by using a duplexed device.
Results and discussion
Basic design and operation
The device consists of two layers of fabricated polydimethylsiloxane (PDMS) attached to a glass coverslip (Fig. 1a). An observation chamber where gradients will be formed is composed of a circular space in the lower layer that is sealed with the coverslip (Fig. 1a; blue). The upper layer constitutes feeding channels with four end ports positioned at the ceiling of the chamber (Fig. 1a; red). At the other end of the feeding channels, tubings are connected for fluid loading (Fig. 1a; red) from syringe pumps or a multi-channel pressure regulator. The internal height of the chamber and channels is 100 μm. The three ports (Ch. 1–3) form an equilateral triangle whose centre is positioned at the centre of the chamber (Fig. 1a). In the basic design, port 4 (Ch. 4) is positioned exactly at the centre of the chamber. The underlying aim of the device design is to deliver a stimulus solution from the centre of the chamber and direct it in radially. A solution containing bioactive molecules such as chemokines and growth factors is loaded from port Ch. 4 (‘stimulus stream’) at a low feeding rate so as to not disrupt the flow field. The fluid loaded from ports Ch. 1–3 controls the flow field and will hereafter be referred to as the ‘control stream’.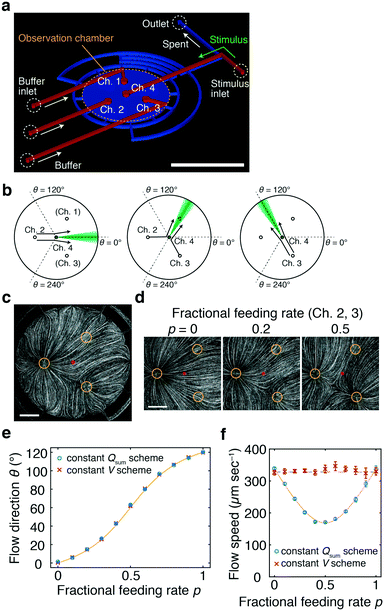 | ||
| Fig. 1 Microfluidic-lighthouse. a) Device design. The upper layer (red) constitutes 4 inlet channels for fluid loading (200 μm width). The lower layer (blue) forms an observation chamber (6 mm diameter). The chamber and channel heights are 100 μm. A multiport pressure device and/or syringe pumps are connected by tubings to the inlet channels (buffer/stimulus inlets) for fluid delivery. The inlet channels merge into the observation chamber through 500 μm diameter channel ports (Ch. 1–4). The fluid exits the 12 equi-positioned flow channels of 200 μm width located in the chamber sidewall and converges into a single outlet channel (outlet). Scale bar, 5 mm. b) Schematic illustration of flow control. Channel port positions in the chamber (Ch. 1–4, circles). Stimulus stream (green). c) Flow field in the chamber visualised by fluorescent beads. The fluid is fed from Ch. 2 and 3 at the fractional feeding rate p = 0.2. Channels 1–3 (yellow circles) and the centre of the chamber (red dot). Scale bar, 1 mm. d) Flow field near the chamber centre; p = 0 (left panel), 0.2 (middle panel), and 0.5 (right panel) (Qsum = 10 μL min−1). e and f) The direction (e) and speed (f) measured by PIV for the constant Qsum scheme (blue) and for the constant V scheme (eqn (3); Qc = 10 μL min−1) (red). A theoretical curve of the flow direction (eqn (1)) (e; yellow line) and flow speed for the constant Qsum scheme (eqn (2)) (f; yellow line). The average flow speed at p = 0 and 1 (f; black dashed line). The mean ± S.D. are plotted. Channel 4 was not opened for flow field measurements. | ||
By design, the stimulus molecules loaded from the centre (Ch. 4) is carried in a direction defined by the control stream (Fig. 1b). In this study, flow from not more than two control channels is regulated in concert at any given time. For example, when the control stream is applied from a single port such as Ch. 2 (or Ch. 3), the stimulus stream will be directed away from Ch. 2 (or Ch. 3) (Fig. 1b; left and right panels). When the control stream is fed from two ports, Ch. 2 and 3, the stimulus is directed towards an angle formed between lines passing through Ch. 2 and 4 and through Ch. 3 and 4 (Fig. 1b; middle panel). From the superposition of control streams from two ports (see Materials and methods for details; Fig. S2, ESI†), the direction θ of the flow at the chamber centre can be described by
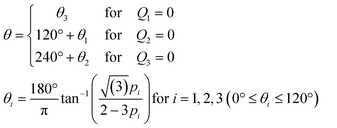 | (1) |
If the total feeding rate of the control stream Qsum (≡ Q1 + Q2 + Q3) is conserved (e.g. for Ch. 2 and 3, Qsum = Q2 + Q3 = Qc), the speed of the control stream at the chamber centre is described by
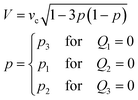 | (2) |
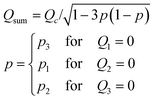 | (3) |
To validate the operating principle, the flow field in the observation chamber was visualised using fluorescent microbeads (Fig. 1c). Fig. 1d shows that the flow was directed towards θ = 0°, 14°, and 60° at p (= p3 = Q3/(Q2 + Q3)) = 0, 0.2, and 0.5, respectively, as designed. The flow field was also evaluated for continuously increasing p. Here, p was increased from 0 to 1 by either fixing the sum of the feeding rate Qsum (eqn (2)) or the flow speed at the centre V (eqn (3)). Fig. 1e and f summarise the direction and speed of the fluid calculated from particle image velocimetry (PIV). As expected, the flow direction changed by a total of 120° when p was varied from 0 to 1 (Fig. 1e). The flow direction θ at the centre of the chamber was in close agreement with the theoretical curve (Fig. 1e; yellow line). For the constant Qsum scheme, the flow speed depended non-monotonically on p and reached a minimum value at p = 0.5 with a variation (standard deviation/mean) of 25% (Fig. 1f; blue) in accordance with eqn (2) (Fig. 1f; yellow line). In contrast, in the constant V scheme, the flow speed did not vary by more than ±2% around the mean (Fig. 1f; red).
We next measured how the stimulus loaded from Ch. 4 would distribute in the chamber. A phosphate buffer solution was loaded from Ch. 2 and 3 and a fluorescein solution was loaded from Ch. 4 as a mock stimulus for visualization (Fig. 2). As expected from the flow field (Fig. 1c and d), the stimulus was directed to the right, upper-right, upward, and upper-left (θ = −2.5°, 22.0°, 94.5°, and 124°) for p = 0, 0.3, 0.7, and 1, respectively (Fig. 2a). In total, the direction of the stimulus flow changed by approximately 120° when p was varied from 0 to 1 (Fig. 2b; blue), showing good agreement with the theoretical curve (Fig. 2b; red curve). The profile of the stimulus stream depended on p for the constant Qsum scheme (Fig. 2c). At p = 0.5, the flux of the control stream at the chamber centre is minimal due to cancelation of opposing flows from two control channels. Due to this effect, the peak intensity of the spatial profile was maximal at p = 0.5. The variation (standard deviation/mean) of the peak intensity and slope of the gradient were 14% and 18%, respectively. In contrast, for the constant V scheme (eqn (3)), the profile of the stimulus stream was much less dependent on p (Fig. 2d). The variations in the peak intensity and gradient slope were 9% and 11%, respectively. Because of the rotational symmetry of the device, the same operation can be performed for Ch. 3 and 1 and for Ch. 1 and 2, thereby allowing the stimulus stream to be directed outwardly from the centre in any of the 360°. The accompanying spatial gradient faces the tangential direction and its spatial profile is nearly constant.
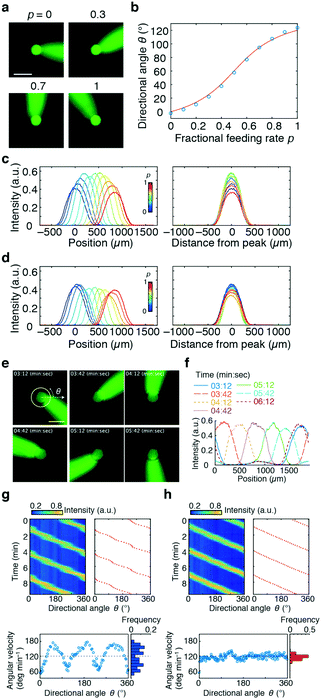 | ||
| Fig. 2 Lateral and cross-sectional profiles of the stimulus flow (a–d) and rotating stimulus waves (e–h). Fluorescein was loaded from Ch. 4 as a mock stimulus. a) Snapshots of the stimulus stream directed by the control flow from Ch. 2 and 3; fractional feeding rate p = 0 (top left), 0.3 (top right), 0.7 (bottom left), and 1.0 (bottom right). The scale bar represents 500 μm. b) Flow direction plotted as a function of p (blue circles) and the theoretical curve (red line; eqn (1)). c and d) Gradient profiles of the stimulus in the direction perpendicular to the flow; constant Qsum scheme (Qsum = 10 μL min−1) (c) and constant V scheme (eqn (3); Qc = 10 μL min−1) (d). Feeding rate of the stimulus flow: Q4 = 0.25 μL min−1. Tangential profiles of fluorescence intensities along the 400 μm radius from Ch. 4. Concentration profiles at various p (left panel). The profiles were centre-aligned at the peak (right panel). e) Snapshots of the stimulus waves rotating in an anti-clockwise direction for a period of 3 min. Scale bar, 500 μm. f) Gradient profiles of the rotating stimulus flow. Fluorescence intensity along the 300 μm radius from the centre of the chamber (yellow circle in Fig. 2e). g and h) Angular variation of rotating waves. Time–angle plot of stimulus concentration (upper left panel; pseudo-colour) and angular direction of its peak (upper right panel; red dots). Relationship between angle and angular velocity (lower left panels) and distribution of angular velocity (lower right panels). p changed linearly over time (g) or followed eqn (4)) (h. Qsum was held constant (Qsum = 20 μL min−1). Q4 = 0.5 μL min−1. | ||
Dynamic regulation of the stimulus
We next tested how well the laminar flow could be rotated continuously in time. To this end, pi was changed from 0 to 1 sequentially for one channel pair at a time (in the order of Ch. 2 and 3, Ch. 3 and 1, and Ch. 1 and 2). Because of the triangular configuration, for each pair, the laminar flow will turn by 120°. Fig. 2e shows snapshots of the resulting laminar flow for a single rotation (Movie S1, ESI†). The bell-shaped concentration gradient formed in the direction perpendicular to the flow direction and its time evolution along the circumference of a chamber-centred circle highlights the traveling-wave nature of the applied stimulus (Fig. 2f). In the examples shown in Fig. 2g and h, pi was increased from 0 to 1 in 1 min, for a full rotation in 3 min. When p was varied linearly over time (dp/dt = cp = 1 (min−1), the angular velocity ω(t) depended on the orientation (Fig. 2g; upper panels) and exhibited three peaks (Fig. 2g; lower panel) originating from the triangular port arrangement. More specifically, from eqn (1), | (4) |
 . Conversely, the direction of the stimulus flow can be rotated at a constant angular velocity (i.e. ω(t) = ω0 = const.) by cancelling out the p dependence by setting cp = f−1(p) (Fig. 2h; upper and lower panels). The distribution of the angular velocity exhibited a single peak near the expected value ω0 (= 120° min−1), in marked contrast to the bimodal distribution when p was increased linearly over time (Fig. 2g). The variation in the angular velocity was less than 10% (mean ± s.d. = 117° ± 10° min−1).
Use of the device with caged compounds
Rather than applying a stimulus from the centre port, the device can be used in conjunction with a flow photolysis approach.28 To demonstrate this, a phosphate buffer solution containing CMNB-caged fluorescein was introduced from Ch. 1–3 (Fig. 3a; left panel). In this experiment, there was no Ch. 4 in the device. Illumination with UV light at the centre of the chamber generated a stream of uncaged fluorescein (Fig. 3a; right panel; Movie S2, ESI†). The liberated stream of uncaged molecules can be oriented in the same manner as the stimulant injected from the centre port. As described above, the p-dependence of the flow direction closely followed the theoretical curve (Fig. 3b). Similarly, the peak position of the fluorescence intensity profile varied depending on p (Fig. 3c and d). When p was varied under the constraint of flow conservation (the constant Qsum scheme), the maximum value and thus the gradient profile became variable (the variances were 39% and 41% for the peak intensity and gradient, respectively) and reached a maximum value at p = 0.5 (Fig. 3c). In contrast, for the constant V scheme (eqn (3)), the peak intensity and gradient were generally constant with variations of no more than 5% and 6%, respectively. A rotating wave can also be generated following the same procedure described above (Fig. S3a, ESI†). Using a flow photolysis approach, the width of the concentration gradient can be changed from the size of a cell (10 μm) to more than 100 μm by increasing the size of the irradiated region. This approach provides a convenient means for altering the spatial profile (Fig. S3b, ESI†).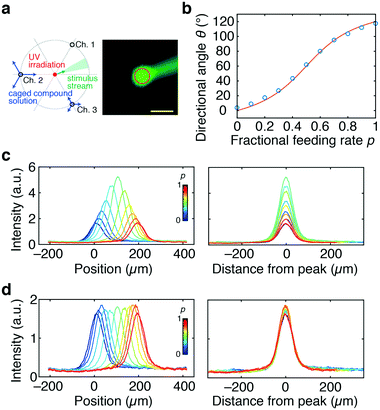 | ||
| Fig. 3 Formation of a stimulus stream by uncaging. a) Schematic illustration of the stimulus control (left panel) and a representative confocal microscopy image (right panel). A device without Ch. 4 was employed. A CMNB-caged fluorescein solution was introduced from Ch. 2 and 3. UV light was irradiated at the centre (right panel; red circle). Scale bar, 100 μm. b) Directional angle of the stimulus stream plotted against p (blue circles). Theoretical curve (red line; eqn (1)). c and d) Tangential profiles of the stimulus along the 100 μm radius from the centre of the light irradiation area; constant Qsum scheme (Qsum = 10 μL min−1) (c) and constant V scheme (eqn (3); Qc = 10 μL min−1) (d). Spatial profiles of the stimulus (left panel). The profiles are aligned at the peak (right panel). | ||
Another advantage of the flow photolysis approach is that stimulus injection is not restricted to a fixed position and can be changed rapidly. Thus, gradient patterns in alternating directions can be presented in a region of interest (Fig. 4a). In the demonstration shown, the stimulus was first generated at the lower left-hand side corner of the observation area (Fig. 4a and b; upper panels). The area of light irradiation was switched from the lower left to the upper left-hand side corner (Fig. 4a and b; lower panels). Executing this together with changes in the flow direction (θ = 0° → 45° → 0° → −45° → 0°), concentration gradients alternating between two orthogonal directions were presented to the target site in the observation area (Fig. 4b–d; Movie S3, ESI†). Note that the position of UV irradiation can be off-centred; the direction of the stimulus flow did not deviate significantly (<17°) from the theoretical curve for uncaging positions within the 300 μm radius from the chamber centre (Fig. S4a and b, ESI†). Note, however, that because deviation from the target angle does increase monotonically as a function of distance from the centre (Fig. S4c, ESI†), the irradiation position should be chosen carefully so as to meet the precision of the gradient orientation required in one's experiments.
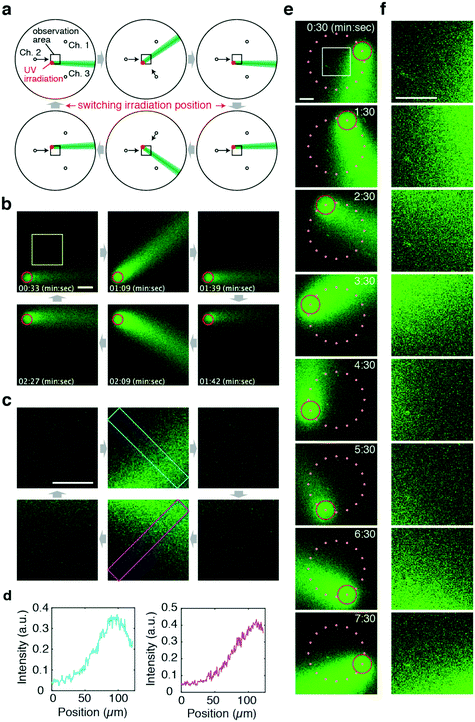 | ||
Fig. 4 Generation of alternating gradients with flow photolysis. a) Schematic illustration of the operation. A CMNB-caged fluorescein solution was introduced from Ch. 1–3. UV light was applied to areas indicated in red. The arrows show the direction of the control flow. The flow of uncaged fluorescein is illustrated in green. b and c) Confocal images of the uncaged stimulus stream (green) obtained at the observation areas (black squares in a) (b), and their magnified images in the yellow square region in b (c). The red circles indicate the area of UV light application. Scale bars, 50 μm. d) Cross-sectional profile of uncaged fluorescein obtained from the left top corner to the right bottom corner (cyan box in the upper middle panel in c) and from the left bottom corner to the right top corner (magenta box in the lower middle panel in c). Qsum was held constant (Qsum = 11 μL min−1). e and f) A concentration gradient can be developed in arbitrary directions by positioning of the uncaging UV spot on a circle (red). Snapshots from confocal time-lapse imaging of an entire field of view (e) and magnified images (f) obtained from the white square (panel t = 0![[thin space (1/6-em)]](https://www.rsc.org/images/entities/char_2009.gif) : :![[thin space (1/6-em)]](https://www.rsc.org/images/entities/char_2009.gif) 30). UV light was irradiated at 16 discrete positions (orange dots) on a 200 μm radius circle surrounding the region of interest (white square). UV light irradiation was switched to the next site every 30 s in a counter-clockwise direction. The flow direction was rotated in a counter-clockwise manner at 8 min per rotation following eqn (4) with a fixed Qsum = 6 μL min−1. Scale bars represent 100 μm. 30). UV light was irradiated at 16 discrete positions (orange dots) on a 200 μm radius circle surrounding the region of interest (white square). UV light irradiation was switched to the next site every 30 s in a counter-clockwise direction. The flow direction was rotated in a counter-clockwise manner at 8 min per rotation following eqn (4) with a fixed Qsum = 6 μL min−1. Scale bars represent 100 μm. | ||
To demonstrate the versatility of this approach, Fig. 4e and f show examples of more complex stimulus patterns with multiple positions of UV irradiation. Here, UV was irradiated at one of 16 positions located on a circle surrounding a region of interest (Fig. 4e). UV light was irradiated at one position for 30 s then switched to the next site in a counter-clockwise order. Simultaneously, the flow direction was rotated in a counter-clockwise direction at a rate of 8 min per rotation. In this manner, a gradient stimulus facing a direction of choice can be presented to any point of interest as long as it is within the area of the present flow control (Fig. 4f).
A duplexed device
From the operating principle, the triangular 3 + 1 channel configuration, the ‘lighthouse’ (Fig. 1), can serve as a basic module that can be multiplexed to apply laminar flow from multiple sources to a site of interest. The simplest implementation of this idea is a duplexed device involving the fusion of two basic modules with a double 3 + 1 channel configuration (Fig. 5a). The configuration of the inlets for the control stream (Ch. 1–4) takes the form of a diamond shape where two trigonal modules share two ports; one module is composed of Ch. 1, 2, and 4, while the other is composed of Ch. 2–4. The stimulus inlets (Ch. 5 and 6) were located at the centres of each module. The duplexed device allows for the delivery of gradients at a site of interest from multiple directions. By performing directional flow control similar to that described in previous sections (Fig. 5b), the concentration gradients were generated in alternation from two source inlets, Ch. 5 and 6 (Fig. 5b; Movie S4, ESI†). The fact that the incident angle of the stimulus flow depends on the observation position may become an issue when one needs to apply the same exact stimulus to a great number of cells. On the other hand, this very feature could also be exploited. Based on the choice of the observation position within the chamber, the presented gradients can alternate between reversed angles of ±0° to ±90°; the example shows ±0° (Fig. 5c; ROI1), ±45° (Fig. 5c; ROI2), and ±90° (Fig. 5c; ROI3). Although the shape of the gradient is restricted to the size of the inlet holes, the device may be useful in cases where caged-compounds for stimulant molecules are not easily obtainable.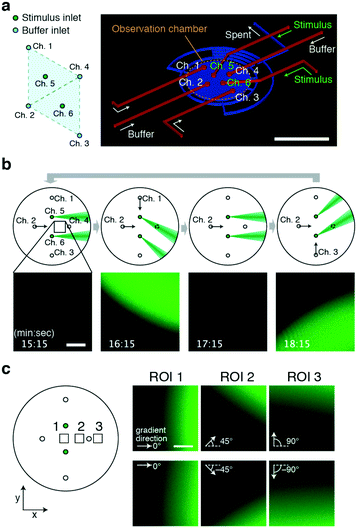 | ||
| Fig. 5 Generation of alternating gradients by a 6-port duplexed device. a) Port configuration (left) and top view of the chamber (right). Scale bar, 5 mm. The device design follows that of the core module (Fig. 1) except for the number and position of the inlet channels. b) Reciprocal stimuli presented from two orthogonal directions. Schematic illustrations of operation (upper panel). Confocal microscopy images of fluorescence intensity (lower panel) of the black square region (upper panel). Stimulus stream (green). A fluorescein solution was loaded from Ch. 5 and 6 as a mock stimulant. The gradient position and orientation were switched every 2 min by changing the flow direction (θ = 0° → −45° → 0° → 45° → 0°) with a constant Qsum scheme (Qsum = 10 μL min−1). Q5 = Q6 = 0.25 μL min−1. The control flow was from Ch. 2 alone (leftmost panels; Q2 = 10 μL min−1, Q1 = Q3 = 0 μL min−1), Ch. 1 and 2 combined (middle left panels; Q1 = Q2 = 5 μL min−1, Q3 = 0 μL min−1), Ch. 2 alone (middle right panels), and Ch. 2 and 3 combined (Q2 = Q3 = 5 μL min−1, Q1 = 0 μL min−1). Scale bar, 200 μm. c) Alternating gradients are presented at an angle of 0–180° depending on the position of the observation area (left panel; the black squares are the regions of interest (ROI) 1, 2, and 3). Confocal images of the fluorescein profile (right panel). The stimulus stream and its gradient from Ch. 5 (upper right panels) and from Ch. 6 (lower right panels). The examples shown are alternating gradients with reciprocal angles of 0°, 90°, and 180° at x = −0.3 mm (ROI 1), x = 0.45 mm (ROI 2) and x = 2.0 mm (ROI 3) from the centre of the chamber, respectively. Scale bar, 100 μm. | ||
Chemotaxis towards a traveling-wave stimulus and steering of cell migration
For the demonstration of a basic lighthouse device (Fig. 1), Dictyostelium chemotaxis was studied using cAMP as a stimulus and the flow scheme is shown in Fig. 6a. Cells of interest in ‘Region 1’ within a distance of 1.0 mm from Ch. 4 experienced a local bell-shaped gradient that propagated at 2 × 102 μm min−1 over a 6 min period, which is close to the naturally occurring stimulus profile in this organism.29–31Fig. 6b shows the trajectories of cells that were well-separated from each other. As the wavefront approached, cells moved in a direction opposite of the wave propagation and there was no reorientation of cell movement at the waveback (Fig. 6b and c, left panel). There was no apparent bias in cell displacement orthogonal to the gradient (Fig. 6c right panel) nor was there any systematic bias of cell movement in the absence of cAMP (Fig. 6d and e). Interestingly, as the waves were repeated, the cells began to exhibit a biphasic motion in the same direction at the wavefront and at the waveback (Fig. 6f). The observation suggests that the difference in the behaviour reported earlier – stalling in the waveback11versus more persistent movement23 originates from whether the cells experienced a single wave passage11 or multiple waves.23 While the ability to apply wave gradients repetitively is derived naturally from the rotational feature of the present device, there may be some advantages over 1-D wave generators. Using the same 1-D set-up as in the references,11,32 at a flow speed sufficiently slow to avoid a shear-stress-induced cell response, a total of 60 s more or less was required to erase the prior stimulus so as not to introduce unwanted transients while bringing the laminar flow back to the initial position (Fig. S5, ESI†). A similar erasure time was reported by Skoge et al.23 In the lighthouse, the erasure time can be shortened by fast-forwarding the rotation encompassing the region outside of interest, thereby actively diverting the stimulus from the region of interest. This operation is unique to the present device and geometrically distinct from that in 1-D wave generators where the laminar flow position must be reversed back along the same axis. Under shear-stress conditions comparable to those in the linear devices, the erasure time can be as short as 10 s (Fig. S5, ESI†). Since the erasure time puts a constraint on how frequent one can apply waves without speeding up the wave velocity or shrinking the bell-shaped gradient, we envisage that the device would help delineate the effect of wave velocity, wave frequency and stimulus duration, which are pivotal to further decipher chemotaxis mechanisms.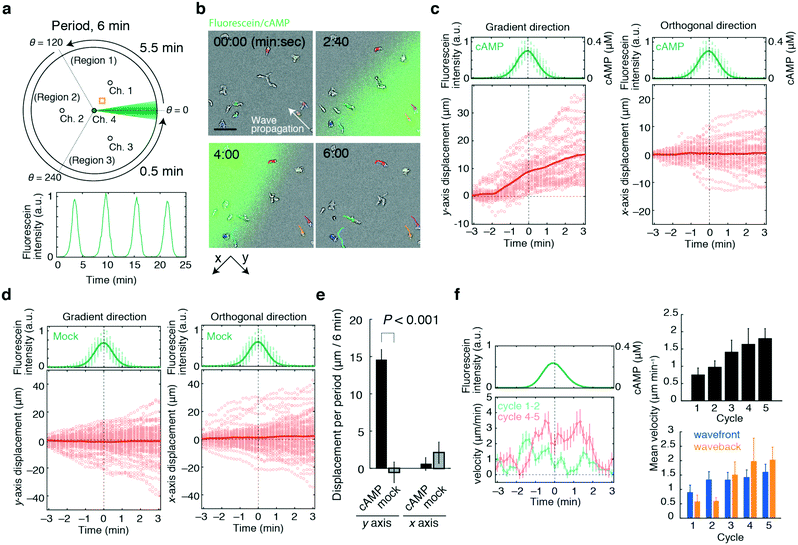 | ||
| Fig. 6 Device application to cell migration analysis. Migration of Dictyostelium cells towards rotating waves of chemoattractant cAMP. a) Generation of cAMP waves rotating in a counter-clockwise direction over a period of 6 min. Schematic diagram of the operation (upper panel) and temporal change in the cAMP level (lower panel). The yellow square (upper panel) indicates the observation area. PB containing the adenylyl cyclase inhibitor SQ22536 (50 μM)40,41 was loaded from Ch. 1–3. PB containing 1 μM cAMP, 50 μM SQ22536, and 10 or 30 μM fluorescein was loaded from Ch. 4. Cells of interest were chosen from within 1.0 mm of Ch. 4 in ‘Region 1’ (0° ≤ θ ≤ 120°). In Region 1, regulated flow (eqn (3)) from Ch. 2 and 3 was applied to form a bell-shaped gradient that moved at an angular velocity of 21.8° min−1 using a constant V scheme (Qc = 5 μL min−1 and Q4 = 0.125 μL min−1) over 5.5 min. Next, flow was applied towards ‘Region 2’ (120° ≤ θ ≤ 240°) and then ‘Region 3’ ( 240° ≤ θ ≤ 360°) to complete the rotation. The rate of flow from Ch. 3 and 1 or Ch. 1 and 2 was changed in a total of two (or four) discrete steps so that the direction changed from 120° to 240° (120° to 180° and 180° to 240°), and 240° to 360° (240° to 300° and 300° to 360°) over 0.5 min (Qsum = 5 μL min−1). b) Composite snapshots of transmitted light images of migrating cells (grey) and confocal images of the cAMP wave (green; fluorescein). The trajectories of representative cells are indicated in coloured lines (n = 7). Direction of wave propagation (white arrow). The scale bar represents 50 μm. c and d) Cell displacement per wave cycle; 1 μM (c) and no cAMP (d) at the source. The fluorescein intensities at each cell position (upper panels; green dots) and their average values (upper panels; green solid lines). Fluorescein (MW = 329) has a molecular weight close to that of the attractant cAMP (MW = 332), thus its fluorescence intensities (upper panels; left axis) were used to estimate the cAMP levels (upper panels; right axis). Displacement of the cells in the gradient direction (y-axis in panel b) (lower left panels) and the orthogonal direction (x-axis in panel b) (lower right panels). Displacement of individual cells from 4 to 6 cycles of the periodic wave stimulus (circles; n = 32 and 71 for c) and d) respectively) and their sample average values (red solid lines). The time frame of the data were aligned to the wave peak time (t = 0). The flow condition in c is the same as in b. The flow parameters in d were set as Q4 = 0.25 μL min−1, Qc = 10 μL min−1 for 0° ≤ θ ≤ 120° and Qsum = 10 μL min−1 for 120° ≤ θ ≤ 360°. e) The mean cell displacement calculated from the data shown in c) and d). The statistical test for the difference in the means of cAMP and mock wave stimulus conditions yielded P-value = 2.78 × 10⁻¹¹ and 0.075 for the displacement in the y- and x-directions, respectively (Welch's t-test). The error bars indicate the s.e.m. f) The average instantaneous velocity (left panel). The average cell velocity plotted as a function of the wave cycle (right upper panel). The average cell velocity in the wavefront (right lower panel; blue) and waveback (right lower panel; orange) at each wave cycle. The error bars indicate the s.e.m. (n = 18, 20, 22, 21, and 19 for cycles 1, 2, 3, 4, and 5, respectively). The flow conditions were Q4 = 0.25 μL min−1, Qc = 10 μL min−1 and Qsum = 10 μL min−1. | ||
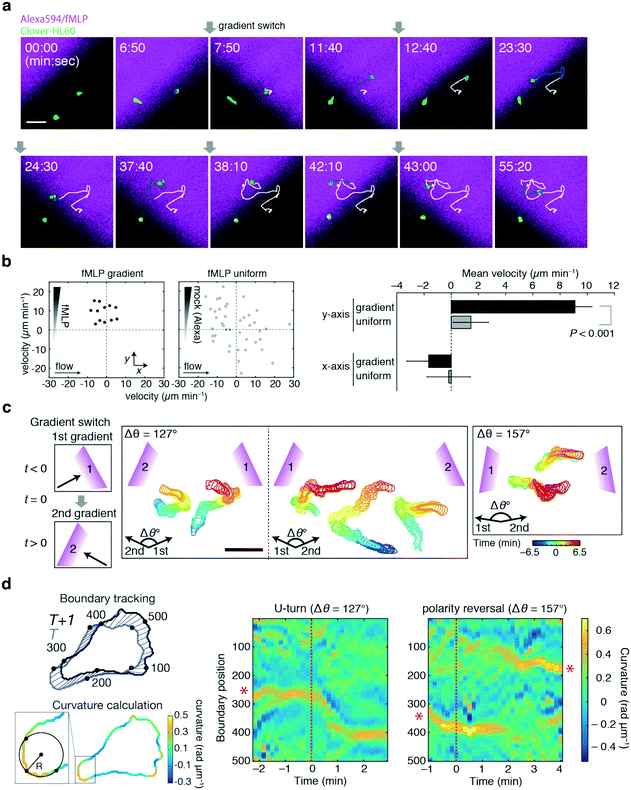
For the demonstration of the duplexed device, neutrophil-like HL60 cells were employed using the chemoattractant peptide N-formyl-met-leu-phe (fMLP) as a stimulus. Here, the cells of interest were those in an area indicated by the black boxes in Fig. 5b and c. The feeding rates of Ch. 1 and 3 were controlled manually in a stepwise fashion to switch the gradient direction. Fig. 7a shows a representative trajectory of a cell responding to alternating gradients of fMLP. By switching the direction of the gradients by 90°, the HL60 cells reoriented and migrated in the direction of higher fMLP concentrations within a few minutes after the gradient switch, as previously reported.7 Under the present flow rate, there was no detectable bias in cell directionality in the absence of a gradient and the movement was specifically induced by the fMLP gradient (Fig. 7b). Fig. 7c shows the representative time course of the HL60 cells to the gradient switch at wider angles. For a 127° gradient switch, the cells re-oriented by making a U-turn (Fig. 7c, left panels), whereas in a 157° gradient switch, we noticed more cells that turned by re-establishing a new leading edge (Fig. 7c, right panel). The U-turn motion is characterized by the continuous shift in the orientation of the trailing edge (uropod), as shown by the curvature analysis (Fig. 7d; red asterisks). In the reversal motion, the leading and trailing edges disappear upon gradient switch while new leading and trailing edges are formed at the opposite end. Future studies should address the conditions that dictate these behaviours, such as the concentration range, speed and steepness of the concentration change as well as the angle of the gradient switch. These experiments provide a proof-of-principle and demonstrate the applicability of how the device can be used to quantitatively study cell migration in dynamic concentration gradients of a chemoattractant.
Conclusions
New flow-based devices and their accompanying schemes of flow control were developed to orient concentration gradients in directions of choice and precisely vary the concentrations in space and time. The ‘lighthouse’ serves as the basic module that provides a radial projection of laminar flow in an arbitrary orientation, thus providing an essential building block for gradient generation and positioning in time and space. The device, particularly when combined with flow photolysis and multiplexing, provides a highly versatile platform that enables the application of laminar flow of a stimulus to and from any position within the control region. The device provides a high degree of freedom in the gradient presentation, rivalling that of only glass-capillary based injection but with better spatio-temporal control and repeatability. We demonstrated the generation of alternating gradients that were not easily achievable using conventional means. The device may facilitate quantitative analysis of reorientation, steering, and persistence of cell movement, which are currently poorly characterised but constitute vital components of chemotactic migration.Materials and methods
Device fabrication
SU-8 moulds (SU-8 3050; MicroChem, Westborough, MA, USA) were fabricated by a standard photolithography process in an on-campus yellow room facility.33 The thickness of the moulds for the upper and lower layer of the chamber was 100 μm. A PDMS mixture (Sylgard 184 silicone elastomer kit; Dow Corning, Corning, NY, USA) with an elastomer to curing agent ratio of 10![[thin space (1/6-em)]](https://www.rsc.org/images/entities/char_2009.gif) :
:![[thin space (1/6-em)]](https://www.rsc.org/images/entities/char_2009.gif) 1 was cast on top of the upper layer mould and cured at 75 °C for 1 h. Inlet holes were opened using a 1.5 mm diameter biopsy punch (BP-15F; Kai industries, Gifu, Japan). For multi-layer fabrication, the PDMS mixture was cast on the lower layer mould and was partially cured at 60 °C for 30 to 60 min.34,35 The upper layer was then placed on top of the lower layer under a stereo microscope (SZX 12; Olympus, Tokyo, Japan) with a homemade aligner. The layered PDMS was further cured at 75 °C for 1 h. An outlet hole was opened using a 1.5 mm punch. Channels that connect the upper and lower layers were opened by careful manoeuvre of a 500 μm diameter biopsy punch (BP-A05F; Kai) mounted on a homemade manipulator under an inverted microscope (IX81; Olympus). To prevent leakage from the channels, a thin additional layer of PDMS was bonded on top of the upper layer either by partial curing or by treating the surfaces with air plasma (PDC-32G; Harrick Plasma, Ithaca, NY, USA). The obtained PDMS layers were bonded to a glass coverslip (Matsunami, Tokyo, Japan; No. 1S or No. 2 thickness, 24 mm × 60 mm) after air plasma treatment.
1 was cast on top of the upper layer mould and cured at 75 °C for 1 h. Inlet holes were opened using a 1.5 mm diameter biopsy punch (BP-15F; Kai industries, Gifu, Japan). For multi-layer fabrication, the PDMS mixture was cast on the lower layer mould and was partially cured at 60 °C for 30 to 60 min.34,35 The upper layer was then placed on top of the lower layer under a stereo microscope (SZX 12; Olympus, Tokyo, Japan) with a homemade aligner. The layered PDMS was further cured at 75 °C for 1 h. An outlet hole was opened using a 1.5 mm punch. Channels that connect the upper and lower layers were opened by careful manoeuvre of a 500 μm diameter biopsy punch (BP-A05F; Kai) mounted on a homemade manipulator under an inverted microscope (IX81; Olympus). To prevent leakage from the channels, a thin additional layer of PDMS was bonded on top of the upper layer either by partial curing or by treating the surfaces with air plasma (PDC-32G; Harrick Plasma, Ithaca, NY, USA). The obtained PDMS layers were bonded to a glass coverslip (Matsunami, Tokyo, Japan; No. 1S or No. 2 thickness, 24 mm × 60 mm) after air plasma treatment.
Conversion between feeding rates and flow direction
In the basic operation, the rate of fluid loading to the two ports i and j ((i, j) = (1, 2), (2, 3), or (3, 1)) located at the ceilings of the observation chamber is controlled over time. The fluid velocity at the centre of the observation chamber Vij is approximated by superposition of the flow from the two ports (Fig. S2, ESI†), namely,where vi and vj are the velocity contribution from ports i and j at the centre of the observation chamber and pj is the flow–speed ratio pj = |vj|/vc (0 ≤ pj ≤ 1). |vj| may vary between 0 to vc, while the total flow is fixed (|vi| + |vj| = vc). The x-axis is taken along the direction from port i to port 4. We denote the angle between vi and vj as ϕj. Then, vectors vi and vj are
where ϕj = 120° for j = 1, 2, and 3 in the basic three-port arrangement. From the above equation, we obtain
The directional angle θj of the control flow (0° ≤ θj ≤ 180°) is defined by
For ϕj = 120°, we arrive at eqn (1) and (2) (see the Results section. Assuming that the flow profile of the control stream from ports i and j is unaffected by the side walls of the chamber and thus isotropic in either direction, the velocity contribution from port j is expressed as |vj| = Qj/2πrh, where Qj is the feeding rate from port j, r is the distance from port j to the centre of the chamber, and h is the height of the chamber. Therefore, pj (= |vj|/vc) is equivalent to the fractional feeding rate Qj/(Qi + Qj).
Microscopy
An inverted microscope (IX-81; Olympus) equipped with a confocal scanning unit (CSU-X1; Yokogawa, Tokyo, Japan) and an EM-CCD camera (Evolve 512; Photometrics, Tucson, AZ, USA) was used for Fig. 2a, b, e–h, 3–5, 6a–e, 7b–d, S1, S3, S4, and S5a, b.† A 488 nm laser (50 mW, Vortran Laser Technology, Sacramento, CA, USA) was used as a light source with a dichroic mirror (DM405/488/561; Yokogawa) and an emission filter (510–550 nm; BP 510–550, Olympus) to detect green fluorescence. The objective lenses used were 4× (UPlanSApo, NA 0.16), 20× air (UPlanFLN, NA 0.50), 20× oil immersion (UPlanSApo, NA 0.85), and 40× air (UPlanSApo, NA 0.95). An inverted microscope (IX-83; Olympus) equipped with a confocal scanning unit (CSU-W1; Yokogawa) and an EM-CCD camera (Evolve 512; Photometrics) was used, as shown in Fig. 1, 2c, d, 6a–e, 7a and S5c–e.† Two lasers (488 nm, 50 mW; 561 nm, 50 mW) were used as light sources with a dichroic mirror (DM405/488/561; Yokogawa) and emission filters (510–550 nm, Olympus; 600IF, Olympus). Additionally, 4× objective (UPlanSApo, NA 0.16), 20× air objective (UPlanSApo, NA 0.75), and 40× air objective (UPlanSApo, NA 0.95) lenses were used. Images were acquired using MetaMorph software (Molecular Devices, Eugene, OR, USA), stored as Tagged Image File Format files, and used for further analysis.Microfluidic device operation
To deliver the control stream necessary to guide the stimulus flow direction, the inlets for Ch. 1–3 were connected by tubings to programmable syringe pumps (Pump 11 Elite, Harvard Apparatus, Inc., Holliston, MA, USA; NE-1002X, New Era Pump Systems, Farmingdale, NY, USA), or a micro-flow control device (MFCS-FLEX; Fluigent, Inc., Villejuif, France) equipped with flow meters. When using syringe pumps, the change in the feeding rate was automated using customised programs. For the pressure device, the feeding rate was monitored in real-time, and the pressure was changed sequentially on a per channel basis using MAESFLO software (Fluigent). Flow regulation was automated when appropriate using custom-made scripts. A syringe pump was connected to Ch. 4 to load the stimulus solution.Uncaging
CMNB-caged fluorescein (Invitrogen F7103) was included in the flow solution at the final concentration of 30 or 100 μM. UV light was applied using a digital micro-mirror device (Mosaic; Photonic Instruments) with a band pass filter (BP 365/10; or BP 377/50) and a mercury lamp as a light source. For the gradient switch, the position of the irradiated area was altered during time-lapse image acquisition by a custom-made macro in MetaMorph software. Port 4 (Ch. 4) was not opened in the uncaging experiments.Quantification of the gradient profiles
Fluorescein (Wako, Osaka, Japan; 213-00092) at a final concentration of 3–30 μM or Alexa Fluor 594 (Invitrogen, Carlsbad, CA, USA; A10438) at a final concentration of 0.4 μg mL−1 was included in the stimulus solution as an indicator, except in the flow field visualization and uncaging experiments. The intensity profiles of fluorescein fluorescence were acquired near the bottom of the chamber. The fluorescence intensities were corrected for spatial inhomogeneity of illumination as described previously.11,32 To align single-peaked intensity profiles, the positions of the half-maximum intensities, X1 and X2, were obtained from the intensity profiles, and their midpoint Xpeak (= (X1 + X2)/2) was calculated to estimate the peak position. The gradient of the intensity profiles was defined by fitting the profiles with a linear function between positions that were 20 to 80% of the peak intensity. Images were analysed using ImageJ (NIH, Bethesda, MD, USA) and MATLAB (MathWorks, Natick, MA, USA).Flow profile visualization and particle image velocimetry
A suspension of fluorescent microbeads (Fluoresbrite (R) YG Carboxylate Microspheres 1.0 μm diameter; Polyscience, Niles, IL, USA; 15702) was diluted in phosphate buffer (PB) (13 mM KH2PO4, 7 mM Na2HPO4, pH 6.5) (volume fraction of 1![[thin space (1/6-em)]](https://www.rsc.org/images/entities/char_2009.gif) :
:![[thin space (1/6-em)]](https://www.rsc.org/images/entities/char_2009.gif) 1000). The flow profile was observed at z = 30 μm from the bottom of the chamber. Images were acquired at a video rate of 33 frame s−1 over 300 frames (equivalent to 9 s) using Metamorph software. To eliminate background noise and the fluorescent signal of the beads attached to the chamber wall, an averaged image over all frames was subtracted from the original images. To visualise flow in the observation chamber, the maximum intensity projection of the average-subtracted images was obtained. Fig. 1c and d were reconstructed from tiling of 9(3 × 3) and 4(2 × 2) sequentially acquired images using the ImageJ stitching plugin.36 The flow velocity at the centre of the chamber was estimated from particle image velocimetry (PIV) analysis using PIVlab.37 The flow velocity was calculated from consecutive images (frames 1 and 2, frames 2 and 3, and so on) over 100 frames (3 s). The flow velocity at a 75 × 75 μm square area around the centre of the chamber was obtained from each of the consecutive images, and their average was obtained.
1000). The flow profile was observed at z = 30 μm from the bottom of the chamber. Images were acquired at a video rate of 33 frame s−1 over 300 frames (equivalent to 9 s) using Metamorph software. To eliminate background noise and the fluorescent signal of the beads attached to the chamber wall, an averaged image over all frames was subtracted from the original images. To visualise flow in the observation chamber, the maximum intensity projection of the average-subtracted images was obtained. Fig. 1c and d were reconstructed from tiling of 9(3 × 3) and 4(2 × 2) sequentially acquired images using the ImageJ stitching plugin.36 The flow velocity at the centre of the chamber was estimated from particle image velocimetry (PIV) analysis using PIVlab.37 The flow velocity was calculated from consecutive images (frames 1 and 2, frames 2 and 3, and so on) over 100 frames (3 s). The flow velocity at a 75 × 75 μm square area around the centre of the chamber was obtained from each of the consecutive images, and their average was obtained.
Cell culture and sample preparation
Dictyostelium discoideum strain AX4 cells expressing RFP-RBDRaf111 were grown at 22 °C in a modified HL-5 medium supplemented with 10 μg mL−1 G418. The cells were propagated every 1–3 days below 3 × 10⁶ cells mL−1. For time-lapse imaging, growing cells were washed twice and resuspended in PB at a density of 5 × 10⁶ cells mL−1. The cells were shaken at 22 °C without exogenous cAMP for the first 1 h. The cells were shaken for an additional 3 to 4 h with application of cAMP at a final concentration of 50 nM every 6 min using a peristaltic pump. The starved cells were collected and resuspended at a density of 6 × 10⁵ cells mL−1 (Fig. 6b and c) or 2 × 10⁶ cells mL−1 (Fig. 6d–f) in PB containing 50 μM SQ22536 (Calbiochem, Darmstadt, Germany; 568500). The suspension of Dictyostelium cells was back-loaded from the outlet of the basic lighthouse device using a 1 mL syringe (Terumo, Tokyo, Japan; SS-01T) while keeping channels 1, 2, and 3 closed. The cell suspension overflow was collected passively at channel 4. After allowing cells to adhere to the substrate for 5 to 10 min, the chamber was perfused for 10 min with either a syringe pump or MFCS to fully exchange buffer. After confirming that the flow rate had stabilised, the programmed flow control and time-lapse image acquisition were started. All observations for Dictyostelium cells were conducted at 22 °C.HL60 cells (RCB 0041; RIKEN BRC) were cultured in an RPMI-1640 medium containing L-glutamine, phenol red, and 25 mM HEPES (Wako 189-02145) supplemented with 10% heat-inactivated foetal bovine serum (Sigma-Aldrich, St. Louis, MO, USA; 172012) and an antibiotic–antimycotic mix (Sigma-Aldrich, A5955) at 37 °C and under 5% CO2. The cells were diluted in fresh medium every 1–4 days and maintained below 1 × 10⁶ cells mL−1. To obtain HL60 cells stably expressing Clover,38 the plasmid pcDNA3-Clover (a gift from Michael Lin, Addgene plasmid #40259) was linearised with BglII and introduced into the cells using an electroporator (NEPA21; Nepa Gene, Ltd., Chiba, Japan). A G418 (Wako, 078-05961) solution was added to the medium at a final concentration of 1 mg mL−1 2 days after electroporation for selection. For microfluidics analysis, the cells were differentiated by adding 1.3% dimethyl sulfoxide (Sigma-Aldrich, D2650) to the growth medium for 3 days. The differentiated cells were collected and re-suspended at a density of 3 × 10⁵ cells mL−1 (Fig. 7a) or 2 × 10⁶ cells mL−1 (Fig. 7b–d) in HBSS (Wako, 082-09365) containing 1 nM fMLP (Sigma, F3506). The duplexed device was loaded with 5 μg mL−1 fibronectin (Corning 354008) (in PBS) for 1 h at room temperature and then washed twice with PBS before use. The HL60 cell suspension was back-loaded from the chamber outlet using a 1 mL syringe while keeping channels 1 through 4 closed. The overflow was collected passively at channels 5 and 6. Cells were allowed to adhere to the coverslide surface for 5 to 10 min and then flushed using either a syringe pump or MFCS for buffer exchange and flow stabilization for 10 min prior to stimulus manipulation and image acquisition. The migration of HL60 cells was observed at 37 °C.
Image analysis
For cell tracking, cells that were immotile or insufficiently adhered to the substrate were excluded from the analysis. Dictyostelium cells in the transmitted light images were manually tracked using the ImageJ plugin MTrackJ. For HL60 cells, the cell tracking was operated in the same way. The cell displacement and velocity were calculated by a custom-built program in MATLAB. To analyse the time course of cell boundaries, fluorescence images of Clover were first filtered with a Gaussian blur (sigma = 2 pixel) and then converted to logarithmic images. The images were binarized using the Otsu method and served as masks to extract the cell contour. To trace cell morphologies (Fig. 7d), the edge of the cell mask was segmented into 500 equally spaced points (i = 1–500) ordered in the clockwise orientation. The points were mapped between time frames by minimizing the sum of squared displacement while conserving the order of the clockwise index.39 The curvature at point ‘i’ was defined as the reciprocal of the radius of a circle that crosses the cell boundary at point i − 25, i, and i + 25. The curvature is positive when the fitted circle contacted the cell boundary from the inner side of the cell and negative otherwise. ImageJ and MATLAB were used for all image analysis.Acknowledgements
The authors are grateful to all members of the Sawai lab for helpful discussions, Reiko Okura for daily operation of the fabrication room, Yoshiaki Iwadate and Chika Okimura at Yamaguchi University for technical advice on HL60 cell culture, and Mina Fujishiro for plasmid preparation. This work was supported by grants from the Japan Society for the Promotion of Science (JSPS) KAKENHI Grant Numbers JP25710022, JP25103008, JP15KT0076, JP16H01442, JP15K12138 (to S. S.), JP25840069, and JP16K18537 (to A. N.), and the Japan Science and Technology Agency (JST) Precursory Research for Embryonic Science and Technology (PRESTO) (to S. S.) and Platform for Dynamic Approaches to Living System from the Agency for Medical Research and Development (AMED).Notes and references
- I. C. Schneider and J. M. Haugh, J. Cell Biol., 2005, 171, 883–892 CrossRef CAS PubMed.
- T. Chtanova, M. Schaeffer, S.-J. Han, G. G. van Dooren, M. Nollmann, P. Herzmark, S. W. Chan, H. Satija, K. Camfield, H. Aaron, B. Striepen and E. A. Robey, Immunity, 2008, 29, 487–496 CrossRef CAS PubMed.
- T. Lämmermann, P. V. Afonso, B. R. Angermann, J. M. Wang, W. Kastenmüller, C. A. Parent and R. N. Germain, Nature, 2013, 498, 371–375 CrossRef PubMed.
- E. T. Roussos, J. S. Condeelis and A. Patsialou, Nat. Rev. Cancer, 2011, 11, 573–587 CrossRef CAS PubMed.
- C. A. Parent, B. J. Blacklock, W. M. Froehlich, D. B. Murphy and P. N. Devreotes, Cell, 1998, 95, 81–91 CrossRef CAS PubMed.
- G. Servant, O. D. Weiner, P. Herzmark, T. Balla, J. W. Sedat and H. R. Bourne, Science, 2000, 287, 1037–1040 CrossRef CAS PubMed.
- S. H. Zigmond, H. I. Levitsky and B. J. Kreel, J. Cell Biol., 1981, 89, 585–592 CrossRef CAS PubMed.
- M. G. Vicker, J. M. Lackie and W. Schill, J. Cell Sci., 1986, 84, 263–280 CAS.
- M. G. Vicker, J. Cell Sci., 1994, 107(Pt 2), 659–667 CAS.
- P. Herzmark, K. Campbell, F. Wang, K. Wong, H. El-Samad, A. Groisman and H. R. Bourne, Proc. Natl. Acad. Sci. U. S. A., 2007, 104, 13349–13354 CrossRef PubMed.
- A. Nakajima, S. Ishihara, D. Imoto and S. Sawai, Nat. Commun., 2014, 5, 5367 CrossRef CAS PubMed.
- E. Albrecht and H. R. Petty, Proc. Natl. Acad. Sci. U. S. A., 1998, 95, 5039–5044 CrossRef CAS.
- J. Geiger, D. Wessels and D. R. Soll, Cell Motil. Cytoskeleton, 2003, 56, 27–44 CrossRef PubMed.
- A. J. Aranyosi, E. A. Wong and D. Irimia, Lab Chip, 2015, 15, 549–556 RSC.
- A. G. G. Toh, Z. P. Wang, C. Yang and N.-T. Nguyen, Microfluid. Nanofluid., 2014, 16, 1–18 CrossRef.
- B. Lin and A. Levchenko, Front. Bioeng. Biotechnol., 2015, 3, 39 Search PubMed.
- N. L. Jeon, S. K. W. Dertinger, D. T. Chiu, I. S. Choi, A. D. Stroock and G. M. Whitesides, Langmuir, 2000, 16, 8311–8316 CrossRef CAS.
- D. Irimia, S.-Y. Liu, W. G. Tharp, A. Samadani, M. Toner and M. C. Poznansky, Lab Chip, 2006, 6, 191–198 RSC.
- S. Takayama, E. Ostuni, P. Leduc, K. Naruse, D. E. Ingber and G. M. Whitesides, Nature, 2001, 411, 1016 CrossRef CAS PubMed.
- A. Sawano, S. Takayama, M. Matsuda and A. Miyawaki, Dev. Cell, 2002, 3, 245–257 CrossRef CAS PubMed.
- J. Atencia, G. A. Cooksey and L. E. Locascio, Lab Chip, 2012, 12, 309–316 RSC.
- B. Meier, A. Zielinski, C. Weber, D. Arcizet, S. Youssef, T. Franosch, J. O. Rädler and D. Heinrich, Proc. Natl. Acad. Sci. U. S. A., 2011, 108, 11417–11422 CrossRef CAS PubMed.
- M. Skoge, H. Yue, M. Erickstad, A. Bae, H. Levine, A. Groisman, W. F. Loomis and W.-J. Rappel, Proc. Natl. Acad. Sci. U. S. A., 2014, 111, 14448–14453 CrossRef CAS PubMed.
- J. A. Swanson and D. L. Taylor, Cell, 1982, 28, 225–232 CrossRef CAS PubMed.
- S. Moorjani, R. Nielson, X. A. Chang and J. B. Shear, Lab Chip, 2010, 10, 2139–2146 RSC.
- M. A. Qasaimeh, T. Gervais and D. Juncker, Nat. Commun., 2010, 2, 464–464 CrossRef PubMed.
- J. Atencia, J. Morrow and L. E. Locascio, Lab Chip, 2009, 9, 2707–2714 RSC.
- C. Beta, D. Wyatt, W.-J. Rappel and E. Bodenschatz, Anal. Chem., 2007, 79, 3940–3944 CrossRef CAS PubMed.
- F. Alcantara and M. Monk, J. Gen. Microbiol., 1974, 85, 321–334 CrossRef CAS PubMed.
- K. J. Tomchik and P. N. Devreotes, Science, 1981, 212, 443–446 CAS.
- M. Postma and P. J. M. Van Haastert, Methods Mol. Biol., 2016, 1407, 381–396 Search PubMed.
- A. Nakajima and S. Sawai, Methods Mol. Biol., 2016, 1407, 107–122 Search PubMed.
- F. Fukujin, A. Nakajima, N. Shimada and S. Sawai, J. R. Soc., Interface, 2016, 13, 20160233 CrossRef PubMed.
- J. S. Go and S. Shoji, Sens. Actuators, A, 2004, 114, 438–444 CrossRef CAS.
- M. A. Eddings, M. A. Johnson and B. K. Gale, J. Micromech. Microeng., 2008, 18, 067001 CrossRef.
- S. Preibisch, S. Saalfeld and P. Tomancak, Bioinformatics, 2009, 25, 1463–1465 CrossRef CAS PubMed.
- W. Thielicke and E. Stamhuis, J. Open Res. Softw., 2014, 2, e30 Search PubMed.
- A. J. Lam, F. St-Pierre, Y. Gong, J. D. Marshall, P. J. Cranfill, M. A. Baird, M. R. McKeown, J. Wiedenmann, M. W. Davidson, M. J. Schnitzer, R. Y. Tsien and M. Z. Lin, Nat. Methods, 2012, 9, 1005–1012 CrossRef CAS PubMed.
- M. K. Driscoll, C. McCann, R. Kopace, T. Homan, J. T. Fourkas, C. Parent and W. Losert, PLoS Comput. Biol., 2012, 8, e1002392 CAS.
- E. Alvarez-Curto, K. E. Weening and P. Schaap, Biochem. J., 2007, 401, 309–316 CrossRef CAS PubMed.
- T. Gregor, K. Fujimoto, N. Masaki and S. Sawai, Science, 2010, 328, 1021–1025 CrossRef CAS PubMed.
Footnote |
| † Electronic supplementary information (ESI) available. See DOI: 10.1039/c6lc00898d |
| This journal is © The Royal Society of Chemistry 2016 |

