DOI:
10.1039/C6LC00155F
(Paper)
Lab Chip, 2016,
16, 3043-3048
Arrayed water-in-oil droplet bilayers for membrane transport analysis†
Received
3rd February 2016
, Accepted 1st April 2016
First published on 4th April 2016
Abstract
The water-in-oil droplet bilayer is a simple and useful lipid bilayer system for membrane transport analysis. The droplet interface bilayer is readily formed by the contact of two water-in-oil droplets enwrapped by a phospholipid monolayer. However, the size of individual droplets with femtoliter volumes in a high-throughput manner is difficult to control, resulting in low sensitivity and throughput of membrane transport analysis. To overcome this drawback, in this study, we developed a novel micro-device in which a large number of droplet interface bilayers (>500) are formed at a time by using femtoliter-sized droplet arrays immobilized on a hydrophobic/hydrophilic substrate. The droplet volume was controllable from 3.5 to 350 fL by changing the hydrophobic/hydrophilic pattern on the device, allowing high-throughput analysis of membrane transport mechanisms including membrane permeability to solutes (e.g., ions or small molecules) with or without the aid of transport proteins. Thus, this novel platform broadens the versatility of water-in-oil droplet bilayers and will pave the way for novel analytical and pharmacological applications such as drug screening.
Introduction
The maintenance of an appropriate intracellular environment is a constant challenge for all living organisms, from prokaryotes to multicellular eukaryotes. Intracellular homeostasis is maintained by transporting various compounds such as ions, sugars, amino acids, and drugs across the cell membrane.1 Therefore, the analysis of transmembrane transport is crucial to understanding cell physiology as well as for exploring the bioavailability of drugs.2,3
Transmembrane transport has been classified into two major mechanisms, i.e., passive permeation and carrier-mediated permeation. Although passive permeation is thought to be the dominant mechanism, the permeation of many hydrophilic compounds, e.g., amino acids, nucleic acids, and ions, is mediated by transport proteins embedded in the cell membrane.1
To study the transport mechanisms, various types of artificial cell membrane systems have been extensively developed.4 The liposome is the most versatile system that can be used to analyse membrane transport. The liposome is readily prepared by mixing phospholipids with an aqueous solution; however, it is technically challenging to control their shape. Because of the heterogeneity of liposome shapes, quantitative analysis of membrane transport is generally not possible. The planar lipid bilayer (PLB) has also been used to analyse membrane transport.5 The PLB is formed on a small aperture on a hydrophobic polymer sheet by manual deposition of a lipid solution dissolved in an organic solvent. Although the PLB is useful for quantitative analysis of membrane transport with an electrical detection system, the reproducibility and throughput of PLB formation has been low, resulting in low versatility. To address this drawback, some micro-fluidic techniques have been recently developed for high-throughput formation of PLBs,6–11 which gradually expand their versatility for various membrane transport analysis systems.
The water-in-oil droplet bilayer, i.e., droplet interface bilayer (DIB), is an emerging system derived from PLB for measuring membrane transport.12–19 The DIB is readily formed upon contact of two droplets enwrapped by a lipid monolayer, and the droplet, whose volume can be controlled at the picoliter level,17,18 is used as a reactor to detect membrane transport. Notably, extensive studies have been performed to enhance the sensitivity and throughput of biological assays by miniaturizing the droplet size down to femtoliter range.20 Some of the droplet systems have been recently implemented in highly sensitive and quantitative biological assays such as single-molecule enzymatic assays, digital PCR, and digital ELISA.21–25 The DIB has been recently used for quantitative analysis of membrane transport mechanisms; however, the versatility is limited to transport events fast enough to be detected by using picoliter-sized droplets. Moreover, the contact of droplets is modulated one by one, resulting in low throughput of DIB formation. Therefore, improvement of the droplet size and throughput of DIB formation is highly anticipated to enhance the versatility of the DIB.
In this study, we addressed these issues related to the DIB by developing a novel micro-device in which a large number of DIBs (>500) are formed at once by using femtoliter-sized droplet arrays immobilized on a hydrophobic/hydrophilic substrate. Additionally, we demonstrated high-throughput analysis of membrane transport of ions and small chemicals with or without the aid of transport proteins as a model for drug screening.
Experimental
Fabrication of the micro-device
We fabricated a micro-device with hydrophobic through-hole structures on a hydrophilic glass substrate. A hydrophobic polymer of carbon-fluorine (CYTOP; Asahi-glass, Japan) was spin-coated on a clean coverslip (Matsunami, Japan) at three thicknesses of 0.5, 1.0, and 2.0 μm, and then baked for 1 h at 180 °C. Photolithography was carried out using a positive photoresist (AZP4903; AZ Electronic Materials, Japan) to pattern mask structures (ϕ = 3.0, 5.0, 15 μm) on the CYTOP film. The resist-patterned substrate was dry-etched with O2 plasma by using a reactive ion etching system (RIE-10NR; Samco, Japan) to expose the hydrophilic SiO2 glass surface. The substrate was then rinsed with acetone and isopropyl alcohol to remove the photoresist film remaining on the substrate. Fig. 1 shows the three types of fabricated devices, where the diameter (ϕ) and height (h) of the through-hole structures on the CYTOP film are 3.0 and 0.5 μm, 5.0 and 1.0 μm, and 15 and 2.0 μm, respectively. More than 500 through-hole structures were fabricated on individual devices. The through-hole structure, in which the wall became moderately hydrophilic due to O2 dry-etching, was utilized as a micro-well to entrap water droplets on the surface of the device. The orifices of micro-wells, which remained hydrophobic after O2 dry-etching, were suitable to mechanically support the lipid monolayers lined on the droplet surfaces.
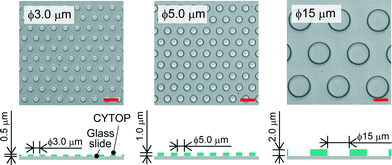 |
| | Fig. 1 Bright-field image of the micro-device for water-in-oil droplet formation. Three types of through-hole structures of carbon-fluorine hydrophobic polymer (CYTOP) were fabricated on a hydrophilic glass substrate; left: ϕ = 3.0 μm, h = 0.5 μm, centre-to-centre distance = 9 μm; middle: ϕ = 5.0 μm, h = 1.0 μm, centre-to-centre distance = 10 μm; right: ϕ = 15 μm, h = 2.0 μm, centre-to-centre distance = 27 μm. The scale bars are 10 μm. | |
Imaging
Confocal fluorescence images were captured under a confocal microscope system with a 60× objective lens and photomultiplier tubes (A1R; Nikon, Japan). Two types of lasers were used for the excitation of Alexa Fluor 488 (λex = 488 nm), fluorescein (λex = 488 nm), Fluo-3 (λex = 488 nm), Alexa Fluor 647 (λex = 639 nm), and Cy 5 (λex = 639 nm). It takes about 90 s to capture one view field (X × Y × Z = 212 μm × 212 μm × 18 μm). Fluorescence images were analysed using NIS Elements software (Nikon, Japan).
Bioassay
For the membrane permeability assay, we prepared two micro-devices in which the micro-wells were filled with buffer A (100 mM HEPES [pH 7.5], 100 mM NaCl) containing 50 μM fluorescein or 50 μM Alexa Fluor 647. On the other hand, for the α-hemolysin assay, we prepared two micro-devices in which the microwells were filled with buffer A containing 50 μM Fluo 3 and a certain amount of α-hemolysin monomers (HT101; Toxin Technology, USA), or 50 μM Cy 5 and 100 μM CaCl2. Confocal fluorescence images, taken along the Z-axis with intervals of 0.25 or 0.5 μm, were recorded at 5 or 10 min time intervals.
Results and discussion
DIB formation
A device patterned with microwells on a hydrophobic polymer was designed for the efficient formation of a water-in-oil droplet array. Fig. 2a shows a schematic illustration of the formation of water droplets lined with a phospholipid monolayer. First, an aqueous solution containing a fluorescent dye or the α-hemolysin transport protein,26 was dropped onto the device with a micropipette to fill the micro-wells. Then, the lipid solution (hexadecane) containing 20 μg mL−1 lipid (a 50![[thin space (1/6-em)]](https://www.rsc.org/images/entities/char_2009.gif) :
:![[thin space (1/6-em)]](https://www.rsc.org/images/entities/char_2009.gif) 50 (w
50 (w![[thin space (1/6-em)]](https://www.rsc.org/images/entities/char_2009.gif) :
:![[thin space (1/6-em)]](https://www.rsc.org/images/entities/char_2009.gif) w) mixture of DOPE and DOPG) was dropped on each water drop. The lipid solution gradually invaded the device and swept an aqueous solution from the device surface. Since the bottoms and walls of the micro-wells were hydrophilic, a small amount of aqueous solution remained entrapped in the micro-wells, resulting in the formation of water-in-oil droplets on the device. To examine the droplet shape in the wells, we visualized the droplets by dissolving a fixed concentration of fluorescent dye (Fig. 2b). 3D fluorescence imaging within the micro-wells revealed that the droplets had a cylindrical shape defined by the micro-well, and the water–oil interfaces, at which the phospholipid monolayers were lined, were located horizontally on the orifice of the micro-wells, i.e., the orifices were sealed with lipid monolayer membranes. It should be noted that the volume of the droplet was readily modulated by changing the pattern of the micro-well; thus far, we achieved simultaneous formation of more than 500 droplets with a volume ranging from 3.5 to 350 fL by using three types of micro-wells (ϕ = 3.0 μm, h = 0.5 μm for 3.5 fL; ϕ = 5.0 μm, h = 1.0 μm for 20 fL; and ϕ = 15 μm, h = 2 μm for 350 fL).
w) mixture of DOPE and DOPG) was dropped on each water drop. The lipid solution gradually invaded the device and swept an aqueous solution from the device surface. Since the bottoms and walls of the micro-wells were hydrophilic, a small amount of aqueous solution remained entrapped in the micro-wells, resulting in the formation of water-in-oil droplets on the device. To examine the droplet shape in the wells, we visualized the droplets by dissolving a fixed concentration of fluorescent dye (Fig. 2b). 3D fluorescence imaging within the micro-wells revealed that the droplets had a cylindrical shape defined by the micro-well, and the water–oil interfaces, at which the phospholipid monolayers were lined, were located horizontally on the orifice of the micro-wells, i.e., the orifices were sealed with lipid monolayer membranes. It should be noted that the volume of the droplet was readily modulated by changing the pattern of the micro-well; thus far, we achieved simultaneous formation of more than 500 droplets with a volume ranging from 3.5 to 350 fL by using three types of micro-wells (ϕ = 3.0 μm, h = 0.5 μm for 3.5 fL; ϕ = 5.0 μm, h = 1.0 μm for 20 fL; and ϕ = 15 μm, h = 2 μm for 350 fL).
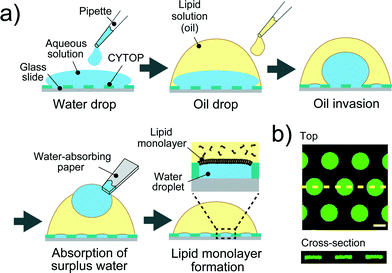 |
| | Fig. 2 Formation of droplet-interface lipid monolayers on the micro-device. (a) Schematic representation of lipid monolayer droplet formation: i) an aqueous solution, dropped onto the device with a micro-pipette, fills each micro-well. ii) A lipid solution, which gradually invades the device after being dropped onto a water drop, sweeps an aqueous solution from the device surface. In this process, a water-in-oil droplet is formed in each individual micro-well, and the orifice of the well is sealed with a lipid monolayer membrane. iii) The surplus water drops, which float after oil invasion, are removed with a water-absorbing paper. (b) Confocal fluorescence image of 50 μM Fluo 3 dissolved in droplets in the micro-wells (ϕ = 15 μm, h = 2 μm). Maximum intensity projection (top) and cross section along the yellow dashed line (bottom) are shown. The scale bar is 10 μm. | |
After droplet formation, we formed DIB arrays by laminating two devices. Fig. 3a shows a schematic illustration of DIB formation. First, two micro-devices, mounted with droplet monolayer arrays, were aligned with the droplet surfaces facing each other. Then, the x–y position of the upper device was optimized by a micro-manipulator, and the upper device was pushed using a steel rod (ϕ = 6.0 mm) against the lower one so as to establish contact between the droplets, resulting in the formation of lipid bilayers at the droplet–droplet interfaces (Fig. 3b). Lipid bilayer formation was confirmed by the activity of transport protein (see below), which was not functional unless the lipid bilayer became as thin as the membrane-spanning structure of the transport protein (4–5 nm). The efficiencies of the DIB array formation were 94 ± 2.7% for 3.5 fL micro-wells, 99 ± 1.0% for 20 fL micro-wells, and 89 ± 5.8% for 350 fL micro-wells. These efficiencies were higher than that of a previously reported DIB system,17 and the DIB formed on our micro-device was stable for at least 2 h (Fig. 3 and 4).
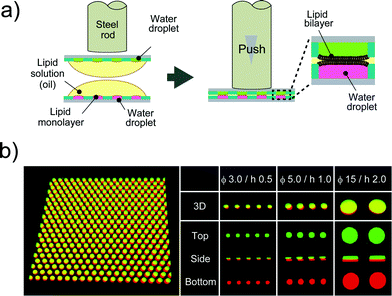 |
| | Fig. 3 DIB formation. (a) Schematic representation of DIB formation; i) two micro-devices, mounted with droplet monolayer arrays, are aligned with the droplet surfaces facing each other. ii) The upper device is pushed against the lower one so as to bring the droplets into contact with each other, forming lipid bilayers on droplet–droplet interfaces. (b) Confocal fluorescence image of Alexa Fluor 488 (green) and Alexa Fluor 647 (red) dissolved into upper and lower droplets, respectively. The leftmost panel is the representative image of more than 500 DIB formations on the micro-device (ϕ 5.0 μm, h 1.0 μm). | |
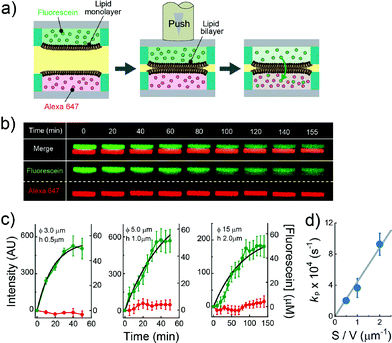 |
| | Fig. 4 Evaluation of the permeability assay for the permeability of chemicals across lipid bilayers. (a) Schematic representation of the assay procedure: i) two micro-devices, mounted with droplets containing fluorescein (green) and Alexa Fluor 647 (red), respectively, are vertically juxtaposed. ii) The devices are laminated to form lipid bilayers at the droplet–droplet interfaces. After lipid bilayer formation, the fluorescence intensity of fluorescein and Alexa Fluor 647 encapsulated in individual droplets was measured. (b) Time-lapse confocal imaging of fluorescein (green) and Alexa Fluor 647 (red) by using the micro wells with 15 μm diameter, and 2.0 μm height. The images are vertically magnified 1.6 times. (c) Time course of intensity change of fluorescein (green) in the lower droplet and Alexa Fluor 647 (red) in the upper droplet. The left, middle, and right panels represent the results using the micro-wells with 3.0 μm diameter and 0.5 μm height, 5.0 μm diameter and 1.0 μm height, and 15 μm diameter, and 2.0 μm height, respectively. Black curves represent fittings with eqn (6). The error bars represent SD from five replicates. (d) Permeability rate constant of fluorescein (kp) plotted against the S/V ratio. The grey line represents the linear fit. Error bars represent the errors of fittings in Fig. 4c. | |
Membrane permeation assay
The permeability across a phospholipid bilayer membrane is a critical property underlying the bioavailability of drugs, and therefore, membrane permeation assay of small chemicals is a prerequisite in drug development.3 In this study, as a model of drug permeation, we conducted a membrane permeation assay using small fluorescent chemicals, i.e., fluorescein and Alexa Fluor 647, with the newly developed DIB arrays with different droplet sizes. It is well known that fluorescein, a green fluorescent dye, can easily pass across phospholipid bilayer membranes,27 while Alexa Fluor 647, a red fluorescent dye, is membrane-impermeable. Fig. 4a shows a schematic illustration of the membrane permeation assay. We first prepared DIB arrays, in which fluorescein and Alexa Fluor 647 were independently dissolved in the upper and lower droplets, and we then monitored the fluorescent signals in individual droplets. Fig. 4b and c display the time courses of the fluorescent signals after the formation of the DIBs; the increment of the green signal in the lower droplets indicated the permeation of fluorescein across the phospholipid bilayer from the upper to the lower droplets, while no increment of red signal in the upper droplets was observed, indicating no permeation of Alexa Fluor 647.
Next, we constructed a simple physicochemical model of the membrane permeation of fluorescein based on Fick's law. In this model, the membrane permeation of fluorescein can be expressed as follows:
| |  | (1) |
where
S,
V,
C1(
t) and
J(
t) are the lipid bilayer area, which corresponds to the orifice size of the micro-well, lower droplet volume, concentration of fluorescein in the lower droplet, and membrane permeation rate of fluorescein in a certain area, respectively. The droplet size is small in relation to the diffusion rate of fluorescein; therefore, the rate-limiting step of membrane permeation is the translocation of fluorescein across the lipid bilayer, which can be written using Fick's law:
| |  | (2) |
where
D,
L, and
C0(
t) are the diffusion coefficient of fluorescein, thickness of the lipid bilayer (∼5 nm), and concentration of fluorescein in the upper droplet, respectively. The sum of the fluorescein molecules in the upper and lower droplets is constant, and therefore,
J(
t) is expressed as
| |  | (3) |
where
C0(0) is the concentration of fluorescein originally dissolved in the upper droplet, 50 μM. From
eqn (1) and
(3), the membrane permeation of fluorescein can be written as
| |  | (4) |
where the initial condition
C1(
t) = 0 at
t = 0. The differential equation was solved, and
C1(
t) is expressed as
| |  | (5) |
The fluorescence intensity of fluorescein is proportional to its concentration (Fig. S1
†); therefore, the fluorescence intensity of fluorescein in the lower droplet,
IF(
t), is expressed as
| |  | (6) |
The observed time course of the membrane permeation of fluorescein was fit well by
eqn (6) (
Fig. 4c), providing the rate constant of permeation (
kP = 2
D/
L·
S/
V): 9.3 × 10
−4 s
−1 for 3.5 fL droplets, 3.7 × 10
−4 s
−1 for 20 fL droplets, and 2.0 × 10
−4 s
−1 for 350 fL droplets, respectively. As shown in
Fig. 4d, the determined
kp was proportional to the ratio of lipid bilayer area (
S) to droplet volume (
V) (
S/
V), as expected from
eqn (6), showing the validity of the proposed physicochemical model of membrane permeation.
The permeability coefficient of small chemicals, a criterion of permeation across a phospholipid bilayer membrane, has been extensively measured.27–30 The permeability coefficient of fluorescein (PF) is given as follows:
| |  | (7) |
Taking into account the initial condition: d
C1(
t)/d
t = 1/2·
kP·
C0(0),
C1(
t) = 0 at
t = 0,
PF is expressed as
| |  | (8) |
The permeability coefficient of fluorescein (
PF) was determined based on
eqn (8): 2.3 × 10
−8 cm s
−1 for 3.5 fL droplets, 1.8 × 10
−8 cm s
−1 for 20 fL droplets, and 2.0 × 10
−8 cm s
−1 for 350 fL droplets. Although the previously reported values for
PF were varied depending on the experimental setups,
19,27,30 our results are similar to the smallest one (20 × 10
−8 cm s
−1), which was measured using the tightest artificial cell membrane system reported so far.
27 A previous study reported that membrane permeability strongly depended on the droplet size because the droplet size affected the lamellarity of the lipid membrane.
29 However, the membrane permeability of fluorescein measured in this study did not depend on the droplet size, suggesting that uniform lipid bilayers can be formed for different droplet sizes using our micro-device. Thus, the newly developed micro-device could be more useful for evaluating drug permeability across a lipid bilayer membrane.
Transport protein assay
We explored the possibility to analyse membrane transport with the aid of a transport protein. To this end, we used α-hemolysin, a toxic membrane protein that binds to lipid bilayer membranes and forms transmembrane nanopores (ϕ = 1–2 nm).26 Because α-hemolysin acts as a transport protein only when the nanopore penetrates the lipid membrane, the transport activity of α-hemolysin is often used to confirm the formation of a thin lipid bilayer (4–5 nm). We used α-hemolysin at three different concentrations: 0.5, 5.0, and 10 μg mL−1. Fig. 5a shows the schematic illustration of the transport assay using α-hemolysin. We first prepared DIB arrays using 20 fL droplets, in which Fluo 3 (a Ca2+ indicator) and α-hemolysin were dissolved in the upper droplets, while 100 μM CaCl2 and Cy 5 were dissolved in the lower droplet. Subsequently, we monitored the fluorescent signals in individual droplets. It should be noted that Fluo 3 and Cy 5 are well-known membrane-impermeable fluorescent dyes. Fig. 5b and c display the time courses of the fluorescent signals after the formation of the DIBs. The fluorescence increment of Fluo 3 in all upper droplets indicated the transport of Ca2+via the α-hemolysin pore as Fluo 3 exhibits Ca2+-dependent fluorescence enhancement.31 This observation ensured that the lipid membranes formed in the micro-devise were thin bilayers.
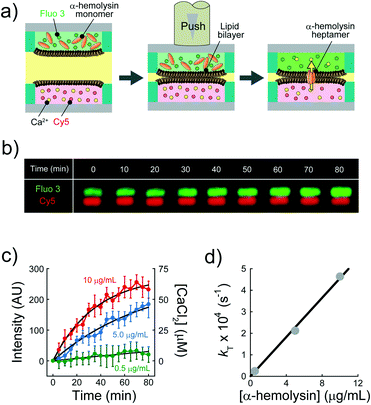 |
| | Fig. 5 Transport assay using pore-forming membrane protein α-hemolysin. (a) Schematics of assay procedures: i) the upper and lower devices are prepared using a fluorescent Ca2+ indicator (Fluo 3: green) and α-hemolysin monomers, and Cy 5 (red) and 100 μM CaCl2, respectively. ii) The devices are laminated to form lipid bilayers on droplet–droplet interfaces. After lipid bilayer formation, α-hemolysin monomers are assembled to form heptameric pores in lipid bilayers. Ca2+ encapsulated in the lower droplets is transported into the upper droplets via α-hemolysin pores, and Fluo 3 encapsulated in upper droplets thus increases its fluorescence intensity. We measured the fluorescence intensity of Fluo 3 in the upper droplets after lipid bilayer formation. (b) Time-lapse confocal image of Fluo 3 (green) and Cy 5 (red) using 5.0 μg mL−1 α-hemolysin. The images are vertically magnified 2.3 times. (c) Time course of intensity change of Fluo 3 (green) in the upper droplets encapsulating 0.5 (green), 5.0 (blue), and 10 μg mL−1 α-hemolysin (red), respectively. Black curves represent fittings with eqn (10). (d) Rate constant of fluorescence increment of Fluo 3 (kT) against the concentration of α-hemolysin. The black line represents the linear fitting. | |
We previously established a physicochemical model for the transport activity of α-hemolysin, where the diffusion of a substrate, e.g., ions, via the α-hemolysin nanopore is the kinetic bottleneck and obeys Fick's law.8 In this model, the concentration of Ca2+ transported into the upper droplet, [Ca2+], is expressed as
| |  | (9) |
where
N is the number of α-hemolysin pores reconstituted in the lipid membrane,
D is the diffusion coefficient of Ca
2+,
S and
L are the cross-section area and the length of the α-hemolysin pore, respectively,
V is the volume of the upper droplet, and [Ca
2+]
0 is the concentration of Ca
2+ originally dissolved in the lower droplet (100 μM). The concentrations of Fluo 3 and Ca
2+ originally dissolved in upper and lower droplets were almost the same; therefore, we can consider the intensity of Fluo 3,
IF3(
t), to be proportional to the Ca
2+ (Fig. S2
†).
IF3(
t) is expressed as follows:
| |  | (10) |
The observed time course of transport was fit well by eqn (10) (Fig. 5c), yielding a rate constant for α-hemolysin transport (kT = 2 N·D·S/L/V) of 0.24 × 10⁻⁴ s−1 for 0.5 μg mL−1 α-hemolysin, 2.1 × 10⁻⁴ s−1 for 5.0 μg mL−1 α-hemolysin, and 4.6 × 10⁻⁴ s−1 for 10 μg mL−1 α-hemolysin. As shown in Fig. 5d, the determined kT was proportional to the concentration of α-hemolysin dissolved in the droplets, which is presumably proportional to the number of α-hemolysin pores reconstituted on the lipid bilayer. These results are consistent with the previous physicochemical model of α-hemolysin transport,8 and indicate that our micro-device can be used for quantitative analysis of membrane transport with the aid of a transport protein.
Conclusions
In this study, we constructed a novel micro-device for high-throughput DIB formation using femtoliter-sized droplet arrays, which has been technically challenging for a decade. Our method has the following advantages: i) high-throughput formation of lipid bilayer membranes (>500 bilayers at a time, >85% efficiency), ii) high uniformity of lipid membranes, and iii) small droplet volume (∼3.5 fL). These features facilitate highly sensitive and quantitative analysis of membrane transport, and moreover expand the versatility of the DIB. The analysis of membrane transport, e.g., membrane permeability with or without the aid of transport proteins, is indispensable to assess bioavailability in early drug discovery;3 therefore, the micro-device developed in this study has application potential for highly sensitive and high-throughput screening of drug candidates. In addition, our lipid bilayer system can incorporate other membrane proteins of physiologic importance, e.g., receptors and enzymes functioning in lipid bilayers, and could be also applicable as a platform to study their working mechanisms under semi-physiologic conditions.
Acknowledgements
This work was supported by a Grant-in-Aid for Scientific Research no. 30540108 from the Ministry of Education, Culture, Sports, Science, and Technology of Japan to R. W., a research grant of Astellas Foundation for Research on Metabolic Disorders to R. W., and a research grant of Konica Minolta Science and Technology Foundation to R. W.
References
- M. H. Saier, Jr., Microbiol. Mol. Biol. Rev., 2000, 64, 354–411 CrossRef.
- C. International Transporter,
et al.
, Nat. Rev. Drug Discovery, 2010, 9, 215–236 CrossRef PubMed.
- K. Sugano,
et al.
, Nat. Rev. Drug Discovery, 2010, 9, 597–614 CrossRef CAS PubMed.
- M. Zagnoni, Lab Chip, 2012, 12, 1026–1039 RSC.
- P. Mueller,
et al.
, Nature, 1962, 194, 979–980 CrossRef CAS PubMed.
- S. Ota,
et al.
, Lab Chip, 2011, 11, 2485–2487 RSC.
- H. Suzuki,
et al.
, Biomed. Microdevices, 2009, 11, 17–22 CrossRef CAS PubMed.
- R. Watanabe,
et al.
, Nat. Commun., 2014, 5, 4519 CAS.
- R. Watanabe,
et al.
, Sci. Rep., 2014, 4, 7076 CrossRef PubMed.
- N. Soga,
et al.
, Sci. Rep., 2015, 5, 11025 CrossRef PubMed.
- R. Watanabe,
et al.
, IEEE Trans. Nanotechnol., 2016, 15, 70–73 CrossRef.
- S. Pautot,
et al.
, Proc. Natl. Acad. Sci. U. S. A., 2003, 100, 10718–10721 CrossRef CAS PubMed.
- K. Funakoshi,
et al.
, Anal. Chem., 2006, 78, 8169–8174 CrossRef CAS PubMed.
- N. Malmstadt,
et al.
, Nano Lett., 2006, 6, 1961–1965 CrossRef CAS PubMed.
- M. A. Holden,
et al.
, J. Am. Chem. Soc., 2007, 129, 8650–8655 CrossRef CAS PubMed.
- M. Yanagisawa,
et al.
, J. Am. Chem. Soc., 2011, 133, 11774–11779 CrossRef CAS PubMed.
- T. Tonooka,
et al.
, Small, 2014, 10, 3275–3282 CrossRef CAS PubMed.
- M. Iwamoto and S. Oiki, Sci. Rep., 2015, 5, 9110 CrossRef CAS PubMed.
- T. Nisisako,
et al.
, Analyst, 2013, 138, 6793–6800 RSC.
- S. Y. Teh,
et al.
, Lab Chip, 2008, 8, 198–220 RSC.
- D. M. Rissin,
et al.
, Nat. Biotechnol., 2010, 28, 595–599 CrossRef CAS PubMed.
- S. H. Kim,
et al.
, Lab Chip, 2012, 12, 4986–4991 RSC.
- E. A. Ottesen,
et al.
, Science, 2006, 314, 1464–1467 CrossRef CAS PubMed.
- Y. Rondelez,
et al.
, Nat. Biotechnol., 2005, 23, 361–365 CrossRef CAS PubMed.
- D. Kim,
et al.
, Lab Chip, 2015, 15, 17–22 RSC.
- L. Song,
et al.
, Science, 1996, 274, 1859–1866 CrossRef CAS PubMed.
- G. E. Flaten,
et al.
, Eur. J. Pharm. Sci., 2006, 27, 80–90 CrossRef CAS PubMed.
- S. Paula,
et al.
, Biophys. J., 1996, 70, 339–348 CrossRef CAS PubMed.
- T. Shimanouchi,
et al.
, Colloids Surf., B, 2009, 73, 156–160 CrossRef CAS PubMed.
- B. Schlicht,
et al.
, Sci. Rep., 2015, 5, 9951 CrossRef CAS PubMed.
- A. Minta,
et al.
, J. Biol. Chem., 1989, 264, 8171–8178 CAS.
Footnote |
| † Electronic supplementary information (ESI) available. See DOI: 10.1039/c6lc00155f |
|
| This journal is © The Royal Society of Chemistry 2016 |
 Open Access Article
![[thin space (1/6-em)]](https://www.rsc.org/images/entities/char_2009.gif) :
:![[thin space (1/6-em)]](https://www.rsc.org/images/entities/char_2009.gif) 50 (w
50 (w![[thin space (1/6-em)]](https://www.rsc.org/images/entities/char_2009.gif) :
:![[thin space (1/6-em)]](https://www.rsc.org/images/entities/char_2009.gif) w) mixture of DOPE and DOPG) was dropped on each water drop. The lipid solution gradually invaded the device and swept an aqueous solution from the device surface. Since the bottoms and walls of the micro-wells were hydrophilic, a small amount of aqueous solution remained entrapped in the micro-wells, resulting in the formation of water-in-oil droplets on the device. To examine the droplet shape in the wells, we visualized the droplets by dissolving a fixed concentration of fluorescent dye (Fig. 2b). 3D fluorescence imaging within the micro-wells revealed that the droplets had a cylindrical shape defined by the micro-well, and the water–oil interfaces, at which the phospholipid monolayers were lined, were located horizontally on the orifice of the micro-wells, i.e., the orifices were sealed with lipid monolayer membranes. It should be noted that the volume of the droplet was readily modulated by changing the pattern of the micro-well; thus far, we achieved simultaneous formation of more than 500 droplets with a volume ranging from 3.5 to 350 fL by using three types of micro-wells (ϕ = 3.0 μm, h = 0.5 μm for 3.5 fL; ϕ = 5.0 μm, h = 1.0 μm for 20 fL; and ϕ = 15 μm, h = 2 μm for 350 fL).
w) mixture of DOPE and DOPG) was dropped on each water drop. The lipid solution gradually invaded the device and swept an aqueous solution from the device surface. Since the bottoms and walls of the micro-wells were hydrophilic, a small amount of aqueous solution remained entrapped in the micro-wells, resulting in the formation of water-in-oil droplets on the device. To examine the droplet shape in the wells, we visualized the droplets by dissolving a fixed concentration of fluorescent dye (Fig. 2b). 3D fluorescence imaging within the micro-wells revealed that the droplets had a cylindrical shape defined by the micro-well, and the water–oil interfaces, at which the phospholipid monolayers were lined, were located horizontally on the orifice of the micro-wells, i.e., the orifices were sealed with lipid monolayer membranes. It should be noted that the volume of the droplet was readily modulated by changing the pattern of the micro-well; thus far, we achieved simultaneous formation of more than 500 droplets with a volume ranging from 3.5 to 350 fL by using three types of micro-wells (ϕ = 3.0 μm, h = 0.5 μm for 3.5 fL; ϕ = 5.0 μm, h = 1.0 μm for 20 fL; and ϕ = 15 μm, h = 2 μm for 350 fL).


