 Open Access Article
Creative Commons Attribution 3.0 Unported Licence
LabDisk for SAXS: a centrifugal microfluidic sample preparation platform for small-angle X-ray scattering†
Frank
Schwemmer
*a,
Clement E.
Blanchet
 b,
Alessandro
Spilotros
b,
Dominique
Kosse
c,
Steffen
Zehnle
c,
Haydyn D. T.
Mertens
b,
Melissa A.
Graewert
b,
Manfred
Rössle
b,
Nils
Paust
ac,
Dmitri I.
Svergun
b,
Felix
von Stetten
ac,
Roland
Zengerle
acd and
Daniel
Mark
c
b,
Alessandro
Spilotros
b,
Dominique
Kosse
c,
Steffen
Zehnle
c,
Haydyn D. T.
Mertens
b,
Melissa A.
Graewert
b,
Manfred
Rössle
b,
Nils
Paust
ac,
Dmitri I.
Svergun
b,
Felix
von Stetten
ac,
Roland
Zengerle
acd and
Daniel
Mark
c
aLaboratory for MEMS Applications, IMTEK - Department of Microsystems Engineering, University of Freiburg, Georges-Koehler-Allee 103, 79110 Freiburg, Germany. E-mail: frank.schwemmer@imtek.de
bEuropean Molecular Biology Laboratory, Hamburg Outstation, Notkestrasse 85, Hamburg, 22603, Germany
cHahn-Schickard – Georges-Koehler-Allee 103, 79110 Freiburg, Germany
dBIOSS Centre for Biological Signalling Studies, University of Freiburg, 79110 Freiburg, Germany
First published on 23rd February 2016
Abstract
We present a centrifugal microfluidic LabDisk for protein structure analysis via small-angle X-ray scattering (SAXS) on synchrotron beamlines. One LabDisk prepares 120 different measurement conditions, grouped into six dilution matrices. Each dilution matrix: (1) features automatic generation of 20 different measurement conditions from three input liquids and (2) requires only 2.5 μl of protein solution, which corresponds to a tenfold reduction in sample volume in comparison to the state of the art. Total hands on time for preparation of 120 different measurement conditions is less than 5 min. Read-out is performed on disk within the synchrotron beamline P12 at EMBL Hamburg (PETRA III, DESY). We demonstrate: (1) aliquoting of 40 nl aliquots for five different liquids typically used in SAXS and (2) confirm fluidic performance of aliquoting, merging, mixing and read-out from SAXS experiments (2.7–4.4% CV of protein concentration). We apply the LabDisk for SAXS for basic analysis methods, such as measurement of the radius of gyration, and advanced analysis methods, such as the ab initio calculation of 3D models. The suitability of the LabDisk for SAXS for protein structure analysis under different environmental conditions is demonstrated for glucose isomerase under varying protein and NaCl concentrations. We show that the apparent radius of gyration of the negatively charged glucose isomerase decreases with increasing protein concentration at low salt concentration. At high salt concentration the radius of gyration (Rg) does not change with protein concentrations. Such experiments can be performed by a non-expert, since the LabDisk for SAXS does not require attachment of tubings or pumps and can be filled with regular pipettes. The new platform has the potential to introduce routine high-throughput SAXS screening of protein structures with minimal input volumes to the regular operation of synchrotron beamlines.
Introduction
Small-angle X-ray scattering (SAXS) is an important technique in structural biology for the analysis of macromolecules in the range of 1–100 nm.1 One of the unique advantages of SAXS is its ability to determine low-resolution structures of macromolecules and complex assemblies directly from protein solutions without the need for protein crystals. This makes SAXS an ideal method for the measurement of nm-scale structural transitions triggered by a change in the environmental conditions, e.g. pH or salt concentration.2 Within recent years, new methods in SAXS data analysis3,4 and the introduction of automated sampling robots5–8 have led to a rapid increase in the popularity of SAXS among structural biologists. However, while sampling robots have increased the ease of use and throughput, these robots still require 5 to 30 μl of protein volume per measurement (see Table 1). Since quantities of high purity protein samples produced for structural studies are often limited, typically only a low number of environmental conditions can be probed per protein.| Author | Type | Minimum input volume | Automated generation of dilutions | # of different measurement conditions containing protein | Volume of protein per measurement condition | Time per measurement |
|---|---|---|---|---|---|---|
| a Via manual loading 5 μl are possible. b Estimated minimal fill for syringe pumps and tubings. c Time for measurement of 9000 droplets. d Six different measurement conditions (five containing protein) for 15 μl input volume. e Due to dilution, some of the measurements are performed with lower protein concentration than the input stock solution. f Including the manual positioning of wells. Automated image recognition based positioning is estimated to reduce time per measurement to 3–5 s. | ||||||
| Hura et al.6 | Sample changer (Berkley) | N/A | No | 1 | 12 μl | N/A |
| Round et al.25 | Sample changer (EMBL) | 20 μl | No | 1 | 5–20 μl | 60 s |
| David et al.5 | Sample changer (Soleil) | N/A | No | 1 | 6 μl | N/A |
| Nielsen et al.7 | Sample changer (CHESS) | 10 μla | No | 1 | 10 μl | N/A |
| Stehle et al.17 | Microfluidic system (droplet based) | >50 μlb | No | 1 | ∼9000 × 0.5 nl = 4.5 μl | 900 sc |
| Lafleur et al.2 | Microfluidic system (Lab-on-a-Chip system) | 15 μl | Yes | 5d | 15 μl/5 = 3 μle | 30 s |
| LabDisk for SAXS | Microfluidic system (centrifugal microfluidic) | 2.5 μl | Yes | 15 | 2.5 μl/15 = 170 nle | 30–60 sf |
Microfluidics offers the potential to provide high-throughput systems that reduce sample volumes and time per measured condition. Different microfluidic devices have been presented for SAXS. Continuous flow devices, where liquids are mixed and analyzed in micro-channels have been used for the measurement of folding and unfolding kinetics via time-resolved SAXS.9–12 In these methods the spatial distance after the micro-mixer corresponds to a time after mixing. By probing at different distances from the micro-mixer, kinetics could be resolved down to ∼100 microseconds,13 in comparison to multiple milliseconds in stopped-flow measurements.14 Furthermore, there are a number of customized microfluidic solutions for specific questions in SAXS, e.g. the formation of spider silk15 or the alignment of anisotropic particles in microchannels.16 Nevertheless, next to these specialized microfluidic solutions, some promising Lab-on-a-Chip devices have been presented that allow for high-throughput screening of protein structures under different environmental conditions with minimal protein volume.
Stehle et al. presented a droplet based microfluidic system for SAXS.17 The system demonstrated the formation and analysis of gold nanoparticles. The volume of a single droplet was only ∼0.5 nl and the data from 9000 droplets were averaged during one SAXS measurement. In the future the system can be integrated with well-studied droplet microfluidics operations, e.g. splitting, merging, micro-injection and mixing of droplets, to form more complex analysis systems. The bioXTAS chip, developed by Toft et al., allows for automated mixing of down to 36 μl of sample solution and read-out in a 200 nl X-ray chamber.18 This device was later substantially extended by Lafleur et al., who developed a Lab-on-a-Chip system for automated high-throughput sample preparation.2 The Lab-on-a-Chip system contained multiple rotary valves for the on-demand mixing of screening agents. Protein concentrations could be continuously verified using UV absorbance measurements and protein consumption was reduced by an on chip sample reservoir. This allowed a full analysis cycle with 6 different measurement conditions to be measured with a protein volume of only 15 μl.
However, while all microfluidic systems available offer unique advantages for SAXS, current systems suffer from typical “world-to-chip” interfacing problems, e.g. all systems require the manual attachment of tubes for syringe pumps. This makes the current Lab-on-a-Chip systems impractical for novice users and calls for more user-friendly solutions. Furthermore, with the exception of the new version of the bioXTAS chip, all microfluidic systems have large dead volumes of tens to hundreds of microliters.
Here, we present the centrifugal microfluidic LabDisk for SAXS. In contrast to pressure-driven microfluidic approaches, centrifugal microfluidic systems can be filled with regular pipettes and intrinsically benefit from low dead volumes since no liquid is lost in tubings.19 This simple “world-to-chip” interface and low dead volumes have led to the adoption of centrifugal microfluidic platforms in diverse diagnostic20,21 and analytical22 applications. Especially noteworthy are centrifugal microfluidic systems for protein crystallography.23,24 The LabDisk for SAXS is a new high-throughput tool for SAXS experiments at the P12 beamline at EMBL (PETRA III, DESY). The protein volume for a full dilution matrix of 20 measurement conditions (15 protein solutions, 5 buffers) is 2.5 μl. This volume corresponds to 170 nl per protein containing measurement condition, which is more than 10× less protein volume per measurement in comparison to current sample changers and other microfluidic systems (see Table 1). The LabDisk for SAXS includes six dilution matrices, each offers automatic and precise aliquoting, merging and mixing of different combinations from three input liquids: the protein sample (2.5 μl), a screening agent (3 μl) and a buffer solution (3.5 μl).
We demonstrate that the LabDisk for SAXS can be used with a range of different liquids relevant for SAXS. SAXS data collected using the LabDisk for SAXS can be fitted against crystallographic structure and data quality is sufficient to calculate ab initio 3-dimensional structures for glucose isomerase. Finally, we show a first application of the presented LabDisk for SAXS, via demonstration of different intermolecular effects for glucose isomerase depending on salt and protein concentration. The LabDisk for SAXS has the potential to introduce routine high-throughput screening to a wide SAXS community, reducing protein use and measurement time at synchrotron beamlines for all users.
Operation of the LabDisk for SAXS
To collect data at a synchrotron beamline with the LabDisk for SAXS, three components are required: (1) the disposable LabDisk for SAXS, which includes all microfluidics for the generation of the dilution matrices and the read-out chambers (Fig. 1), (2) the custom-built processing device, which is used to rotate the disk and thereby process the LabDisk for SAXS fluidically (ESI† Fig. S1) and (3) a custom-built positioner, which is used to position the read-out chambers of the LabDisk for SAXS with the X-ray beam in the synchrotron beamline (ESI† Fig. S2).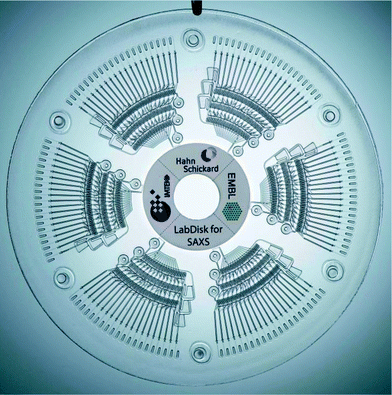 | ||
| Fig. 1 LabDisk for SAXS. Each of the six segments includes the aliquoting of the three input liquids, the combination and the mixing in different predefined concentrations. The mixtures then reside in the read-out chambers. Read-out can be performed on disk in a synchrotron beamline. The fluidic function of the segments is explained in Fig. 2–5. | ||
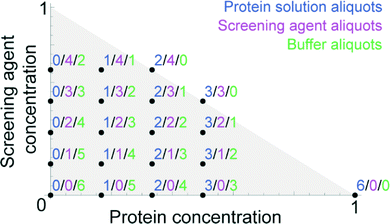
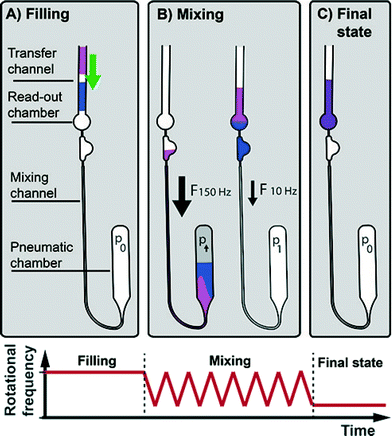
The LabDisk for SAXS is inserted into the processing device. Reagents are pipetted into the three inlets of each of the dilution matrices. One to six dilution matrices can be run in parallel. Each dilution matrix (see Fig. 2) is filled with 2.5 μl of protein solution, 3 μl of screening agent and 3.5 μl of buffer solution. After pipetting, the lid of the processing device is closed, and the processing device starts. The disk is initially rotated at 10 Hz and slowly accelerated to 30 Hz over a 90 s period. Liquid is transported from the inlet into the inlet channel. The liquid then fills individual aliquoting fingers that are connected via an isoradial feeding channel. The liquid flow from the aliquoting fingers into downstream fluidic elements is stopped by geometric valves26 (32 μm × 20 μm) located at the radially outer end of each of the aliquoting fingers (Fig. 3A). Each aliquoting finger has a volume of 40 nl. After the aliquoting fingers are filled, excess liquid flows over a radial extension of the feeding channel into the waste. The radial extension of the feeding channel increases the hydrostatic pressure from the inlet to the waste and ensures that liquid from the feeding channel is completely drained. When the feeding channel drains, the individual aliquoting fingers are fluidically separated, completing the metering of the aliquots (Fig. 3B). After the metering is completed, the rotational frequency is increased to 150 Hz. Centrifugal pressure increases until the liquid bursts through the geometric valves. Liquid aliquots from the upper aliquoting row (protein sample) and the center aliquoting row (screening agent) are transported over the backside foil and combined with aliquots from the lower aliquoting row (buffer) (Fig. 2). Each of the six dilution matrices on the disk generates 120 aliquots. Aliquots are combined in six aliquots each with different ratios of protein solution, screening agent and buffer aliquots, e.g. 3 protein solution aliquots, 1 screening agent aliquot and 2 buffer aliquots (see Fig. 4 for all combinations). The aliquots are mixed by reciprocation using a pneumatic chamber (see Fig. 5).27,28 The rotational frequency alternates between 10 Hz and 150 Hz, pumping the liquid between the read-out chamber and the pneumatic chamber until the liquid plugs are mixed completely. After 10 mixing cycles, the disk is stopped, the liquid is pumped into the read-out chambers and ready for analysis via SAXS. Each dilution matrix then contains 20 different measurement conditions. A full disk of six dilution matrices contains 120 different measurement conditions in 120 read-out chambers. Out of the 2.5 μl input volume 680 nl are analyzed in the actual SAXS measurement. The rest of the volume is included for pipetting tolerance, filling and draining of the feeding channel and as excess volume to ensure complete filling of the read-out chambers (see ESI† Table S1).
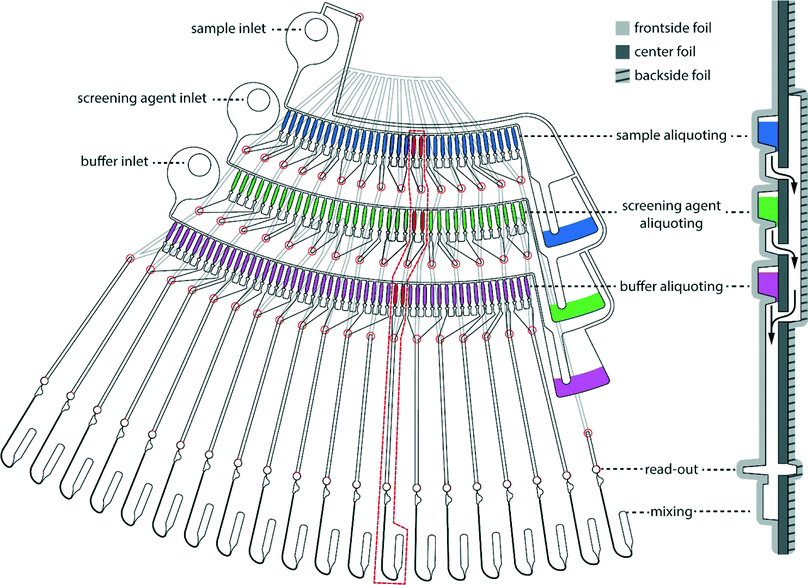 | ||
| Fig. 2 One dilution matrix of the LabDisk for SAXS. The left side shows a top view of the dilution matrix, the right side shows a cross-section. Red circles indicate through holes in the center foil. After metering the three input liquids, the rotational frequency is increased. Aliquots from the sample and screening agent are transferred through holes in the center foil (red circles), transported over the backside fluidic layer and combined with the buffer aliquots in the read-out and mixing section. Aliquots are combined in 20 sets of six aliquots each, comprising different combinations of sample, screening and buffer aliquots. Arrows indicate liquid flow. Side view is not to scale. Aliquoting is described in Fig. 3. The mixing is described in Fig. 5. The different target concentrations, as generated in one dilution matrix, are shown in Fig. 4. | ||
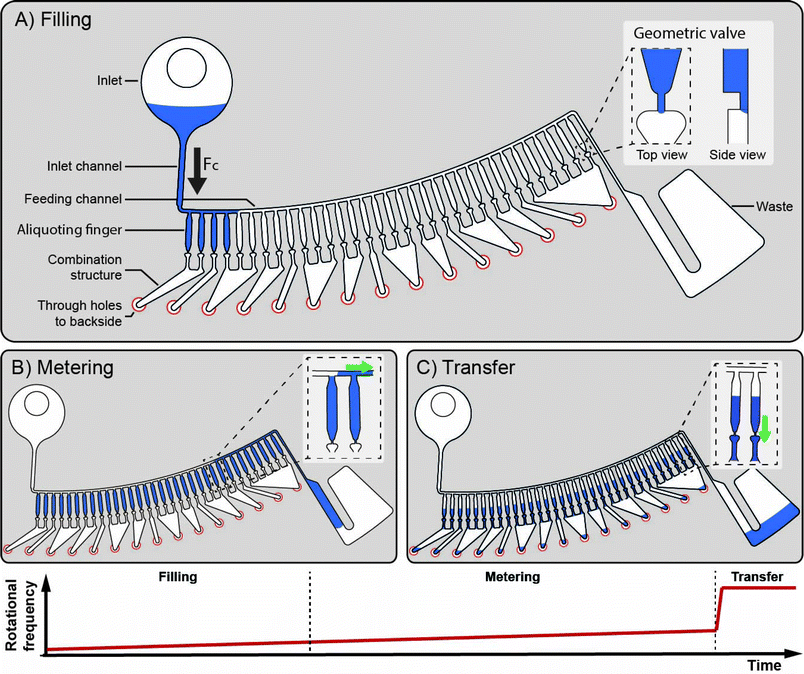 | ||
| Fig. 3 Aliquoting principle. During filling the rotational frequency is slowly ramped up from 10 Hz to 30 Hz. When liquid from the inlet fills the inlet channel, the aliquoting fingers having 40 nl volume each are sequentially filled via the feeding channel and excess liquid is transported to the waste (A). All extra liquid above the metering fingers is transported to the waste due to the radial extension of the feeding channel (B). By ramping up the rotational frequency to 150 Hz a certain number of the 40 nl aliquots is merged to create multiples of 40 nl volumes and transferred to the mixing and read-out chambers (C). The aliquoting structures for protein solution, screening agent and buffer aliquoting contain 33 aliquots, 36 aliquots and 51 aliquots, respectively. Combination of aliquots is explained in Fig. 2, mixing is explained in Fig. 5. | ||
After the fluidic protocol is completed, the disk can be transferred from the processing device to the positioner within the P12 beamline (PETRA III, DESY). Each dilution matrix contains 20 read-out chambers. The alignment of the read-out chambers within the SAXS beamline is performed via a custom built 3-axes motor stage. The 3-axes stage contains a rotational motor, which is used to roughly align the read-out chambers with the beam. Two linear motors, accurate to 20 μm, are used for fine alignment of the measurement chamber with the X-ray beam. The alignment was performed by manually controlling the motors for this manuscript, but will be automated in the future. The depth of the measured liquid column in the read-out chamber is 860 μm, the minimum diameter of the read-out chamber is 348 μm. The size of the X-ray beam was 50 μm × 50 μm. The alignment is supported by an in-axis camera setup. For identification each read-out chamber is individually numbered via a bitcode next to the read-out chamber. Data is automatically collected. After all 120 measurements are completed the disposable disk can be discarded and exchanged with the next disk.
Materials & methods
Prototyping & fabrication
A foundry service fabricated the LabDisks via a three-layer thermoforming process.30 The process for the fabrication of the LabDisk for SAXS was described in detail by Kosse et al.,31 here in short.LabDisks consist of three thermally bonded layers, a frontside foil containing most of the microfluidic structures, a backside foil connecting the radially inner aliquoting structures with the radially outer mixing chambers, and a center foil (160 μm, Topas COC 8007 and Topas COC 6013 co-extruded compound foil) with drilled holes connecting the frontside and backside fluidic layer. Microfluidic structures in the frontside and backside fluidic layers were designed using the computer-aided design software SolidWorks 2011 (Dassault Systèmes SOLIDWORKS Corp., France) and micro-milled using a KERN Evo (KERN Microtechnik GmbH, Germany) into a PMMA master (Plexiglas, Evonik, Germany). A negative of the microfluidic structures was replicated in PDMS (Elastosil RT-607, Wacker Chemie). The frontside and backside foils consist of custom-made 120 μm thick co-extruded Topas COC 8007 and Topas COC 6013 compound foils. Microstructures were replicated via thermoforming on a custom-built hot-press. The thickness of the X-ray viewing windows after thermoforming was ∼70 μm for the frontside and ∼115 μm for the backside foil. Frontside, center and backside foil were aligned and bonded by means of thermal bonding, using pressurized air in a hot press.
Fluidic processing & design
Stroboscopic images were taken using a LabDisk-Player modified with a stroboscopic light and camera to monitor microfluidic operation under rotation. SAXS Experiments were performed using a custom-built processing device. It allows for rotational frequencies of up to 200 Hz and facilitates acceleration and deceleration of up to 30 Hz s−1 (see ESI† Fig. S1).SAXS data collection
SAXS data were collected on the beamline P12 of EMBL, at the PETRA III storage ring (DESY, Hamburg).14 The disk was mounted in an about 3 cm wide air gap between the vacuum tube to the sychrotron and the vacuum tube to the detector. The disk was positioned on a custom-built 3-axes motor stage. The 3-axes stage contains a rotational motor, which roughly positions the read-out chambers in the X-ray beam path. Two linear motors are used for fine alignment. A custom-built on-axis camera provides images of the disk, facilitating the alignment of the chambers with the X-ray beam whose position on the image is known. A picture of the LabDisk for SAXS set up in the beamline (PETRA III, DESY) is depicted in ESI† Fig. S2.The X-ray beam (energy 10 keV) was collimated to an effective beam size of about 50 μm × 50 μm at sample position, yielding a flux of 5 × 10¹¹ photons per second. Data were collected on a Pilatus 2 M detector (Dectris, Villingen), with a sample-to-detector distance of 3.1 m covering a range of momentum transfer 0.02 nm−1 < s < 4.8 nm−1 (s = 4π![[thin space (1/6-em)]](https://www.rsc.org/images/entities/char_2009.gif) sin
sin![[thin space (1/6-em)]](https://www.rsc.org/images/entities/char_2009.gif) θ/λ, where 2θ is the scattering angle, and λ = 0.12 nm is the X-ray wavelength). On each read-out chamber, 20 frames of 50 ms exposure time were collected, radially averaged and normalized to the transmitted beam intensity. Individual frames were manually inspected and compared to identify radiation damage. Frames exhibiting significant differences in intensity were discarded.
θ/λ, where 2θ is the scattering angle, and λ = 0.12 nm is the X-ray wavelength). On each read-out chamber, 20 frames of 50 ms exposure time were collected, radially averaged and normalized to the transmitted beam intensity. Individual frames were manually inspected and compared to identify radiation damage. Frames exhibiting significant differences in intensity were discarded.
The “batch-mode” measurements were performed using an in-vacuum flow through cell coupled to an autosampler robot.14,25 Twenty frames of 50 ms were collected and analyzed using the SAXS data analysis pipeline.32
Data processing
Data were processed using programs from the ATSAS package.29 The buffer scattering signal was subtracted from that of the sample to isolate the scattering signal of the solute. The radius of gyration, Rg, of each sample was computed using the Guinier approximation33 on a restricted range (0.21 nm−1 < s < 0.4 nm−1). The ab initio bead model of glucose isomerase was reconstructed from the experimental data using the program DAMMIN.34 Predicted SAXS profiles of glucose isomerase were computed from the atomic structure (PDB ID. 1OAD) using Crysol35 and used to compute signal to noise ratio.Results
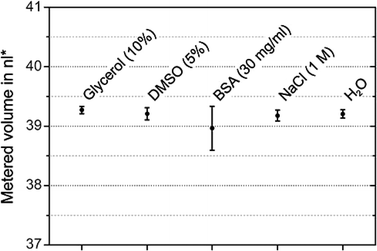
To test the compatibility of different liquids with the LabDisk for SAXS, the disk was filled with liquids typical for SAXS experiments and aliquoting was observed using a stroboscopic setup. Metered volumes were quantified from the filling height in the aliquoting finger directly before transfer to the mixing chambers. The variation in metered volume as determined from filling height was 0.2–1.0% CV (Fig. 6). Inaccuracies in aliquoting originate mainly from the first and last aliquoting fingers. Liquid in the first and last aliquoting fingers slowly wicks out of the fingers and into the waste (see ESI† Fig. S3), leading to underfilling in these metering fingers. The metering works as expected for the tested liquids. It has to be noted that the given volumes in Fig. 6 are not the same as the volumes aliquoted into the read-out chambers, since this evaluation does not take into account possible variations in aliquoting finger depths due to fabrication tolerances and neglects liquid lost on channel walls due to capillary forces during transfer. Some liquid loss due to capillary forces can commonly be expected in centrifugal microfluidics. To minimize the liquid loss on channel walls, the rotational frequency during transfer was 150 Hz, which is notably higher than the rotational frequencies typically used in centrifugal microfluidics.For the SAXS experiments, only the protein and screening agent concentrations in the read-out chambers matter, the absolute volumes are irrelevant. To measure the actual variation of protein concentration in the read-out chamber, we quantified the relative protein concentrations in the read-out chamber from the SAXS scattering data for the dilution matrix with glucose isomerase. Relative protein concentrations were quantified by measuring the actual scaling factors vs. expected scaling factors in the SAXS scattering pattern. The variation of measured protein concentration at the three different diluted target concentrations was 2.7–4.4% CV. This variation includes variations in aliquoting, combination and mixing. Due to the geometric valves in the LabDisk for SAXS, liquids with very low advancing contact angles on the COC surface (<45°) cannot be used in the LabDisk for SAXS, i.e. liquids with high concentrations of surfactants. For such low advancing contact angles, there is cornerflow in accordance with the Concus–Finn condition.36,37 This leads to unpredictable filling of channels and in extreme cases even “bursting” of geometric valves before the rotation of the disk is started. Consequently, the aliquoting fails. Another limiting factor is viscosity. Increasing the viscosity of input liquids will reduce the flow rate in the cartridge. At some point, the liquid flow rate will be so low that aliquoting would not be finished before the rotational frequency is increased to 150 Hz. Liquid remaining in the inlet would then be transferred to the first read-out chamber. The liquid with the highest viscosity tested was water with 10% glycerol, with a viscosity of 1.31 mPa s at 20 °C. If liquids of higher viscosities need to be handled, the frequency protocol can be adapted to include longer holding times. In general, failure of the fluidics is clearly visible from uneven filling of the read-out chambers and lack of liquid in one or more of the three waste chambers.
SAXS experiments
We used the LabDisk for SAXS to collect SAXS data on glucose isomerase (GI) at different protein and NaCl concentrations. The dilution matrix was prepared using a stock GI solution of 11 mg ml−1, the dilution buffer and a screening buffer containing 500 mM NaCl. The 20 conditions generated with the dilution matrix are reported in Table 2.| Read out chamber | Protein concentration (mg ml−1) | NaCl concentration (mM) |
|---|---|---|
| 1 | 11.0 | 0 |
| 2 | 0.0 | 250 |
| 3 | 1.8 | 333 |
| 4 | 3.7 | 250 |
| 5 | 5.5 | 83 |
| 6 | 0.0 | 83 |
| 7 | 1.8 | 0 |
| 8 | 3.7 | 167 |
| 9 | 5.5 | 250 |
| 10 | 1.8 | 83 |
| 11 | 3.7 | 0 |
| 12 | 0.0 | 333 |
| 13 | 5.5 | 0 |
| 14 | 0.0 | 167 |
| 15 | 1.8 | 250 |
| 16 | 3.7 | 83 |
| 17 | 5.5 | 167 |
| 18 | 1.8 | 167 |
| 19 | 0.0 | 0 |
| 20 | 3.7 | 333 |
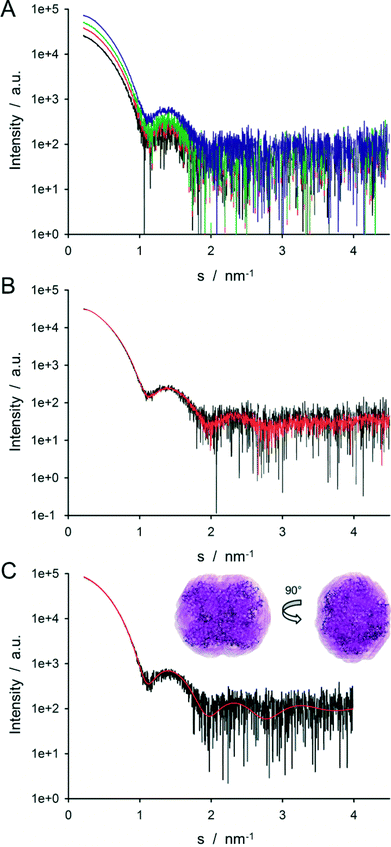
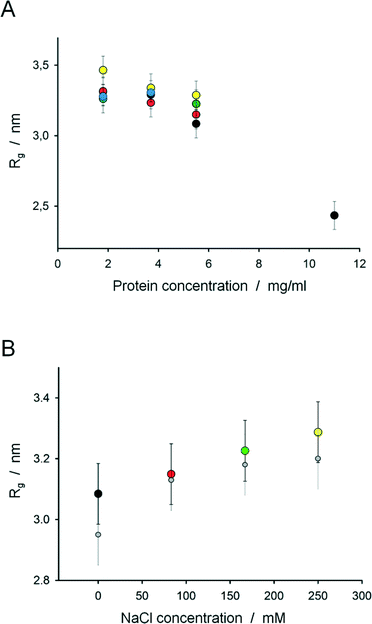
SAXS data were collected for the 20 different conditions, investigating protein dilution and the effect of NaCl concentration on intermolecular interactions. The radially averaged curves collected on the different read-out chambers of the disk were consistent with each other and had the same background except for one chamber that exhibited a very intense signal at a low angle (<0.4 nm−1). The 2D images collected on this read-out chamber show a strong parasitic signal at low angle suggesting that the chamber was not properly aligned with the beam. This data set was not considered in the following. For the consistent read-out chambers, scattering data were collected from protein and buffer solutions and difference profiles generated for analysis. The scattering curves corresponding to the dilution matrix of GI without additional NaCl (where the differences between the curves are the largest) are depicted in Fig. 7A.
Comparison of the SAXS data collected on LabDisk for SAXS and on the sample changer
The data collected with the LabDisk for SAXS were first compared to data collected on the same sample with the standard autosampler coupled capillary setup for solution SAXS of the P12 beamline. Curves collected on GI at 5.5 mg ml−1 (no salt) with the two setups are shown in Fig. 7B. The data collected on the disk is noisier than the one collected on the sample changer: the signal-to-noise-ratio of the data collected on the disk is less than half of the one collected on the sample changer. But the two curves are in good agreement (χ2 = 1.4, see ESI† eqn (1)).The decrease in signal-to-noise ratio can be explained by (i) an increase of the instrumental background (ii) a decrease of the SAXS signal.
(i) In the sample changer operation, the capillary in which the sample is loaded is in vacuum. The LabDisk for SAXS is operated in a 3 cm wide air gap. In addition to the scattering of air around the disk, two vacuum windows were added on the beamline to break the vacuum path (detector flight tube window: Kapton, 30 μm; on-axis camera window: polycarbonate, 125 μm). Although these windows have been chosen because of their low scattering property, they do contribute to the experimental background.
(ii) The total SAXS signal is lower because the path length of the X-ray in the capillary is reduced: the path length for the read-out chamber is 860 μm, whereas the path length for the sample changer capillary is 1.7 mm. For the photon energy used in these experiments (10 keV), the optimal path length would be 1.88 mm,38i.e. the path length is closer to optimal in the sample changer capillary than in the disk. Furthermore, for the presented experiments, the beam was cut down to 50 μm × 50 μm to have the full beam well centered in the read-out chamber, which reduced the intensity of the incoming beam by approximately a factor of 10.
Even though the signal-to-noise ratio is reduced, the resulting SAXS profiles collected with the LabDisk for SAXS can be readily used for advanced modeling methods such as envelope determination. Fig. 7C shows an ab initio bead model reconstructed from the LabDisk for SAXS data (5.5 mg ml−1, 250 mM NaCl) using a P222 symmetry overlaid with the atomic structure of the GI tetramer (PDB ID. 1OAD). The SAXS model and high-resolution structure overlap well, showing that despite the increased noise, the disk data can be used to determine an accurate solute envelope ab initio. A comparison of the predicted scattering profile from the atomic structure and the experimental data is shown in Fig. 7C, demonstrating the very good fit of the atomic structure of tetrameric GI to the LabDisk for SAXS data (χ2 = 0.75, see ESI† eqn (1)).
Dilution matrix for structural screening of protein structures
The LabDisk for SAXS provides effective means of screening multiple conditions with a minimal amount of both protein sample and buffer solutions. As a first case study, the impact of increased salt concentration on the repulsive intermolecular interaction between GI tetramers in solution was investigated. From the difference profiles obtained using the disk, the Rg was computed for each different condition (protein and salt concentration) plotted in Fig. 8A.A clear decrease of the computed Rg is observed when the protein concentration increases: from 3.3 nm at 1.8 mg ml−1 to 2.4 nm at 11 mg ml−1. Such behavior is characteristic of systems showing strong intermolecular repulsion. This observed decrease in Rg with protein concentration is significantly reduced in the presence of salt. At a GI concentration of 5.5 mg ml−1 the apparent Rg increases from 3.1 to 3.3 nm as the salt concentration is increased to 250 mM (Fig. 8B), in agreement with the Rg observed for dilute GI (<5.5 mg ml−1) in the absence of salt. At lower protein concentrations no large variation of the Rg is seen upon salt addition, presumably due to the effective protein concentration being below the critical value required for significant intermolecular repulsion to be observed.
The change in the apparent Rg of GI tetramers determined from the LabDisk for SAXS data is clearly due to a partial ordering of the protein molecules in solution, characteristic of repulsive intermolecular interaction. Interactions between proteins in solution are readily seen by SAXS, notably in the low angle region (s < 0.1 nm−1), where the observed scattering profile deviates from that of the form factor (the curve of an ideal solution at infinite dilution). Repulsion between the solutes results in a decrease in the SAXS signal at small angle. We applied a Guinier approximation to detect changes at low momentum transfers. From the resulting change in Rg, interactions between the solutes can be deduced, e.g. a decrease in the apparent Rg corresponds to a stronger repulsion between the solutes.
As glucose isomerase has an overall negative surface charge at neutral pH (pI ∼ 3), the repulsive interaction observed here can be attributed to electrostatic repulsion between the charged GI tetramers in solution. These repulsions are modulated by the addition of salts, which screen the charges of the protein:
- When the protein concentration increases (i.e. distance between solutes decreases), the interaction between the solutes increases, resulting in the decrease of the apparent Rg.
- At intermediate protein concentration (5.5 mg ml−1), the repulsions are still present and affect the Rg. When the salt concentration increases, the charges of the solute are screened, there is less repulsion between the solutes and the apparent Rg increases.
- For a lower concentration, the distances between the proteins become too large to see the interaction and no clear effect of the salt is observed.
Summary & conclusion
We have presented a SAXS sample preparation platform. The LabDisk for SAXS contains six dilution matrices on one disk. Each dilution matrix automatically generates 20 different measurement conditions, from only 2.5 μl of protein solution. We have showed high performance aliquoting, combination, mixing and read-out with less than 5% CV in protein concentration. We demonstrated aliquoting for a range of liquids with typical contact angles and viscosities on the LabDisk for SAXS. Liquid properties compatible to the LabDisk for SAXS are mainly limited due to the aliquoting principle, which is based on geometric valves. A redesigned LabDisk for SAXS could make use of newer aliquoting principles, which are compatible to a wider range of liquids, e.g. the recently presented centrifugo-pneumatic multi-liquid aliquoting, which is based on pneumatic valves, and was demonstrated to offer robust aliquoting for contact angles down to 0° and viscosities up to 4.1 mPa s.39 The presented LabDisk for SAXS is ideal for fast screening with a limited amount of sample volume to find the optimal sample conditions before eventually measuring in a low background dedicated setup that provides data with less noise but requires larger volumes of protein samples. Although the SAXS data collected with the LabDisk for SAXS are noisier than data collected with the in-vacuum flow cell of the sample changer, they can be used for basic and even advanced data analysis methods. Only 2.5 μl of protein stock solution was required for the whole dilution matrix. In comparison, the same experiments using the conventional SAXS sample changer at the BioSAXS beamline P12 would require 110 μl of protein sample volume (assuming 20 μl total volume per measurement condition). The new screening possibilities were demonstrated to monitor repulsive interactions of GI tetramers in function of both protein and NaCl concentration.For the future, we plan to optimize the integration of the LabDisk for SAXS platform in the BioSAXS beamline P12. This includes automated positioning, assisted by image recognition, which will reduce the time per measurement to 3–5 s. Furthermore, we have fabricated 200 LabDisks for SAXS with a total of 1200 dilution matrices. These disks will be made available to regular users of the P12 beamline (PETRA III, DESY).
Acknowledgements
We gratefully acknowledge financial support by the Federal Ministry of Education and Research (BMBF) in the project SAXS-CD (Verbundforschungsprojekt, project number 05K10VFB). MAG is supported by the EMBL Interdisciplinary Postdoc Programme under Marie Curie COFUND Actions.Notes and references
- C. E. Blanchet and D. I. Svergun, Annu. Rev. Phys. Chem., 2013, 64, 37–54 CrossRef CAS PubMed.
- J. P. Lafleur, D. Snakenborg, S. S. Nielsen, M. Møller, K. N. Toft, A. Menzel, J. K. Jacobsen, B. Vestergaard, L. Arleth and J. P. Kutter, J. Appl. Crystallogr., 2011, 44, 1090–1099 CAS.
- A. Spilotros and D. I. Svergun, in Encyclopedia of Analytical Chemistry, ed. R. A. Meyers, John Wiley & Sons, Ltd, Chichester, UK, 2006, pp. 1–34 Search PubMed.
- S. Skou, R. E. Gillilan and N. Ando, Nat. Protoc., 2014, 9, 1727–1739 CrossRef CAS PubMed.
- G. David and J. Pérez, J. Appl. Crystallogr., 2009, 42, 892–900 CrossRef CAS.
- G. L. Hura, A. L. Menon, M. Hammel, R. P. Rambo, F. L. Poole, S. E. Tsutakawa, F. E. Jenney, S. Classen, K. A. Frankel, R. C. Hopkins, S.-J. Yang, J. W. Scott, B. D. Dillard, Michael W. W. Adams and J. A. Tainer, Nat. Methods, 2009, 6, 606–612 CrossRef CAS PubMed.
- S. S. Nielsen, M. Møller and R. E. Gillilan, J. Appl. Crystallogr., 2012, 45, 213–223 CrossRef CAS PubMed.
- A. R. Round, D. Franke, S. Moritz, R. Huchler, M. Fritsche, D. Malthan, R. Klaering, D. I. Svergun and M. Roessle, J. Appl. Crystallogr., 2008, 41, 913–917 CrossRef CAS PubMed.
- S. Akiyama, S. Takahashi, T. Kimura, K. Ishimori, I. Morishima, Y. Nishikawa and T. Fujisawa, Proc. Natl. Acad. Sci. U. S. A., 2002, 99, 1329–1334 CrossRef CAS PubMed.
- B. Marmiroli, G. Grenci, F. Cacho-Nerin, B. Sartori, E. Ferrari, P. Laggner, L. Businaro and H. Amenitsch, Lab Chip, 2009, 9, 2063–2069 RSC.
- L. Pollack, M. W. Tate, N. C. Darnton, J. B. Knight, S. M. Gruner, W. A. Eaton and R. H. Austin, Proc. Natl. Acad. Sci. U. S. A., 1999, 96, 10115–10117 CrossRef CAS.
- L. Pollack, M. W. Tate, A. C. Finnefrock, C. Kalidas, S. Trotter, N. C. Darnton, L. Lurio, R. H. Austin, C. A. Batt, S. M. Gruner and S. G. J. Mochrie, Phys. Rev. Lett., 2001, 86, 4962–4965 CrossRef CAS PubMed.
- R. Graceffa, R. P. Nobrega, R. A. Barrea, S. V. Kathuria, S. Chakravarthy, O. Bilsel and T. C. Irving, J. Synchrotron Radiat., 2013, 20, 820–825 CrossRef CAS PubMed.
- C. E. Blanchet, A. Spilotros, F. Schwemmer, M. A. Graewert, A. Kikhney, C. M. Jeffries, D. Franke, D. Mark, R. Zengerle, F. Cipriani, S. Fiedler, M. Roessle and D. I. Svergun, J. Appl. Crystallogr., 2015, 48, 431–443 CrossRef CAS PubMed.
- A. Martel, M. Burghammer, R. Davies, E. Dicola, P. Panine, J.-B. Salmon and C. Riekel, Biomicrofluidics, 2008, 2, 24104 CrossRef PubMed.
- M. Trebbin, D. Steinhauser, J. Perlich, A. Buffet, S. V. Roth, W. Zimmermann, J. Thiele and S. Förster, Proc. Natl. Acad. Sci. U. S. A., 2013, 110, 6706–6711 CrossRef CAS PubMed.
- R. Stehle, G. Goerigk, D. Wallacher, M. Ballauff and S. Seiffert, Lab Chip, 2013, 13, 1529–1537 RSC.
- K. N. Toft, B. Vestergaard, S. S. Nielsen, D. Snakenborg, M. G. Jeppesen, J. K. Jacobsen, L. Arleth and J. P. Kutter, Anal. Chem., 2008, 80, 3648–3654 CrossRef CAS PubMed.
- O. Strohmeier, M. Keller, F. Schwemmer, S. Zehnle, D. Mark, F. von Stetten, R. Zengerle and N. Paust, Chem. Soc. Rev., 2015, 44, 6187–6229 RSC.
- P. Andersson, G. Jesson, G. Kylberg, G. Ekstrand and G. Thorsén, Anal. Chem., 2007, 79, 4022–4030 CrossRef CAS PubMed.
- C. T. Schembri, T. L. Burd, A. R. Kopf-Sill, L. R. Shea and B. Braynin, J. Autom. Chem., 1995, 17, 99–104 CrossRef CAS PubMed.
- H. Hwang, Y. Kim, J. Cho, J.-y. Lee, M.-S. Choi and Y.-K. Cho, Anal. Chem., 2013, 85, 2954–2960 CrossRef CAS PubMed.
- G. Li, Q. Chen, J. Li, X. Hu and J. Zhao, Anal. Chem., 2010, 82, 4362–4369 CrossRef CAS PubMed.
- C. P. Steinert, J. Mueller-Dieckmann, M. Weiss, M. Roessle, R. Zengerle and P. Koltay, Proc. of MEMS, 2007, 561–564 Search PubMed.
- A. Round, F. Felisaz, L. Fodinger, A. Gobbo, J. Huet, C. Villard, C. E. Blanchet, P. Pernot, S. McSweeney, M. Roessle, D. I. Svergun and F. Cipriani, Acta Crystallogr., Sect. D: Biol. Crystallogr., 2015, 71, 67–75 CrossRef CAS PubMed.
- D. C. Duffy, H. L. Gillis, J. Lin, N. F. Sheppard and G. J. Kellogg, Anal. Chem., 1999, 71, 4669–4678 CrossRef CAS.
- Z. Noroozi, H. Kido, M. Micic, H. Pan, C. Bartolome, M. Princevac, J. Zoval and M. Madou, Rev. Sci. Instrum., 2009, 80, 75102 CrossRef PubMed.
- W. Bedingham and B. W. Robole, US8057757 B2, 3M Innovative Properties Company, 2010.
- M. V. Petoukhov, D. Franke, A. V. Shkumatov, G. Tria, A. G. Kikhney, M. Gajda, C. Gorba, H. D. T. Mertens, Haydyn D. T., P. V. Konarev and D. I. Svergun, J. Appl. Crystallogr., 2012, 45, 342–350 CAS.
- Hahn-Schickard, Lab-on-a-Chip Design + Foundry Service, 2015, available at: http://www.hahn-schickard.de/en/manufacturing/labon-a-chip-design-foundry-service/ Search PubMed.
- D. Kosse, F. Schwemmer, D. Buselmeier, R. Zengerle and F. von Stetten, Transducers Eurosens. XXVII, Int. Conf. Solid-State Sens., Actuators Microsyst., 17th, 2013, 2013 Search PubMed.
- D. Franke, A. G. Kikhney and D. I. Svergun, Nuclear Instruments and Methods in Physics Research Section A: Accelerators, Spectrometers, Detectors and Associated Equipment, 2012, 689, 52–59 CrossRef CAS.
- A. Guinier, La diffraction des rayons X aux tres petits angles; application a l'etude de phenomenes ultramicroscopiques, Ann. Phys., 1939, 12, 161–237 CAS.
- Di Svergun, Biophys. J., 1999, 76, 2879–2886 CrossRef CAS PubMed.
- D. Svergun, C. Barberato and M. H. J. Koch, J. Appl. Crystallogr., 1995, 28, 768–773 CrossRef CAS.
- P. Concus and R. Finn, Proc. Natl. Acad. Sci. U. S. A., 1969, 63, 292 CrossRef CAS.
- P. Concus and R. Finn, Acta Mater., 1974, 132, 177–198 CrossRef.
- O. Glatter and O. Kratky, Small angle X-ray scattering, Academic press, 1982 Search PubMed.
- F. Schwemmer, T. Hutzenlaub, D. Buselmeier, N. Paust, F. von Stetten, D. Mark, R. Zengerle and D. Kosse, Lab Chip, 2015, 15, 3250–3258 RSC.
Footnote |
| † Electronic supplementary information (ESI) available: Photographs of the disk in the beamline, the processing device, additional SAXS data, the formula for calculation of χ2 and information on dead volume in the disk. See DOI: 10.1039/c5lc01580d |
| This journal is © The Royal Society of Chemistry 2016 |

