 Open Access Article
Creative Commons Attribution 3.0 Unported Licence
High-resolution continuum source graphite furnace atomic absorption spectrometry for the monitoring of Au nanoparticles
Martín
Resano
 *,
Esperanza
Garcia-Ruiz
and
Raul
Garde
University of Zaragoza, Department of Analytical Chemistry, Aragón Institute of Engineering Research (I3A), Zaragoza, 50009, Spain. E-mail: mresano@unizar.es
First published on 2nd September 2016
Abstract
This work investigates the possibility of obtaining information on the chemical form (ionic or as Au nanoparticles (NPs)) in which Au is found in solutions by means of high-resolution continuum source graphite furnace atomic absorption spectrometry (HR CS GFAAS), without the need to use any additional separation step or any extra technique. It is demonstrated that proper optimization of the temperature program, using a very slow heating ramp (150 °C s−1) during the atomization step and a sufficiently high atomization temperature (2200 °C) in the absence of chemical modifiers, enables a fast and simple screening to be performed, since the signal profiles obtained for solutions/suspensions of ionic Au and AuNPs are very dissimilar. Moreover, in the case of finding NPs, it is possible to estimate the average particle size, because this parameter appears to be directly related with the time of appearance of the maximum peak height (a value of 27.7 nm ± 8.8 nm was estimated for NIST Reference Material 8012 Gold nanoparticles, nominal 30 nm diameter). The proposed procedure offers a limit of detection of 5.5 pg (0.55 μg L−1) and a linear range up to 10 ng (1000 μg L−1), and was further validated by spiking a natural water certified reference material (CRM KEJIM 02). The occurrence of mixtures of ionic Au and AuNPs seems to be more complicated to resolve if quantitative information is aimed at (e.g., calculating the exact amount found in each form) because, even though the mixture behaves as predicted by summing the individual signals of ionic Au and AuNPs, signal overlaps can be anticipated and, thus, proper signal deconvolution should be carried out.
1. Introduction
The number of fields in which nanotechnology is having a profound impact is increasing every year. In particular, metallic nanoparticles (NPs) offer unique properties for biomedical applications, making it feasible to develop new strategies for imaging, detection and diagnosis, therapy and drug delivery.1,2 Typically, noble metal NPs are employed for these tasks, and, among them, Au, the quintessential noble element, is the most popular one in biomedicine. AuNPs offer a high surface-to-volume ratio together with a high surface reactivity, and an unoxidized quality that results in high stability. Moreover, AuNPs show size-related and tunable electronic, magnetic, biological and optical properties.3 AuNPs can enter cells faster than other molecules and accumulate at sites of tumor growth. Their photophysical properties enable their use in biodiagnostic assays, their potential to convert radiation into heat permits the selective thermal ablation of tissues and, furthermore, they can act as effective carriers for drug delivery to hardly accessible regions of the body.4Despite the exciting possibilities opened by the use of NPs, there is also an increasing concern for their safety and biocompatibility. Bulk Au compounds have always been considered as practically inert. However, as the size dwindles to the nanoscopic dimension, it is obvious that Au behaves in a different way, as discussed before. Therefore, the same unique properties that make these NPs so promising in biomedicine (e.g., the facility to cross the blood–brain barrier, to enter cells, and to interact with proteins), could make them also potentially toxic.5 That is why more studies on their environmental impact and their possible effects on human health are being carried out,6 as regulatory agencies become more aware of this issue.7
Many techniques are used nowadays to characterize NPs, including AuNPs. Microscopy techniques (such as transmission electron microscopy-TEM or scanning electron microscopy-SEM) offer a very high resolution to detect even the smallest NPs (down to 1 nm). However, there is still a need to develop faster, cheaper and more straightforward approaches, that can be available in most analytical labs and that provide quantitative results.
Next to the use of UV-vis,8 the use of inductively coupled plasma mass spectrometry (ICPMS) is becoming increasingly popular for this type of applications.9–11 Its high detection power not only permits to quantify the total amount of the target metal present in a sample, but also, either directly using the so-called single particle mode (SP),12–14 or after coupling with a separation technique such as flow-field fractionation,11,15 ICPMS provides information about the size of the NPs present. Unfortunately, like most techniques, when the target sample is a solid or a complex liquid material, it is necessary to carry out preparation steps (e.g., digestion), with the subsequent risk of altering the original form and size in which the NPs are found in the sample.
Alternatively, graphite furnace atomic absorption spectrometry (GFAAS) has been seldom used for nanoparticle characterization, except for quantification of the total metallic content, either after sample digestion16 or taking advantage of the potential of this technique, particularly when high-resolution continuum source (HR CS) devices are deployed,17 for the direct analysis of solid samples and complex matrices.18,19 It has thus been demonstrated that HR CS GFAAS enables the fast, simple and direct quantification of Au in biological samples, but perhaps it could provide even further information.18
Typically, when bulk analysis is intended via GFAAS, the working conditions (e.g., temperature program, use of chemical modifiers, etc.) are optimized such that any possible difference in the original chemical form in which the analyte is introduced into the furnace is minimized and the signal profiles obtained are very similar, regardless of the exact chemical species to which they correspond.
However, there is also the possibility of optimizing the working conditions such that differences in the chemical form are actually maximized and translate into different signal profiles. It was first demonstrated by Gagné et al.,20 and later confirmed by Feichtmeier & Leopold,21,22 that Ag+ and AgNPs do not atomize in an equal manner, particularly in the presence of a matrix, which tend to interact more with Ag+. These pioneering works already demonstrate the potential of the technique for the direct analysis of solid samples,21,22 but there is still a clear need to investigate: (i) if the technique can also provide satisfactory results for other NPs beside Ag; (ii) what is the best strategy to maximize differences between ionic species and NPs; and (iii) what signal parameters should be evaluated to get the best correlation with the nanoparticle size.
The purpose of this work is to explore the use of HR CS GFAAS for the characterization of AuNPs for the first time, aiming at developing a methodology that permits to first establish if Au is present in the ionic form, as NPs or in both ways, and, in the second case, to estimate its mean size.
2. Experimental
2.1. Instrumentation
All the experiments were carried out using a high-resolution continuum source atomic absorption spectrometer (ContrAA 700, Analytik Jena, Jena, Germany), which is equipped with a transversely heated graphite furnace atomizer in tandem with a flame atomizer. Only the graphite furnace was used throughout this work. The optical system of this instrument comprises a xenon short-arc lamp operating in ‘hot-spot’ mode as the radiation source, a high-resolution double echelle monochromator, and a linear CCD array detector with 588 pixels. 200 of these pixels are used to measure the absorbance, while the rest are used for internal corrections. More details on this type of instrument can be found elsewhere.23 Pyrolytic graphite tubes with platforms incorporated were used in this work, although some experiments based on wall atomization were also performed (see Section 3.1.).2.2. Standards, samples and reagents
Purified water was obtained from a Milli-Q system (Millipore, Billerica, USA). Au ionic solutions were daily prepared by proper dilution of a 1 g L−1 single-element standard (Merck, Darmstadt, Germany) in HCl 0.12 M. Pd solutions were also prepared from a 1 g L−1 single-element standard (Merck) using purified water. H2SO4 diluted solutions were made from a concentrated (98%) solution (Merck). Cysteine and thiourea solutions were prepared from the respective solid reagents, diluted in HCl 0.12 M. All the reagents were of analytical grade or higher purity.AuNPs in the form of water suspensions were acquired from Nanocomposix (Prague, Czech Republic). The particle size distribution of these suspensions was characterized by TEM and their exact concentration was determined by ICPMS. Such information is provided by the manufacturer and is shown in Table 1. Additionally, another water suspension containing AuNP was purchased from the National Institute of Standards and Technology (NIST, Gaithersburg, USA): Reference Material 8012 Gold nanoparticles, nominal 30 nm diameter. The certificate of this material provides the NP size as estimated using 6 different techniques, with values ranging between 24.9 and 28.6 nm. However, perhaps the most accepted value is the one obtained via TEM (27.6 ± 2.1 nm).
| Intended NP size/nm | Real mean NP size/nm | Standard deviation/nm | Concentration/g L−1 |
|---|---|---|---|
| 5 | 4.7 | 0.6 | 0.052 |
| 20 | 19.6 | 2.1 | 0.051 |
| 50 | 49.0 | 11.3 | 0.052 |
| 80 | 75.7 | 10.1 | 0.055 |
| 100 | 100.0 | 7.4 | 0.052 |
These suspensions were further diluted in HCl 0.12 M to the required final content (5–1000 μg L−1), prior to HR CS GFAAS monitoring. To avoid particle agglomeration, the original suspensions were sonicated for 5 minutes before their dilution, and the final working suspensions were sonicated for 5 minutes before HR CS GFAAS measurements.
For evaluating the performance of the method with an environmental sample, the certified reference material KEJIM 02, soft water from Kejimkujik Lake (lot 0914), was purchased from Environment Canada (Burlington, Canada) and spiked with the suspensions of the NPs of different sizes or with the Au ionic standard, until the intended Au concentration was reached. The same procedure regarding sonication that is described above was followed.
3. Results and discussion
3.1. Au monitoring by GFAAS. Enhancing differences between ions and NPs
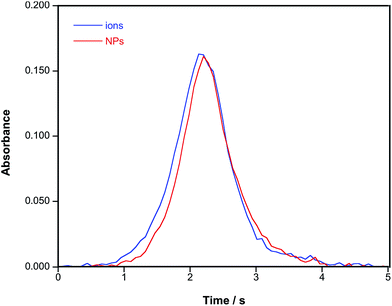
It has already been discussed that Au shows a relatively complex vaporization and atomization mechanism in a graphite furnace, which typically leads to the formation of double peaks. It has been postulated that the first of these peaks corresponds with the atomization of Au from microdroplets, and the second with the interaction of Au with some carbon active sites that delayed its atomization. The problem is further aggravated when the tube ages.24 In the presence of a chemical modifier that increases the presence of active carbon sites (ascorbic acid),25 the second peak becomes even more pronounced.However, when a more traditional chemical modifier, such as Pd, is added, its atoms tend to occupy these active sites on the graphite surface. Au will interact with this modifier and it will be stabilized until a sufficiently high temperature is reached, such that Pd begins to vaporize and Au is finally released.26 This basically means that using Pd is a very efficient way to obtain well-defined, unimodal and reproducible peak profiles when trying to carry Au bulk determination, regardless of the exact chemical form in which Au is introduced into the furnace, because this interaction with Pd will be the key aspect controlling the Au atomization mechanism.18,26 For instance, Fig. 1 shows the signal profiles obtained for an Au ionic standard and for an AuNP suspension of a similar content in the presence of 10 μg of Pd. It can be seen that the peak profiles and their areas are almost identical.
Obviously, using this conventional GFAAS approach based on the addition of Pd is actually detrimental to separate ionic species from NPs. And, in addition to Pd, other basic aspects that characterize the stabilized temperature platform furnace (STPF) concept, such as the use of a fast atomization ramp, must be revisited as well when the goal is to maximize the difference between vaporization/atomization mechanisms as a function of the chemical species, instead of minimizing them.
The first article available on this topic, working with AgNP aqueous suspensions, revealed that, for this element, when using low atomization temperatures (1700 °C) the signal for ionic species was significantly higher, and the signal for the AgNPs decreased with size.20 In other words, it was easier to atomize ionic silver (which shows the smaller size) and small NPs rather than large ones, which could be expected. However, the selectivity of the method was low, as it did not allow discrimination between AgNPs of 20 and 60 nm. A more thorough study was carried out later by Feichtmeier & Leopold, which evidenced the need for optimization of the different parameters of the temperature program to achieve a better resolution. In that work, the signal for AgNPs appear before that of ionic Ag. The authors' explanation was that, since they were investigating a direct solid sampling approach, ionic Ag interacted more strongly with the matrix, leading to a delayed signal.21 A later work of this research group proved that this aspect cannot be generalized to all types of solid samples.22
Having all these ideas in mind, an optimization was carried out to check to what extent it was possible to discriminate between ionic Au and AuNPs using HR CS GFAAS. It seems logical to expect that using a slow temperature ramp in the atomization step could be beneficial, because that gives more time for the atomization to proceed and probably would maximize differences among species exhibiting different vaporization/atomization mechanisms. For a given GFAAS instrument, Au typically requires a bit higher atomization temperature than Ag, which may further increase this effect. The risk of using slow ramps is that obviously the signal may show a wider, lower peak profile, with a somewhat higher peak area, but a worse signal to background ratio, which is why fast ramps are recommended under STPF conditions.
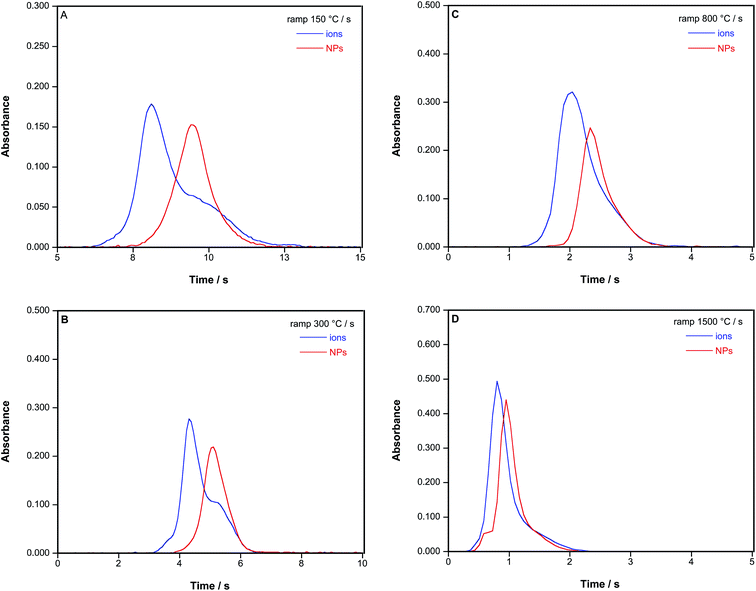
Fig. 2 shows the results observed for an Au ionic standard and for an AuNP suspension using a variable atomization heating ramp. It is obvious that the signals for ionic Au or AuNPs are very different in shape, particularly with low heating ramps (150–300 °C s−1), which permits a first fast screening: ionic Au signals always appear before and tend to show a double peak, hinting at a two-stage vaporization/atomization mechanism, as discussed before,26 whereas AuNPs show a delayed but very Gaussian-like peak. The difference in the time of appearance of the maximum of these peaks increases with a slower heating ramp, up to more than 1 second for 150 °C s−1. Quantitative data on this aspect are provided in Table 3.
| a A value of 150 °C s−1 was finally selected as the optimum. | |
|---|---|
| Wavelength | 242.795 nm |
| Number of detector pixels summed per line | 3 (4.20 pm) |
| Sample volume | 10 μL |
| Temperature program | ||||
|---|---|---|---|---|
| Step | Temperature/°C | Ramp/°C s−1 | Hold/s | Ar gas flow/L min−1 |
| Drying | 90 | 3 | 20 | 2.0 |
| Drying | 110 | 5 | 10 | 2.0 |
| Pyrolysis | 300 | 50 | 30 | 2.0 |
| Pyrolysis | 300 | 0 | 5 | 0.0 |
| Atomization | 2200 | Variablea | 10 | 0.0 |
| Cleaning | 2450 | 500 | 4 | 2.0 |
| Heating ramp/°C s−1 | Peak maximum for ionic Au/s | Peak maximum for AuNPs/s | Δt/s | u Δt/s |
|---|---|---|---|---|
| 150 | 8.175 | 9.489 | 1.314 | 0.073 |
| 300 | 4.321 | 5.073 | 0.752 | 0.053 |
| 800 | 1.995 | 2.287 | 0.292 | 0.042 |
| 1500 | 0.817 | 0.967 | 0.150 | 0.049 |
The only negative aspect detected is that this characteristic double peak obtained in the absence of chemical modifiers and using slow heating during the atomization step is too wide to enable a complete separation of the signal profiles, thus making it difficult to quantify mixtures of ionic Au and NPs.
According to the hypothesis discussed before, this tail/second peak corresponds to the Au reduced from carbon sites. That means it is actually produced from metallic Au already reduced in the furnace, which could ultimately be in the form of NPs, so it seems difficult to completely avoid this overlap.
Further experiments were carried out to improve this situation. In particular, the addition of some compounds containing S was evaluated, in the hope that these could interact more with ionic species and alter their atomization/vaporization mechanism. Cysteine and thiourea solutions, as well as diluted H2SO4, were tested for this purpose. However, no significant gain was attained. Direct atomization from the tube wall was also studied, but the results were more irreproducible and the difference in time between the signals of ionic Au and AuNPs did not increase.
Therefore, in the end, a heating ramp of 150 °C s−1 for the atomization step was adopted for further work, and no chemical modifier was added.
The atomization temperature was also optimized, as this is probably another key parameter to achieve the best possible separation between AuNPs and Au ions. Atomization curves were carried out and it was confirmed that AuNPs (76 nm) required a higher temperature (1500 °C) to reach the maximum signal than Au ions (1400 °C).
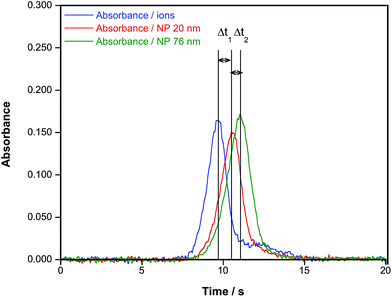
To take advantage of this fact, further studies were carried out using different atomization temperatures and the same heating ramp established before. A solution of ionic Au and two different aqueous suspensions of AuNPs (20 and 76 nm) were measured. The results are presented in Table 4 and an example is also shown in Fig. 3.
| Temperature/°C | Δt1/s | Δt2/s | u Δt1/s | u Δt2/s |
|---|---|---|---|---|
| 2000 | 0.73 | 0.44 | 0.21 | 0.15 |
| 2200 | 1.17 | 0.60 | 0.10 | 0.13 |
| 2400 | 1.48 | 0.44 | 0.16 | 0.12 |
These measurements confirmed that ionic Au exhibits its typical earlier, double peak profile, while AuNPs tend to provide well-defined Gaussian-like peaks that appear delayed according to their size (see Fig. 3). These differences can be considered as logical, because large NPs should require more energy for vaporization and complete atomization (thus the delay to higher times and therefore higher temperatures), but once a large NP is vaporized and atomized, it releases more atoms simultaneously, thus a narrower peak could be expected, although the homogeneity of the NP size distribution may also play a role in that regard.
The use of a higher atomization temperature seems to increase the differences regarding the appearance of the maximum peak height. This can be explained by the longer time needed to reach the final temperature, thus providing extra time to maximize the differences between the atomization mechanisms operating for the different species. However, while the difference between ionic Au and small AuNPs (20 nm) increases with temperature, the difference between the NPs of different sizes (20 and 76 nm) is always smaller and does not increase above 2200 °C (see Table 4). Thus, a still moderate atomization temperature of 2200 °C was used for further work, to preserve the lifetime of graphite parts.
Concerning the peak areas, the values obtained for AuNPs and ionic Au were always similar, and their 95% confidence intervals overlapped. It is thus confirmed that the peak area can be related to the total Au amount, regardless of the form (ionic or NP) and the NP size in which Au is found.18
3.2. Evaluation of different parameters to characterize the NP size
Different solutions/suspensions of ionic Au and of AuNPs of different sizes were measured using the conditions described in Table 2 to check the potential of the method for their discrimination.Considering the results presented in Section 3.1., the time at which the peak maximum appears (termed atomization delay in ref. 21) is therefore an obvious parameter to consider in order to characterize the size of the NPs, and it will be referred to as tmax from now on. However, there are also some alternative parameters to examine. Feichtmeier & Leopold also proposed the study of the atomization rate, calculated as the slope of the curve at the first inflection point.21 Thus, we also evaluated this parameter, which will be referred to as kat. In order to do so, the experimental values of the rising portion of every signal profile (at least 50 points per absorbance peak) were fitted by linear least squares and the corresponding slope was calculated. Good linearity was always obtained (r2 ≥ 0.9) in this process. Finally, the peak width at 50% of the maximum peak height (Δt1/2) was calculated as well, to see if it could help in providing some tendency. Fig. 4 illustrates what these parameters represent.
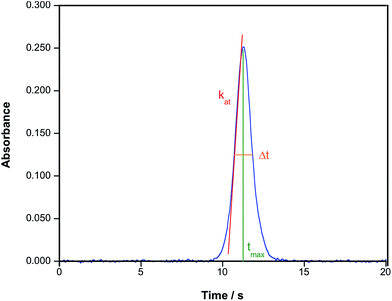 | ||
| Fig. 4 Example of the time-resolved absorbance signal obtained for a suspension of AuNPs (76 nm) in aqueous media showing the different parameters evaluated in this work. | ||
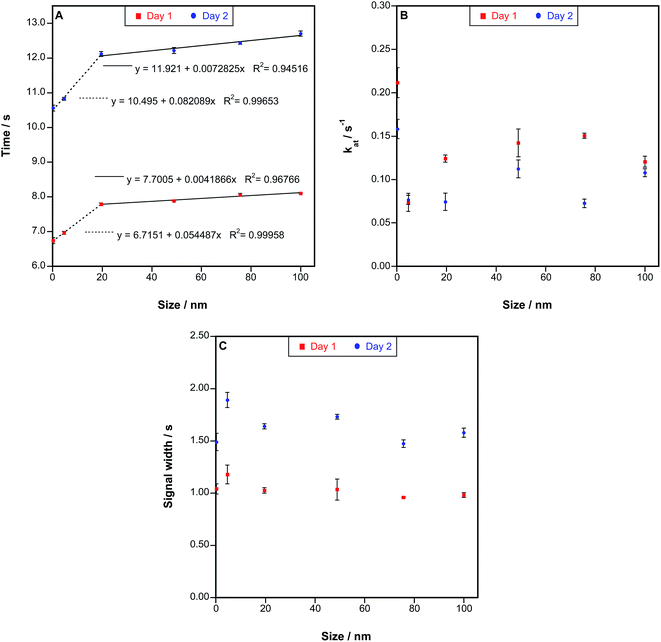
The values obtained with all these parameters are shown in Fig. 5, where results for two different days separated in time by two weeks are shown. Fig. 5A displays the values of tmaxversus the size of the particles introduced into the furnace. The same behavior was always found when evaluating this parameter, which clearly depends on the particle size of Au species. It is interesting to notice that the time difference is particularly clear for smaller NPs instead of for larger NPs, for which a second region of linearity is found, but its slope is smaller. This may be relevant because for other techniques (e.g., SP-ICPMS) differentiating NPs below 10–20 nm is particularly difficult for Au and for most other metals,6,13 so HR CS GFAAS could play a complementary role to identify these small sizes. As for the uncertainty, the variation in the appearance of the maximum peak height was typically found to be in the range of 0.5–1.0 RSD%.
It also needs to be noted that, in order to use this parameter to establish the average size of an AuNP suspension, it is important to calibrate every day. The reason is that the slope of the curves shown in Fig. 5A may vary significantly with time. It was observed that when a novel tube is used the signals appear before, and when the tube ages tmax is delayed. Thus, calibrating when starting a new session using at least ionic Au, a suspension of 20 nm and another one of 76 nm or higher, as these points define well the overall behavior, is recommended.
Regarding the rest of the parameters, much less satisfactory results were observed. The atomization rate seems to be related to the particle size of the NPs (see Fig. 5B), as larger NPs tend to show higher atomization rates, but the uncertainty of the measurements is higher (up to 14% RSD), so the trend is not always clear. However, this parameter was found to be even higher for ionic Au (as could be expected when looking at the signals shown in Fig. 2 and 3). Thus, this parameter decreases first when comparing ionic Au and small AuNPs, and increases for larger NPs, which make it much more complicated to screen the presence of NPs of unknown size in a sample. Finally, it was proved during the experiments carried out in Section 3.3. that this value also depends on the AuNP concentration, making its use not recommended. As for the last parameter (Δt1/2), no clear trend was observed.
Overall, the time at which the maximum peak height appears seems to be the most appropriate parameter to discriminate among AuNPs of different sizes and ionic Au.
As a proof of principle, another AuNP suspension available from a different manufacturer (NIST) was also measured on 3 different days, and its tmax value was interpolated in curves as those shown in Fig. 5A, which were constructed every day. The average value obtained was 27.7 nm ± 8.8 nm, while the value provided by NIST for this sample was 27.6 ± 2.1 nm using TEM. Obviously, this agreement is remarkable.
3.3. Analytical performance
Different analytical parameters were estimated using a suspension of AuNP of 76 nm. The limit of detection (LOD, 3s definition) was calculated via the monitoring of ten blank replicates and the construction of a calibration curve and was found to be 5.5 pg (0.55 μg L−1 for 10 μL of the sample), proving the usefulness of the approach for trace analysis.For the sake of comparison, it can be mentioned that when using SP-ICPMS typically the Au concentrations measured are even lower. The goal with such a technique is to be able to measure individual NPs and, thus, samples are diluted to approx. 0.05 μg Au L−1, to prevent several NPs from being simultaneously monitored. However, that is precisely the reason why it is very difficult to characterize AuNPs below 10 nm at the moment with SP-ICPMS, as discussed before.6,13 In terms of time, every replicate requires 2–3 minutes with GFAAS, and usually 1 minute with SP-ICPMS.
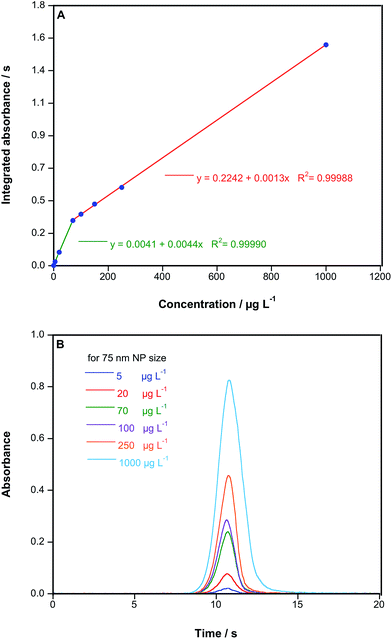
Linearity was also explored. The results obtained are shown in Fig. 6. As can be seen in Fig. 6A, two areas of linearity can be differentiated: up to 70 μg L−1, and from there up to 1000 μg L−1, a behavior that has already been reported for other elements when using HR CS GFAAS.27 Thus, quantification over a wide range of three orders of magnitude, without the need to alter the working conditions, is feasible.
Moreover, Fig. 6B, demonstrates that tmax remains unchanged regardless of the concentration of Au introduced into the furnace. This is obviously a critical issue, because this parameter is the key one to discriminate among NP sizes, as discussed in the previous section. Moreover, it can also be easily observed from this figure that kat clearly increases with the concentration, and Δt1/2 follows the same trend, as large amounts tend to provide wider signals. Thus, these last two parameters would not be useful for comparing suspensions with different contents.
As a proof of concept, a sample was selected to evaluate the potential matrix influence on the results: the certified reference material KEJIM 02, soft water from Kejimkujik Lake, which is a natural water sample. It contains several ions (e.g., SO42− and Cl−) at the mg L−1 that could potentially interact with Au, as well as total dissolved carbon. This sample was spiked with 50 μg L−1 of ionic Au and of AuNPs of different sizes and measured using the parameters shown in Table 2. The results are shown in Fig. 7. As can be seen, the same behavior already described in Section 3.2. was found. tmax increases with the NP size, and such an increase is less pronounced after 20 nm. The signal profiles obtained were also very similar to those discussed before for aqueous solutions/suspensions. kat seems to increase with size, but the reproducibility of this parameter is again poor (up to 15% RSD), and Δt1/2 provides no significant difference. Overall, it can be concluded that the presence of this environmental matrix does not result in any interference.
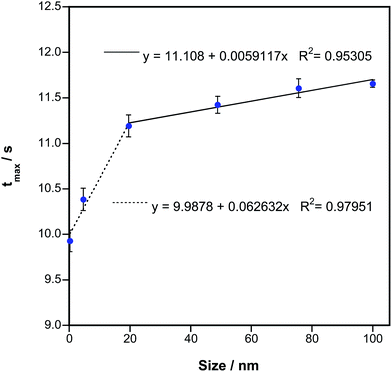 | ||
| Fig. 7 Correspondence of tmax with the AuNP size for KEJIM-02 solutions/suspensions spiked with 70 μg L−1 of ionic Au or AuNPs. Uncertainties represent the standard deviation of 5 replicates. | ||
An issue that may be relevant to stress again is that the slope of the curves observed during this experiment are not the same as those found before (see Fig. 5A and 7). In other words, the difference in the value of tmax for ionic Au and AuNPs is not a constant parameter, such that calibration has to be carried out every day. This cannot be attributed to the influence of the matrix, but it was found to depend on the condition of the tube and platform used, as discussed already in Section 3.2.
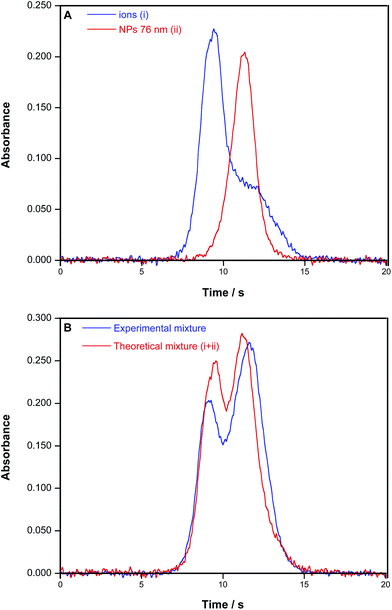
Finally, additional experiments were performed to evaluate the situation in which both ionic Au and AuNPs are present. For this, two aqueous solutions were spiked with ionic Au and with AuNPs of 76 nm of average size, respectively, while a third one was spiked with both, prior to HR CS GFAAS monitoring. As discussed before, it is very simple to differentiate the signal for ionic Au from that found for an AuNP suspension, as their profiles and tmax are very different (see Fig. 8A). When a mixture is encountered, a signal with clearly two peaks is obtained (Fig. 8B), which moreover agrees remarkably well with what could be expected by summing the separate signals shown in Fig. 8A (less than 0.1% difference in areas). However, the separate quantification of ionic Au and AuNPs in the case of being found together is more complicated, because the NP peak practically overlaps with the second peak/tailing of the ionic Au signal. A deconvolution model could be developed in the case of a low ionic Au/AuNP molar ratio, but in the reversed situation, it seems rather difficult to obtain accurate results. This is not only a problem from HR CS GFAAS, as for other techniques (e.g., SP-ICPMS) it also becomes increasingly difficult to characterize small NPs in the presence of a high amount of the dissolved target element.
4. Conclusions
Under optimized conditions, which are not the ones typically used for bulk analysis but instead require the use of a suitably slow atomization ramp, HR CS GFAAS can provide valuable information to screen the presence of AuNPs in an inexpensive, fast and simple way.In fact, the temporal signal profiles observed for ionic Au and AuNPs are very different. Moreover, the time of appearance of the maximum peak height is related to the particle size, because the atomization of larger particles is delayed in time. Thus, a quick estimation of the form (ionic or NP) and even mean size (in the case of NPs) in which Au is found in a solution/suspension can be carried out, with minimal requirements regarding the sample volume (μLs), and preserving quantitative information, which is related to the peak area, as usual.
Quantification of mixtures of NPs and ionic species appears more problematic, owing to the need to properly deconvolute two overlapping peaks. However, the procedure proposed should be fully compatible with simple sample preparation approaches that are being currently deployed to separate NPs from ionic species (e.g., cloud point extraction) prior to GFAAS analysis.28–30 Future work will be focused on the direct monitoring of AuNPs in solid samples, as HR CS GFAAS may provide unique information in this regard.
Acknowledgements
This work acknowledges the funding obtained via CTQ2015-64684-P (MINECO/FEDER) and from the Aragón Government (Fondo Social Europeo and project Innova-A1-020-15), as well as from Inycom S.A.References
- T. L. Doane and C. Burda, Chem. Soc. Rev., 2012, 41, 2885–2911 RSC.
- R. R. Arvizo, S. Bhattacharyya, R. A. Kudgus, K. Giri, R. Bhattacharya and P. Mukherjee, Chem. Soc. Rev., 2012, 41, 2943–2970 RSC.
- Y. Ju-Nam and J. R. Lead, Sci. Total Environ., 2008, 400, 396–414 CrossRef CAS PubMed.
- E. C. Dreaden, A. M. Alkilany, X. Huang, C. J. Murphy and M. A. El-Sayed, Chem. Soc. Rev., 2012, 41, 2740–2779 RSC.
- K. L. Aillon, Y. Xie, N. El-Gendy, C. J. Berkland and M. L. Forrest, Adv. Drug Delivery Rev., 2009, 61, 457–466 CrossRef CAS PubMed.
- S. Lee, X. Bi, R. B. Reed, J. F. Ranville, P. Herckes and P. Westerhoff, Environ. Sci. Technol., 2014, 48, 10291–10300 CrossRef CAS PubMed.
- S. Barlow, A. Chesson, J. D. Collins, A. Flynn, A. Hardy, K. D. Jany, A. Knaap, H. Kuiper, J. C. Larsen, P. Le Neindre, J. Schans, J. Schlatter, V. Silano, S. Skerfving and P. Vannier, EFSA J., 2009, 958, 1–39 Search PubMed.
- L. Yu and A. Andriola, Talanta, 2010, 82, 869–875 CrossRef CAS PubMed.
- P. Krystek, A. Ulrich, C. C. Garcia, S. Manohar and R. Ritsema, J. Anal. At. Spectrom., 2011, 26, 1701–1721 RSC.
- P. Krystek, Microchem. J., 2012, 105, 39–43 CrossRef CAS.
- A. R. Montoro Bustos, J. R. Encinar and A. Sanz-Medel, Anal. Bioanal. Chem., 2013, 405, 5637–5643 CrossRef PubMed.
- C. Degueldre, P. Y. Favarger and S. Wold, Anal. Chim. Acta, 2006, 555, 263–268 CrossRef CAS.
- J. Liu, K. E. Murphy, R. I. MacCuspie and M. R. Winchester, Anal. Chem., 2014, 86, 3405–3414 CrossRef CAS PubMed.
- R. Peters, Z. Herrera-Rivera, A. Undas, M. van der Lee, H. Marvin, H. Bouwmeester and S. Weigel, J. Anal. At. Spectrom., 2015, 30, 1274–1285 RSC.
- B. Meermann and F. Laborda, J. Anal. At. Spectrom., 2015, 30, 1226–1228 RSC.
- G. M. Fent, S. W. Casteel, D. Y. Kim, R. Kannan, K. Katti, N. Chanda and K. Katti, Nanomedicine, 2009, 5, 128–135 CAS.
- M. Resano, M. Aramendía and M. A. Belarra, J. Anal. At. Spectrom., 2014, 29, 2229–2250 RSC.
- M. Resano, E. Mozas, C. Crespo, J. Briceño, J. del Campo-Menoyo and M. A. Belarra, J. Anal. At. Spectrom., 2010, 25, 1864–1873 RSC.
- M. Resano, A. C. Lapeña and M. A. Belarra, Anal. Methods, 2013, 5, 1130–1139 RSC.
- F. Gagné, P. Turcotte and C. Gagnon, Anal. Bioanal. Chem., 2012, 404, 2067–2072 CrossRef PubMed.
- N. S. Feichtmeier and K. Leopold, Anal. Bioanal. Chem., 2014, 406, 3887–3894 CrossRef CAS PubMed.
- N. S. Feichtmeier, N. Ruchter, S. Zimmermann, B. Sures and K. Leopold, Anal. Bioanal. Chem., 2016, 408, 295–305 CrossRef CAS PubMed.
- B. Welz, H. Becker-Ross, S. Florek and U. Heitmann, High-resolution continuum source AAS. The better way to do atomic absorption spectrometry, Wiley-VCH, Weinheim, 2005 Search PubMed.
- M. Resano, M. Aramendía, E. Garcia-Ruiz and M. Belarra, J. Anal. At. Spectrom., 2005, 20, 479–481 RSC.
- E. Iwamoto, M. Itamoto, K. Nishioka, S. Imai, Y. Hayashi and T. Kumamaru, J. Anal. At. Spectrom., 1997, 12, 1293–1296 RSC.
- N. S. Thomaidis, E. A. Piperaki and C. E. Efstathiou, Spectrochim. Acta, Part B, 1999, 54, 1303–1320 CrossRef.
- B. Welz, L. M. G. dos Santos, R. G. O. Araujo, S. D. C. Jacob, M. G. R. Vale, M. Okruss and H. Becker-Ross, Spectrochim. Acta, Part B, 2010, 65, 258–262 CrossRef.
- G. Hartmann and M. Schuster, Anal. Chim. Acta, 2013, 761, 27–33 CrossRef CAS PubMed.
- I. López-García, Y. Vicente-Martínez and M. Hernández-Córdoba, Spectrochim. Acta, Part B, 2014, 101, 93–97 CrossRef.
- K. Leopold, A. Philippe, K. Wörle and G. E. Schaumann, Trends Anal. Chem., 2016 DOI:10.1016/j.trac.2016.03.026 , in press.
| This journal is © The Royal Society of Chemistry 2016 |

