DOI:
10.1039/C6IB00125D
(Paper)
Integr. Biol., 2016,
8, 1099-1110
Modulation of collective cell behaviour by geometrical constraints†
Received
5th July 2016
, Accepted 28th September 2016
First published on 3rd October 2016
Abstract
Intracellular and extracellular mechanical forces play a crucial role during tissue growth, modulating nuclear shape and function and resulting in complex collective cell behaviour. However, the mechanistic understanding of how the orientation, shape, symmetry and homogeneity of cells are affected by environmental geometry is still lacking. Here we investigate cooperative cell behaviour and patterns under geometric constraints created by topographically patterned substrates. We show how cells cooperatively adopt their geometry, shape, positioning of the nucleus and subsequent proliferation activity. Our findings indicate that geometric constraints induce significant squeezing of cells and nuclei, cytoskeleton reorganization, drastic condensation of chromatin resulting in a change in the cell proliferation rate and the anisotropic growth of cultures. Altogether, this work not only demonstrates complex non-trivial collective cellular responses to geometrical constraints but also provides a tentative explanation of the observed cell culture patterns grown on different topographically patterned substrates. These findings provide important fundamental knowledge, which could serve as a basis for better controlled tissue growth and cell-engineering applications.
Insight, innovation, integration
During tissue development and growth, cell colonies may exhibit a wide variety of exquisite spatial and temporal patterns. Such patterns are the outcome of coordinated cell growth, movement, and cell–cell communications. We demonstrated that geometrical confinement caused by topographically patterned substrates modulates cell and nuclear morphology and collective cellular behavior. Our findings indicate that geometric constraints induce significant squeezing of cells and nuclei, cytoskeleton reorganization, drastic condensation of chromatin resulting in a change in the cell proliferation rate and the anisotropic growth of cultures.
|
1. Introduction
During tissue growth, cell colonies (populations) may exhibit a wide variety of exquisite spatial and temporal patterns. Being the outcome of coordinated cell growth, movement, and cell–cell communications that involve the detection and processing of extracellular forces and cues, these patterns often play vital roles in organ growth and development.1 However, the origin and mechanism of the pattern formation remain unclear. The structured microenvironments that surround cells within organs and tissues possess particular shape constraints. Such constraints provide the basis for regulation of the cellular function.2–5 For instance, cellular geometry has been shown to be a key determinant of a variety of fundamentally important cellular processes, such as nuclear deformation, cytoskeleton reorganization, chromatin compaction, gene expression, growth, apoptosis, and cell division.6–11 Moreover, a recent study showed that cells migrate as a collectively advancing front through micropillar arrays, revealing the importance of geometry in the fundamental process of cell migration.12 It is worth noting here that other biophysical cues such as substrate stretching, fluid flow, substrate rigidity, and cellular morphology have also been shown to affect gene expression, cellular and nuclear architecture.13–15
The question of how physical forces and the geometry of the cell microenvironment regulate cooperative cellular function remains open. However, numerous lines of research have begun to reveal that the geometry of the cell microenvironment is a critical parameter for regulating cell fate.11,16,17 The tentative explanation of how cell shape data are transduced into gene expression has been proposed in ref. 18. It has been shown that the cytoskeleton applies forces to modulate nuclear shape and size in response to cell shape changes.18 Moreover, recent studies imply that alterations in the cell shape influence the pattern of mesenchymal stem cell differentiation.10,11 It should be noted that one of the most fundamental questions in tissue morphogenesis, related to how changes in the cell shape produce alterations of nuclear form and functions, has been usually addressed by manipulation of the cell shape through control of the cell spread area and confinement to a particular geometry, i.e. through cell micropatterning techniques.3,6,19,20 Recently, a burst of studies utilizing cell micro- and nanopatterning techniques revealed that the manipulation of cell geometry, such as confinement to circular or square patterns independently of the cell spread area, affects many crucial cellular processes.6,10,11,21 The implication of these studies is that in order to exploit the full potential of cells for tissue engineering and regeneration, their function needs to be tightly controlled and the cell fate is not entirely controlled by genetic signals, but instead is largely regulated by external geometrical and physical cues. However, the major limitation of such techniques is that cell micropatterning works at the single cell level and does not take into account collective behavior. Indeed, cellular migration and morphogenesis of biological tissues display collective cell behavior as a fundamental phenomenon.22,23 Collective cell behavior launches many crucial biological processes such as embryonic development,24 tissue morphogenesis,25 wound healing26 and tumor metastasis.26 To study cooperative cell behavior and pattern formation under external lateral forces, we used periodical arrays of pillars with the spatial period of the same order of magnitude as the mean size of the cell colony, which typically varies from tens to hundreds of micrometers.27,28 While cell sensing of physical properties at the nanoscale and microscale patterned surfaces have been extensively studied in many works (for review, see ref. 29 and 30), the response of the cell colony to the patterning range of tens to hundreds of micrometers in scale is still unexplored. Namely, on this scale the geometrical constraints can mainly affect cell colonies through cell-to-cell sensing. Addressing such fundamental questions would provide a novel basis for tissue engineering that has become highly important in medical research and has even entered clinical trials.31 Several research laboratories have shown that cell suspension can assemble an organized complex structure – organoid which was utilized to produce multiple diverse tissues such as liver, kidney, intestine and others.32 Given that the organoids are usually much smaller than the actual organ size, just a few millimetres across, and have been grown spontaneously in cellular suspension, we investigated the effect of the geometric constraint on HepG2 cells’ proliferation activity and cellular topology which characterizes the connectivity among cells forming a tissue.
2. Methods
2.1. Topographic patterning of silicon substrates with different micropillar geometries
To produce uniform substrates for biological applications, we utilized deep reactive ion etching to pattern Si wafers so as to produce sets of substrates with surfaces consisting of arrays of silicon micropillars of different geometry and with different values of inter-pillar spacing. The patterned silicon substrates were coated with a parylene, which is a biocompatible, inert and very low permeability material.
As a control we used standard glass bottom 35 mm culture dishes (In Vitro Scientific, Sunnyvale, California, USA) as well as non-patterned (flat) parylene coated thermally oxidised silicon substrates.
Prior to cell seeding, all experimental surfaces were sterilized by treatment with 70% ethanol for 20 min followed by ultraviolet (UV) exposure for one hour. All experiments were designed to change only the geometric confinement of the cells. All other conditions including the nutrient or coating properties were maintained at constant levels. To ensure that roughness does not affect the experimental results, we measured the roughness of all topographically patterned samples and Si control wafers (all covered with parylene) using the Alpha-Step 500 surface profiler. All samples, including the control, had a comparable RRMS of about 250–300 nm.
2.2. Cell culture
The HepG2 cell line (American Type Culture Collection, HB-8065) was grown in formulated Eagle's Minimum Essential Medium (American Type Culture Collection) with 10% fetal bovine serum (FBS; PAA Laboratories) and 0.1% (v/v) penicillin/streptomycin (Sigma, St. Louis, MO). The cells were cultured in a humidified 5% CO2 atmosphere at 37 °C.
For all cell experiments in this study, the cells were seeded on sterilized substrates at an initial density of 25![[thin space (1/6-em)]](https://www.rsc.org/images/entities/char_2009.gif) 000 cells per cm2 and were maintained under standard cell culture conditions (37 °C, 5% CO2). Cells were allowed to grow within the geometrically constrained patterns of different topography for 2, 24, 48 and 72 hours.
000 cells per cm2 and were maintained under standard cell culture conditions (37 °C, 5% CO2). Cells were allowed to grow within the geometrically constrained patterns of different topography for 2, 24, 48 and 72 hours.
2.3. Cell proliferation assay
Cells were seeded onto different patterned surfaces and incubated over 2, 24, 48 and 72-hour periods under standard cell culture conditions (37 °C, 5% CO2). Nuclei were stained using DAPI mounting medium from Vector Laboratories (Burlingame, CA, USA). The DAPI stained nuclei of the cells were visualized with a Nikon microscope (upright motorized microscope, Ni-E). Quantification of the cells was done using ImageJ software (NIH, Bethesda, USA). Cell counting was carried out for 5 fields of view per sample. Three samples per surface were set aside for cell proliferation measurements, and the reported values are the mean ± SD (Standard Deviation).
2.4. Immunocytochemistry
Cells were grown for 72 hours in complete growth medium upon differently patterned surfaces and maintained at 37 °C in a humidified atmosphere with 5% CO2. After incubation, the cells were fixed with 3.7% paraformaldehyde for 15 minutes, washed in phosphate buffered saline, permeabilized with 0.1% Triton X-100 for 5 minutes and then blocked with 3% BSA (bovine serum albumin) for 30 minutes and incubated with Alexa-Fluor 568 Phalloidin (1:300) (Invitrogen, Paisley, UK). Nuclei were counterstained with DAPI. Images were digitally recorded using either a Zeiss LSM 510 confocal system (Carl Zeiss Ag) or a Nikon microscope (upright motorized microscope, Ni-E). ImageJ software was used for image processing and fluorescent micrograph quantification.
2.5. Cell and nuclear shape analysis
To quantify the variation in nuclear shape, we utilized the contour of individual stained nuclei with a 3D Objects Counter plugin in ImageJ software that automatically segmented the images of fluorescent nuclei and traced the best-fit outline ellipse to determine the long (a) and short (b) axes, perimeter length and projected area of each nucleus. To quantify the nuclear orientation, the orientation of the best-fit ellipse was calculated with respect to the vertical axis. For the cell shape index (CSI) and nuclear shape index (NSI) calculations, we used the approach described in ref. 6. Briefly, in order to calculate the CSI, we used the following relationship: CSI = 4π × area/(perimeter)2. A similar relationship was used to calculate the NSI from the projected nuclear area and the nuclear perimeter length.
2.6. Cell area analysis
Cell areas were calculated using ImageJ software by outlining the perimeter of the cell as visualized through F-actin staining. A detailed description is given in ref. 33.
2.7. F-actin organization analysis
Staining for cytoskeletal F-actin allowed for the investigation of fibre alignment and density distribution. The fluorescence distribution and intensity of F-actin was presented in a pseudo-colour scale using a previously published approach.34
2.8. Apparent chromatin condensation
The spatial chromatin organization was analysed using the method published in ref. 6. To visualize chromatin, we used DAPI staining (a fluorescent dye that selectively binds to the double-stranded DNA). After labelling, the cells were imaged with a Zeiss LSM 510 confocal system (Carl Zeiss Ag). Stacks of nuclear images at different focal positions along the z axis (0.2 μm intervals) were acquired using confocal scanning microscopy. In order to obtain quantitative information, standard image processing was applied to each image; shading correction, dark image subtraction and deconvolution with the DeconvolutionLab ImageJ plugin was used to sharpen the images. Afterwards, the integrated fluorescence intensity was calculated as the sum of the intensity of each pixel. Indeed, the average spatial density, defined as the ratio of the total fluorescence intensity to the nuclear volume, was shown to correlate with the average chromatin packing ratio,35 and is indicative of chromatin condensation.
2.9. Description of f-parameter
The vertical planes of pillars assert lateral mechanical forces on neighbouring cells. These forces are transmitted through cell–cell contacts across distances between neighbouring pillars. For such topographically patterned surfaces, an appropriate parameter which characterizes the lateral mechanical forces is given by:| |  | (1) |
where Lb is the total length of the border per area S, and S is the area of the unit cell of the pattern. The topographically patterned samples we study have a different symmetry: 1D-striped structures of 2-fold rotational symmetry and translational symmetry, 2D-arrays of square pillars of 4-fold rotational symmetry and translational symmetry, and 2D-arrays of circular pillars of 4-fold rotational symmetry and translational symmetry. Below we list the f-parameters calculated for each structure.
For a 1D-striped structure:
| |  | (2) |
where
L is the pillar width and
D is the spacing between two neighbouring pillars (from edge to edge).
For a 2D-array of square pillars:
| |  | (3) |
For a 2D-array of circular pillars:
| |  | (4) |
where
L is the pillar diameter. It is worth noting that all the above listed parameters are given in units of m
−1 (in the SI). However, in the case where all the pillars have the same width (or the same spacing) one can multiply
eqn (2)–(4) by a factor
L (or
D) to make them dimensionless. Note that in our experiments, the control group of cells was grown on a flat surface for which the
f-parameter is zero,
i.e. fcontr = 0. (As follows from
eqn (2)–(4), for the studied substrates the
f-parameter values satisfy the inequality 0 =
fcontr <
fcir <
fsq ≤
fstr for all pillar spacings). The increasing value corresponds to the gradual decrease of the degree of symmetry of the surface, from isotropic (highest degree of symmetry,
fcontr = 0), to circular, square and then striped (lowest degree of symmetry). In the limiting case, where
D → ∞, according to
eqn (2)–(4) all
f-parameters go to zero, meaning that there are no borders.
The normalized f-parameter.
For all the structures studied in our experiments, L is a constant. In this case, one can multiply eqn (2)–(4) by the factor L. So, one can get the following normalized parameters:| | 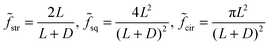 | (5) |
From eqn (5) we calculated the values of the normalized f-parameter for L = 50 μm and D = 50, 250 and 500 μm (see Table 1).
Table 1 Normalized f-parameter calculated from eqn (5) for the different topographic structures with L = 50 μm
| Substrate microtopography |
D → ∞ (no constraint) |
D = 500 μm |
D = 250 μm |
D = 50 μm (max constraint) |
| Stripes |
0 |
0.182 |
0.333 |
1 |
| Circles |
0 |
0.026 |
0.087 |
0.785 |
| Squares |
0 |
0.033 |
0.111 |
1 |
| Control (isotropic) |
0 |
0 |
0 |
0 |
2.10. Statistical analysis
Quantitative results are expressed as mean ± SD (Standard Deviation). Results were analyzed by multi-group comparison of Fisher's LSD and Newman–Keuls tests. Differences were considered statistically significant at *p < 0.05.
3. Results and discussion
3.1. Characterization of substrates with different micropillar geometry
Deep reactive ion etching was used to pattern Si wafers so as to produce sets of substrates with surfaces consisting of arrays of silicon micropillars of different geometry and with different values of inter-pillar spacing. Fig. 1a shows the optical images of a representative patterned surface observed using light microscopy. The average diameter of the pillars, determined using quantitative image analysis (ImageJ), was 50 μm. The height of the pillars was about 100 μm. To evaluate the directional dependency of collective cell growth and behavior constrained by geometry, surfaces consisting of micropillars of different geometry (circles, squares and stripes) with different values of spacing D (50, 250 and 500 μm) were fabricated (Fig. 1b). The detailed geometrical parameters of the substrates are shown in Fig. 1. Finally, in order to make silicon surfaces suitable for cell culturing, we coated them with a polymer. We used parylene as the coating material due to its biocompatibility, inertness, and very low permeability.36 Moreover, parylene bears the highest biocompatibility certification class, making it an excellent coating compound for cell culturing.37,38 The experimental methods are detailed in the Experimental section.
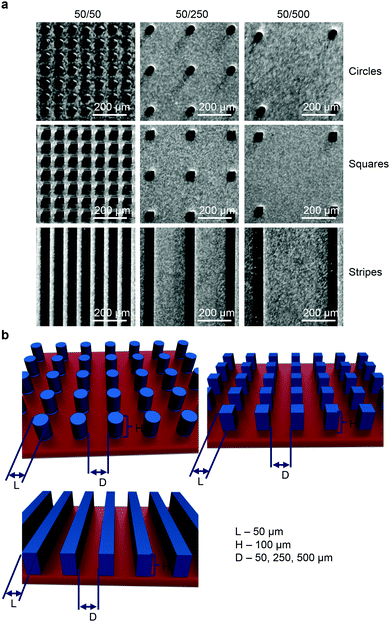 |
| | Fig. 1 Substrates with patterned surfaces for cell culturing. (a) Light microscopy micrographs of different Si substrates. (b) Schematic diagram of Si substrates with different geometries having different values of pillar spacing. | |
3.2. Substrates with different micropillar geometry and spacing affect cell proliferation
We first studied how geometrical constraints influence the overall growth rate of cells. Our research was focused on a specific cell type – hepatocytes. These cells are polarized, specialized, and species-specific, making them uniquely susceptible to infections.39 Thus, understanding their morphological changes in response to their microenvironment would be greatly beneficial for understanding liver metabolism and toxicity.39 Therefore, we utilized HepG2 cells for the studies. HepG2 is the most widely used in vitro model system for the study of polarized human hepatocytes40 due to the fact that they display robust morphological and functional differentiation with a controllable formation of apical and basolateral cell surface domains.41
HepG2 cells were cultured on silicon substrates with different values of pillar spacing and geometry (Fig. 1). Firstly, we assessed the cell growth kinetics over 3 days of culturing (Fig. 2a). As a control, we used normal culture dishes as well as non-patterned (flat) silicon substrates. We observed a linear progression in the number of cells with time, independent of the substrate topography and pillar geometry (Fig. 2a and Fig. S1–S4, ESI†). Indeed, there was no significant difference in growth kinetics (Fig. 2a) or doubling time (Table S1, ESI†), compared with cells seeded on a control culture dish or a non-patterned silicon substrate. The doubling time for cells seeded on control culture dishes as well as non-patterned silicon substrates was in the range of the typical doubling time of HepG2 cells – about 48 h.42 Moreover, the growth kinetics (Fig. 2a) and doubling time (Table S1, ESI†) for cells seeded on substrates with circular and square pillars having 250 and 500 μm spacing as well as stripes with 250 μm spacing were not significantly different from control ones. However, the cells seeded on substrates with circular, square and striped pillars having 50 μm spacing showed enhanced growth kinetics (Fig. 2a) and subsequently lower values of the doubling time (Table S1, ESI†). Cells grown only on striped pillars with a 500 μm spacing showed a significantly lower growth rate (Fig. 2a) and, correspondingly, increased values of doubling time (Table S1, ESI†). Furthermore, at day 2 and even more so at day 3 of growth, the cells grown on square and striped pillars having 50 μm spacing showed significant changes in cell patterning (Fig. S3–S5 second column, ESI†). Generally, in contrast to cellular geometry, which describes cell shape, cellular topology characterizes the connectivity among cells in a tissue.43 Thus, these results imply that variations in the substrate geometry and substrate constraint leads to intensive proliferation and changes in cellular topology.
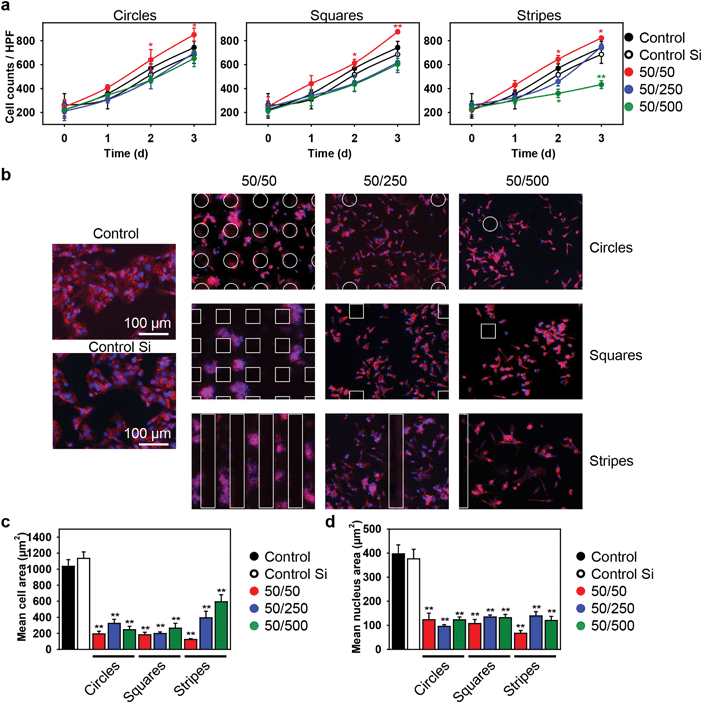 |
| | Fig. 2 Substrate topography affects cell proliferation. (a) Growth kinetics of HepG2 cells seeded on Si substrates with different geometries having different values of pillar spacing. Data are presented as mean ± SD, n = 4. (b) Representative fluorescent images of cells grown for 3 days on different Si substrates. After growing for 3 days, the cells were fixed and stained for F-actin filaments (red dye). Nuclei were counterstained with DAPI (blue dye). Labeled cells were imaged using fluorescence microscopy. Mean cell (c) and nucleus (d) area. ImageJ (NIH) software was used for image processing and fluorescent micrograph quantification. Data are presented as mean ± SD, n = 15, **p < 0.01. | |
3.3. Topography of the substrate affects orientation of the nucleus
We then investigated whether geometrical constraints driven by substrate topography would have an impact on cell nucleus orientation. Of note, it has been previously shown that the nucleus, centrosome and Golgi apparatus orient in response to external physical cues.6,8,19 First of all, we noticed that at day 3 of growth, cells grown on square and striped pillars having 50 μm spacing showed significant changes in nuclear orientation (Fig. S5, ESI†). On the contrary, other substrate topography had no significant influence on nuclear orientation in comparison with control substrates (Fig. S5, ESI†). Furthermore, control substrates and substrates with striped and square pillars having 250 and 500 μm spacing as well as circular pillars with 50, 250 and 500 μm spacing showed a random distribution of nuclear orientation spanning 180° (Fig. 3). However, square and striped pillars having 50 μm spacing showed preferential vertical or horizontal orientation of the nucleus, regardless of the substrate topography (Fig. 3). Taken together, these results indicate that the nucleus, initially randomly oriented, becomes anisotropically oriented when the cells are constrained by substrate topography. Importantly, the orientation of the nucleus correlates with the corresponding symmetry of the substrate topography.
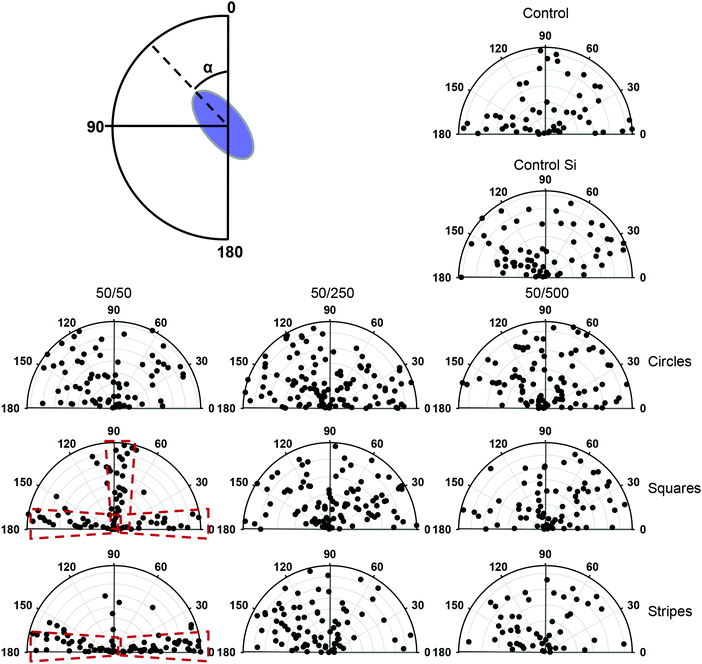 |
| | Fig. 3 Substrate topography induces orientation of the cell nucleus. Angular graphs show the different orientations experienced by nuclei in response to cell shape changes for various substrate topographies. After growing for 3 days, the cells were fixed and stained for nuclei with DAPI (blue dye). Labeled cells were imaged using confocal microscopy. ImageJ (NIH) software was used for image processing and fluorescent micrograph quantification. | |
3.4. Cell size and shape changes in response to the substrate topography
Taking into account that cell size participates in the regulation of crucial and fundamental cellular processes, such as cell growth, differentiation, shape changes and cell death,44 we studied the influence of geometrical constraints driven by substrate topography on the size of HepG2 cells. Cells grown on all types of substrates were significantly smaller in size than those grown on control culture dishes or on non-patterned silicon substrates (Fig. 2b and c and Fig. S6, ESI†). Furthermore, the size of the nucleus was significantly smaller in cells grown on all types of substrates, compared to the control dishes (Fig. 2d). A framework for mechanistic coordination between the cell and nuclear size has been proposed.6 It is known that cell cycle times (that determine the cell growth rate and doubling time) within clones tend to oscillate from one generation to the next.45 Moreover, cells having shorter than average cycles tend to be smaller than average.45 This is in line with our observation that cells grown on substrates with circular, square and striped pillars having 50 μm spacing showed an enhanced growth rate (Fig. 2a) and a concomitantly smaller size (Fig. 2c) compared with the control ones.
It is generally assumed that F-actin network remodeling (e.g. length, cross-link density, etc.) strongly modulates the cell shape and size.44,46–48 Thus, we further studied the effect of geometrical constraints on F-actin remodeling. Indeed, an interesting feature of the observed cytoskeleton remodeling is the change in density of the F-actin filaments, which corresponds to a change in cytoskeletal tension. In Fig. 4a the F-actin filament density gradually grows as the color changes from blue to red. Cells grown on substrates with circular, square and striped pillars having a 50 μm spacing showed a dramatic increase in the F-actin filament density driven by network remodeling (Fig. 4a). Moreover, the total length of the F-actin filament decreased dramatically in individual cells grown on all types of substrates compared to control dishes (Fig. 4b).
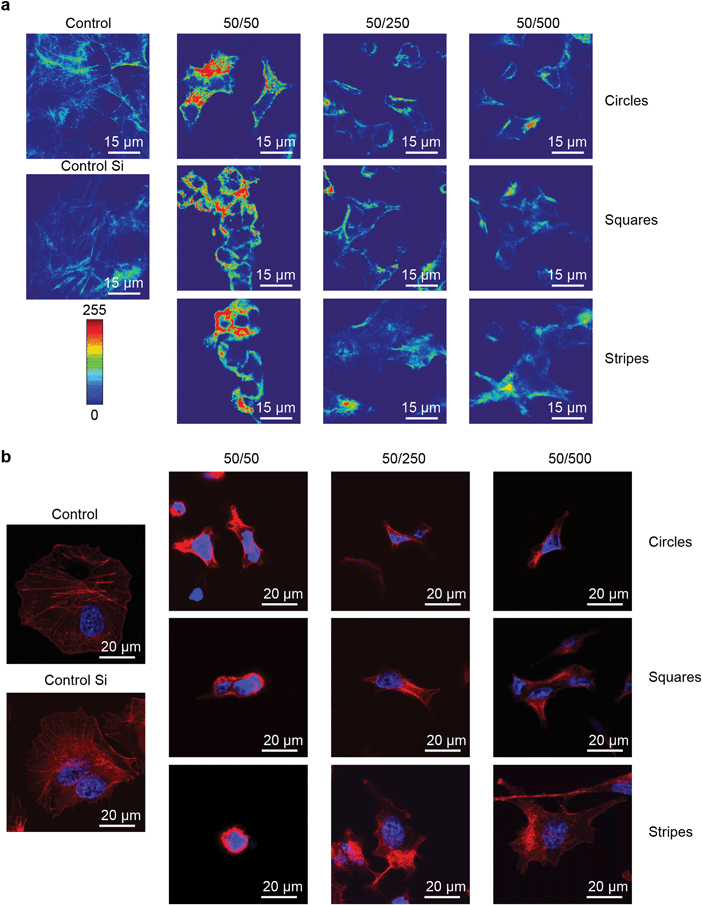 |
| | Fig. 4 Controlling cell size using patterned substrates with different geometries. (a) Confocal fluorescence analysis of the cytoskeletal organization of the cells grown for 3 days on Si substrates with different geometries having different values of pillar spacing. The fluorescence distribution and intensity of F-actin are shown in the reported pseudo-color scale. (b) Cell morphology after 3 days growth on Si substrates with different geometries. After growing for 3 days, the cells were fixed and stained for F-actin filaments (red dye). Nuclei were counterstained with DAPI (blue dye). Labeled cells were imaged with confocal microscopy. | |
To investigate how large-scale changes of geometrical constraints could influence the cell and nuclear morphology of individual cells, we then assessed the cell shape index (CSI) and nuclear shape index (NSI) as described in ref. 6 (for definitions see the Experimental section). Growth on all types of substrates resulted in significant cell and nucleus shape remodeling (Fig. 4b and Fig. S7, ESI†). Furthermore, we observed via laser-scanning confocal microscopy the spatial distribution of actin filaments in cells, according to the nuclear position in the cell. In response to geometrical constraints driven by substrate topography, F-actin formed bundles resulting in the appearance of structures localized exclusively in the peripheral zone (Fig. 4b). It is noteworthy that this F-actin reorganization was more significant on substrates with square and striped pillars having 50 μm spacing (Fig. 4b), with the subsequent formation of ‘ring-like’ F-actin structures around the nuclei. Together, these results show that stress fiber distribution alters in response to cell shape changes driven by geometrical constraints.
3.5. Chromatin condensation affected by substrate topography
Having shown that substrate topography affects cell size and shape, we then studied its influence on chromatin organization, using DAPI staining.6,49 It is known that the level of DAPI uptake strongly depends on the total amount of DNA and its level of condensation.50 Therefore, the average spatial density corresponding to the ratio between the integrated fluorescence intensity and the volume of the nucleus is a very effective and reliable indicator of the average chromatin condensation.6,50 A reorganization of chromatin distribution was found to be associated with an increase of geometrical constraints generated by decreasing pillar spacing on all types of substrates studied (Fig. 5a). Furthermore, it was found that the higher the level of chromatin condensation, the higher the fluorescence intensity. Moreover, intense chromatin condensation was associated with nuclear deformation (Fig. 5a and Fig. S7b, ESI†). These results are in agreement with previous reports.6,10 Not surprisingly, we found that cell and subsequent nuclear shape remodeling driven by substrate topography resulted in a decrease of the nuclear area and volume (Fig. 5b). This is in agreement with previously published results obtained for endothelial cells.6 The changes in chromatin density that accompany the overall nuclear remodeling depend non-monotonically on nuclear shape and size (Fig. 5c). This suggests a complex relation between remodeling of the nuclear architecture and cell/nuclear morphology in response to geometrical constraints driven by substrate topography.
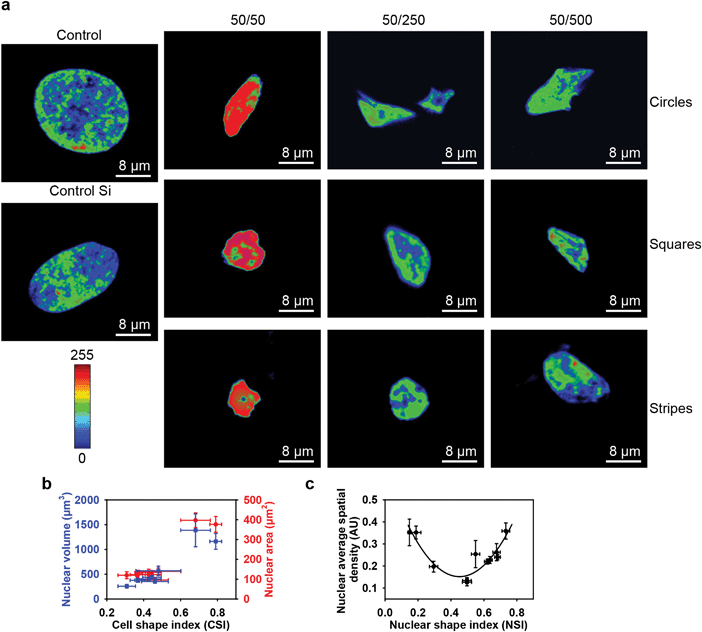 |
| | Fig. 5 Geometric constraint leads to chromatin condensation. (a) Successive changes of the level of chromatin condensation as a result of cell growth on Si substrates with different geometries having different values of pillar spacing. Intensities of DNA staining were digitized in 256 bits and colour coded. Highly condensed domains show higher fluorescence intensity with respect to the less condensed ones. (b) Nuclear deformations in response to cell shape changes. The nucleus was fitted with an ellipsoidal morphology to calculate the evolution of the nuclear volume (in blue) and the nuclear area (in red) versus CSI. ImageJ (NIH) software was used for image processing and fluorescent micrograph quantification. Data are presented as mean ± SD, n = 15. (c) Levels of chromatin condensation in response to nuclear deformations (NSI). ImageJ (NIH) software was used for image processing and fluorescent micrograph quantification. Data are presented as mean ± SD, n = 15. | |
3.6. How geometry affects the shapes of cells and nuclei and cell proliferation
Summarizing our results, we arrive at the following conclusions. Cells grown on all types of substrates showed significantly smaller nucleus and cell body sizes compared with the controls (Fig. 2b–d and 4b). Moreover, the shape of the cell and nucleus is deformed significantly when grown on all types of substrates (Fig. 4b). It should be noted that these results are in agreement with previously published studies showing that cell geometry influences nuclear morphology.6,10 However, cells seeded on substrates with circular or square pillars having 250 and 500 μm spacing, as well as striped pillars with 250 μm spacing, show growth kinetics not significantly different from the control samples (Fig. 2a). Cells seeded on substrates with circular, square and striped pillars having 50 μm spacing showed enhanced growth kinetics (Fig. 2a). Surprisingly, cells grown on striped pillars with 500 μm spacing showed decreased growth kinetics (Fig. 2a). Even more strikingly, upon enhancing geometrical constraints by decreasing the pillar spacing, the cells tended to become more roundish (Fig. 4b) rather than elongated, as reported for the micropatterning technique.3,6,10 Furthermore, cells on square and striped pillars having 50 μm spacing tended to cluster (Fig. 2b and Fig. S4, S5, ESI†). These observations prompted us to search for an appropriate geometrical parameter to describe the observed phenomena, which takes into account both the topography of the patterned surface and any anisotropy of constraint. Upon growth, spreading and migration during culturing, cells are in contact with the pillars' borders, and they are constrained by these geometrical hurdles. Therefore, even for the closely related square and circular geometries, the direction of such constraint will differ. We propose the f-parameter, defined as the total length of the border of a pattern divided by the area of the unit cell of the pattern (see eqn (1) in the Experimental section) as a descriptor of topographically patterned substrates. The f-parameter is proportional to the total lateral force acting on a cell culture from the vertical edges of the pillars. In our experiment, cells adhered to both the horizontal and vertical planes of the topographically patterned substrates, with the vertical edges exerting lateral mechanical forces on the cells during culture. Values of the normalized f-parameter calculated from eqn (5) (see below) for all types of substrates are shown in Table 1. Samples with different types of pillar geometry but fixed spacing have different values of f-parameter (Table 1). Moreover, since cells come into contact with pillars when they propagate on the substrate, the f-parameter correlates with the mechanical force exerted by the pillars on the cells. Thus the f-parameter encompasses both the mechanical and geometrical constraints of the patterned surface. An increase of geometrical constraint, mechanical force and anisotropy leads to an increase of the f-parameter. Moreover, a monotonic increase of the f-parameter from zero to unity corresponds to a gradual decrease of the degree of symmetry of the substrate surface, from the isotropic control substrate with the highest degree of symmetry (fcontr = 0 which corresponds to no constrain) to circular/square pillars and then to stripes that have the lowest degree of symmetry. Therefore, we plotted the ratio of nucleus volume to cell volume as a function of f-parameter (Fig. 6a). This ratio as a function of f-parameter showed a substantially different behavior for all geometries (Fig. 6a). In summary, cells show complex non-monotonic dependence of growth rate and concomitant cell size and shape changes in response to geometrical constraints caused by substrate topography (Fig. 6b). It should be stressed that in spite of the monotonic increase of the f-parameter (or increase of the lateral forces which constrain the cells) the key cell functionality parameters, namely the nucleus to cell volume ratio (Fig. 6a) and cell growth rate (Fig. 6b), change non-monotonically. In fact, cell growth on substrates having low values of f-parameter (namely substrates with circular and square pillars having 250 and 500 μm spacing) results in dramatic changes in the size and morphology of the cell and nucleus (Fig. 2c, d and 5b) without significantly impacting on proliferation (Fig. 2a and Table S1, ESI†). Furthermore, cells on substrates with medium values of f-parameter (namely substrates with striped pillars having 500 μm spacing) grow relatively slowly (Fig. 2a and Table S1, ESI†). In other words, when a ‘low’ constraint is applied to a cell culture (Fig. 6b), using substrates characterized by low values of f-parameter (Table 1), the cells respond by adopting their size, and then their proliferation rate is slowed down (Fig. 6b). Such observations are in agreement with previous studies that showed that cell compression resulting from geometric constraint leads to cell cycle arrest and therefore decreased growth rate.6,51–53 However, application of a ‘high’ constraint results in a change in morphology and nuclear organization of the cells and subsequently increased growth kinetics (Fig. 4b, 5a and 6b). Moreover, ‘high’ constraint promotes changes even in cell networking (Fig. S4, ESI†) suggesting a substantial effect on collective cell behavior. Such constraint results in dramatic changes in the cellular and nuclear morphology in 3D (Fig. 6c). Lateral force magnitudes acting on cells from the pillar walls can be estimated as follows. As it was observed, under the strongest geometrical constraints, the cells changed their shape from quasi 2D-plates to an oblate spheroid (Fig. 6d). For a cell in the shape of an oblate spheroid, hydrostatic pressure at the base of a pillar's wall is P = ρgh, where ρ = 103 kg m−3 is cell mass density, g = 9.8 m s−2 is the acceleration of free fall, and h is the cell height, which is approximately 10 μm. By inserting these quantities into the last formula one can estimate the pressure as P = 0.1 Pa. Thus, the maximal lateral force exerted on a pillar wall is F = P·S, where S is the mean lateral correctional area of an oblate spheroidal cell. The same force will act on cells at the walls. Assuming S = 10 × 10 μm2, i.e. S = 10−10 m2, we estimate the lateral force value as F = 0.1 Pa × 10−10 m2 = 10 pN. This value is just a force which can affect cytoskeleton remodeling34 and cell membrane deformation.38,54 Thus, the pillars exert on neighboring cells a lateral force as small as tens of pN. This force is transmitted without changes through cell–cell contacts across distances between neighboring pillars, thereby causing the observed cell shape changes and related growth rate.
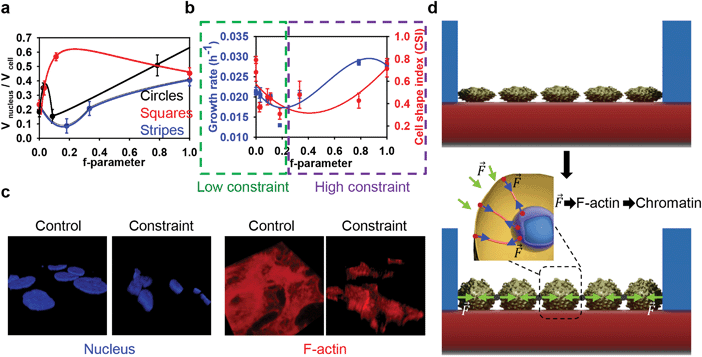 |
| | Fig. 6 Geometrical constraints induced by substrate topography. (a) Substrate topography driven changes in the nuclear–cytoplasmic ratio as a function of f-parameter. Data are presented as mean ± SD, n = 15. (b) Substrate topography affects the cell proliferation. Cell relative deformation – CSI (in red) and growth rate (in blue) presented as a function of f-parameter. Data are presented as mean ± SD, n = 15. (c) Representative 3D images of cells grown for 3 days under constraint or non-constraint (control) conditions. After growing for 3 days, cells were fixed and stained for F-actin filaments (red dye). Nuclei were counterstained with DAPI (blue dye). (d) Scheme of the geometrical orchestration between substrate topography and cell networking. | |
Since a number of cells are in contact with the pillars' borders, they are directly constrained by these geometrical hurdles and the corresponding forces. These forces are transmitted through cell–cell contacts across distances between neighbouring pillars (Fig. 6d). In terms of the single cell level this force is spread by cell membrane and F-actin to the nucleus (Fig. 6d). Our results show some key differences with previous studies on geometric constraints that used micropatterning techniques. Studies of single cells on micropatterned surfaces do not give insight into collective cell behavior. More specifically, it has been shown that cell shape changes driven by micropatterns result in a drastic condensation of chromatin and lead to slow cell proliferation.6 The important point is that such a technique utilizes adhesive islands to create a spatial environmental constraint that shapes isolated single cells.3,6 However, in cell cultures, the chromatin of quiescent cells generally has a decondensed conformation.55,56 Moreover, the functioning of multicellular structures (tissues, organs) cannot be explained based on studies of single cell behavior.23,57,58 Here we presented an approach to study collective cell behavior in response to geometrical confinement. Furthermore, our results imply that not only the ‘value’ of geometric constraint but also the anisotropy of constraint plays a role in cell shaping and proliferation (Fig. 6). In contrast to our cell growth confinement, cell culturing under conditions of magnetic levitation (weightless conditions) leads to the formation of disordered HepG2 colonies.59 Moreover, it has been shown that the anisotropy of the cell environment strongly affects the polarization of cells.19 It is worth noting that several studies have shown that the diffusion of molecules could be strongly affected on a patterned surface.60,61 The diffusion of signaling molecules released by cells could be obscured, thus resulting in functional alterations. Because cell geometry changes induced by micropatterning have been shown to alter gene expression10,19 and affect cell differentiation,11,62 further studies are required to analyse the role of genes in geometrically constrained cell cultures.
4. Conclusions
We have demonstrated that geometrical constraints and anisotropy of the cell environment influence cell and nuclear morphology and collective cell growth. These collective cellular responses to geometrical constraints show a complex non-monotonic dependence of the cell growth rate on the here defined f-parameter that characterizes topographically patterned substrates. For ‘low’ constraints (f < 0.2) the growth rate decreases as the f-parameter grows, while for ‘high’ constraints (0.2 < f ≤ 1) the growth rate monotonically increases (Fig. 6b). Moreover, a tight coupling between cell geometry, nuclear morphology and cell growth was observed. Indeed, nucleus-cell volume ratios exhibit a peculiarity near f = 0.2 for all types of constraints (Fig. 6a). Furthermore, all studied topographic constraints caused squeezing of cell and nuclear areas, by a factor of 5 and 3.5, respectively (Fig. 2c and d). This squeezing was accompanied by drastic cytoskeleton reorganization (Fig. 4a) and chromatin condensation (Fig. 5a). Therefore, a mechanistic regulation of cell and nucleus volumes, morphologies, growth rate, chromatin density and its distribution, by applying lateral confinement forces via topographic patterning of substrates provides valuable prospects for controlled cell growth and tissue engineering. Individual cell remodeling results in a large-scale colony reorganization to fit the lateral forces caused by external constraints. The revealed cooperative adaptation of cells to the patterned structures extends the previous researches mainly focused on single cell responses, but the understanding of the specific intracellular signaling mechanisms driving this collective behavior requires further studies. These findings provide an important fundamental knowledge, which could serve as a basis for a better controlled design of liver organoid generation.
Acknowledgements
The authors acknowledge the J. E. Purkyne fellowship awarded by the Academy of Sciences of the Czech Republic, MEYS of the CR under the NPU I: LO1309 and MH CZ – DRO Institute for Clinical and Experimental Medicine – IKEM, IN 00023001. The authors would like to thank Dominique Givord for fruitful discussions. Substrate patterning by Deep RIE was carried out at the PTA-Grenoble cleanroom facility while parylene coating was performed by Emmanuel Andre at Institut Néel.
References
- S. Kondo and T. Miura, Science, 2010, 329, 1616–1620 CrossRef CAS PubMed.
- W. F. Marshall, Cell, 2013, 154, 265–266 CrossRef CAS PubMed.
- M. Thery, J. Cell Sci., 2010, 123, 4201–4213 CrossRef CAS PubMed.
- G. Charras and E. Sahai, Nat. Rev. Mol. Cell Biol., 2014, 15, 813–824 CrossRef CAS PubMed.
- J. B. Moseley and P. Nurse, Cell, 2010, 142, 189–193 CrossRef CAS PubMed.
- M. Versaevel, T. Grevesse and S. Gabriele, Nat. Commun., 2012, 3, 671 CrossRef PubMed.
- M. Thery, A. Pepin, E. Dressaire, Y. Chen and M. Bornens, Cell Motil. Cytoskeleton, 2006, 63, 341–355 CrossRef CAS PubMed.
- N. Minc, D. Burgess and F. Chang, Cell, 2011, 144, 414–426 CrossRef CAS PubMed.
- C. S. Chen, M. Mrksich, S. Huang, G. M. Whitesides and D. E. Ingber, Science, 1997, 276, 1425–1428 CrossRef CAS PubMed.
- N. Jain, K. V. Iyer, A. Kumar and G. V. Shivashankar, Proc. Natl. Acad. Sci. U. S. A., 2013, 110, 11349–11354 CrossRef CAS PubMed.
- K. A. Kilian, B. Bugarija, B. T. Lahn and M. Mrksich, Proc. Natl. Acad. Sci. U. S. A., 2010, 107, 4872–4877 CrossRef CAS PubMed.
- I. Y. Wong, S. Javaid, E. A. Wong, S. Perk, D. A. Haber, M. Toner and D. Irimia, Nat. Mater., 2014, 13, 1063–1071 CrossRef CAS PubMed.
- Y. Li, J. S. Chu, K. Kurpinski, X. Li, D. M. Bautista, L. Yang, K. L. P. Sung and S. Li, Biophys. J., 2011, 100, 1902–1909 CrossRef CAS PubMed.
- A. J. Engler, S. Sen, H. L. Sweeney and D. E. Discher, Cell, 2006, 126, 677–689 CrossRef CAS PubMed.
- L. E. McNamara, R. Burchmore, M. O. Riehle, P. Herzyk, M. J. P. Biggs, C. D. W. Wilkinson, A. S. G. Curtis and M. J. Dalby, Biomaterials, 2012, 33, 2835–2847 CrossRef CAS PubMed.
- A. Graziano, R. d'Aquino, M. G. Cusella-De Angelis, G. Laino, A. Piattelli, M. Pacifici, A. De Rosa and G. Papaccio, PLoS One, 2007, 2, e496 Search PubMed.
- Y. Sun, C. S. Chen and J. Fu, Annu. Rev. Biophys., 2012, 41, 519–542 CrossRef PubMed.
- A. J. Maniotis, C. S. Chen and D. E. Ingber, Proc. Natl. Acad. Sci. U. S. A., 1997, 94, 849–854 CrossRef CAS.
- M. Thery, V. Racine, M. Piel, A. Pepin, A. Dimitrov, Y. Chen, J. B. Sibarita and M. Bornens, Proc. Natl. Acad. Sci. U. S. A., 2006, 103, 19771–19776 CrossRef CAS PubMed.
- K. E. Rothenberg, S. S. Neibart, A. S. LaCroix and B. D. Hoffman, Cell. Mol. Bioeng., 2015, 8, 364–382 CrossRef CAS.
- N. Gadhari, M. Chamley, M. Marelli, J. Brugger and M. Chiquet, Biochim. Biophys. Acta, Mol. Cell Res., 2013, 1833, 3415–3425 CrossRef CAS PubMed.
- D. E. Ingber, Int. J. Dev. Biol., 2006, 50, 255–266 CrossRef PubMed.
- S. R. K. Vedula, M. C. Leong, T. L. Lai, P. Hersen, A. J. Kabla, C. T. Lim and B. Ladoux, Proc. Natl. Acad. Sci. U. S. A., 2012, 109, 12974–12979 CrossRef CAS PubMed.
- C. J. Weijer, J. Cell Sci., 2009, 122, 3215–3223 CrossRef CAS PubMed.
- R. Keller, Science, 2002, 298, 1950–1954 CrossRef CAS PubMed.
- R. Farooqui and G. Fenteany, J. Cell Sci., 2005, 118, 51–63 CrossRef CAS PubMed.
- Y. H. Wang, S. Liu, G. Zhang, C. Q. Zhou, H. X. Zhu, X. B. Zhou, L. P. Quan, J. F. Bai and N. Z. Xu, Breast Cancer Res., 2005, 7, R220–228 CrossRef CAS PubMed.
- C. Guzman, M. Bagga, A. Kaur, J. Westermarck and D. Abankwa, PLoS One, 2014, 9, e92444 Search PubMed.
- N. M. Alves, I. Pashkuleva, R. L. Reis and J. F. Mano, Small, 2010, 6, 2208–2220 CrossRef CAS PubMed.
- A. M. Ross, Z. Jiang, M. Bastmeyer and J. Lahann, Small, 2012, 8, 336–355 CrossRef CAS PubMed.
- J. L. Sterneckert, P. Reinhardt and H. R. Scholer, Nat. Rev. Genet., 2014, 15, 625–639 CrossRef CAS PubMed.
- A. Fatehullah, S. H. Tan and N. Barker, Nat. Cell Biol., 2016, 18, 246–254 CrossRef PubMed.
- A. M. Lipski, C. J. Pino, F. R. Haselton, I. W. Chen and V. P. Shastri, Biomaterials, 2008, 29, 3836–3846 CrossRef CAS PubMed.
- V. Zablotskii, O. Lunov, B. Novotna, O. Churpita, P. Trosan, V. Holan, E. Sykova, A. Dejneka and S. Kubinova, Appl. Phys. Lett., 2014, 105, 103702 CrossRef.
- L. Vergani, G. Mascetti and C. Nicolini, J. Biomol. Struct. Dyn., 2001, 18, 535–544 CAS.
- H. Gensler, R. Sheybani, P. Y. Li, R. L. Mann and E. Meng, Biomed. Microdevices, 2012, 14, 483–496 CrossRef CAS PubMed.
- J. P. Seymour, Y. M. Elkasabi, H. Y. Chen, J. Lahann and D. R. Kipke, Biomaterials, 2009, 30, 6158–6167 CrossRef CAS PubMed.
- V. Zablotskii, A. Dejneka, Š. Kubinová, D. Le-Roy, F. Dumas-Bouchiat, D. Givord, N. M. Dempsey and E. Syková, PLoS One, 2013, 8, e70416 CAS.
- S. March, V. Ramanan, K. Trehan, S. Ng, A. Galstian, N. Gural, M. A. Scull, A. Shlomai, M. M. Mota, H. E. Fleming, S. R. Khetani, C. M. Rice and S. N. Bhatia, Nat. Protoc., 2015, 10, 2027–2053 CrossRef CAS PubMed.
- A. Treyer and A. Musch, Compr. Physiol., 2013, 3, 243–287 Search PubMed.
- V. Mersch-Sundermann, S. Knasmuller, X. J. Wu, F. Darroudi and F. Kassie, Toxicology, 2004, 198, 329–340 CrossRef CAS PubMed.
- N. S. Aston, N. Watt, I. E. Morton, M. S. Tanner and G. S. Evans, Hum. Exp. Toxicol., 2000, 19, 367–376 CAS.
- W. T. Gibson and M. C. Gibson, Curr. Top. Dev. Biol., 2009, 89, 87–114 CAS.
- V. Vogel and M. Sheetz, Nat. Rev. Mol. Cell Biol., 2006, 7, 265–275 CrossRef CAS PubMed.
- F. B. Gao and M. Raff, J. Cell Biol., 1997, 138, 1367–1377 CrossRef CAS PubMed.
- G. Halder, S. Dupont and S. Piccolo, Nat. Rev. Mol. Cell Biol., 2012, 13, 591–600 CrossRef CAS PubMed.
- M. P. Murrell and M. L. Gardel, Proc. Natl. Acad. Sci. U. S. A., 2012, 109, 20820–20825 CrossRef CAS PubMed.
- R. McBeath, D. M. Pirone, C. M. Nelson, K. Bhadriraju and C. S. Chen, Dev. Cell, 2004, 6, 483–495 CrossRef CAS PubMed.
- G. Mascetti, L. Vergani, A. Diaspro, S. Carrara, G. Radicchi and C. Nicolini, Cytometry, 1996, 23, 110–119 CrossRef CAS PubMed.
- L. Vergani, M. Grattarola and C. Nicolini, Int. J. Biochem. Cell Biol., 2004, 36, 1447–1461 CrossRef CAS PubMed.
- D. D. Klumpers, A. S. Mao, T. H. Smit and D. J. Mooney, J. R. Soc., Interface, 2014, 11, 20140215 CrossRef PubMed.
- K. R. Milner and C. A. Siedlecki, J. Biomed. Mater. Res., Part A, 2007, 82, 80–91 CrossRef PubMed.
- S. J. Streichan, C. R. Hoerner, T. Schneidt, D. Holzer and L. Hufnagel, Proc. Natl. Acad. Sci. U. S. A., 2014, 111, 5586–5591 CrossRef CAS PubMed.
- V. Zablotskii, O. Lunov, A. Dejneka, L. Jastrabik, T. Polyakova, T. Syrovets and T. Simmet, Appl. Phys. Lett., 2011, 99, 183701 CrossRef.
- L. A. Zwelling, E. Estey, L. Silberman, S. Doyle and W. Hittelman, Cancer Res., 1987, 47, 251–257 CAS.
- J. H. Oh, A. Gertych and J. Tajbakhsh, OncoTargets Ther., 2013, 4, 474–493 CrossRef PubMed.
- X. Trepat, M. R. Wasserman, T. E. Angelini, E. Millet, D. A. Weitz, J. P. Butler and J. J. Fredberg, Nat. Phys., 2009, 5, 426–430 CrossRef CAS.
- J. H. Kim, L. J. Dooling and A. R. Asthagiri, J. R. Soc., Interface, 2010, 7, S341–S350 CrossRef PubMed.
- W. L. Haisler, D. M. Timm, J. A. Gage, H. Tseng, T. C. Killian and G. R. Souza, Nat. Protoc., 2013, 8, 1940–1949 CrossRef CAS PubMed.
- E. W. Mei, A. Sharonov, F. Gao, J. H. Ferris and R. A. Hochstrasser, J. Phys. Chem. A, 2004, 108, 7339–7346 CrossRef CAS.
- D. P. Wang, C. L. He, M. P. Stoykovich and D. K. Schwartz, ACS Nano, 2015, 9, 1656–1664 CrossRef CAS PubMed.
- T. L. Downing, J. Soto, C. Morez, T. Houssin, A. Fritz, F. Yuan, J. Chu, S. Patel, D. V. Schaffer and S. Li, Nat. Mater., 2013, 12, 1154–1162 CrossRef CAS PubMed.
Footnote |
| † Electronic supplementary information (ESI) available. See DOI: 10.1039/c6ib00125d |
|
| This journal is © The Royal Society of Chemistry 2016 |

 Open Access Article
 This Open Access Article is licensed under a


