
 Open Access Article
 This Open Access Article is licensed under a Creative Commons Attribution-Non Commercial 3.0 Unported Licence
Pathway-based network modeling finds hidden genes in shRNA screen for regulators of acute lymphoblastic leukemia†
Jennifer L.
Wilson
a,
Simona
Dalin
 b,
Sara
Gosline
a,
Michael
Hemann
b,
Ernest
Fraenkel
*ab and
Douglas A.
Lauffenburger
*a
b,
Sara
Gosline
a,
Michael
Hemann
b,
Ernest
Fraenkel
*ab and
Douglas A.
Lauffenburger
*a
aDepartment of Biological Engineering, Massachusetts Institute of Technology, 77 Massachusetts Avenue, 16-343, Cambridge MA 02139, USA. E-mail: fraenkel@mit.edu; lauffen@mit.edu; Tel: +1-617-252-1629
bDepartment of Biology, Massachusetts Institute of Technology, Cambridge MA 02139, USA
First published on 2nd June 2016
Abstract
Data integration stands to improve interpretation of RNAi screens which, as a result of off-target effects, typically yield numerous gene hits of which only a few validate. These off-target effects can result from seed matches to unintended gene targets (reagent-based) or cellular pathways, which can compensate for gene perturbations (biology-based). We focus on the biology-based effects and use network modeling tools to discover pathways de novo around RNAi hits. By looking at hits in a functional context, we can uncover novel biology not identified from any individual ‘omics measurement. We leverage multiple ‘omic measurements using the Simultaneous Analysis of Multiple Networks (SAMNet) computational framework to model a genome scale shRNA screen investigating Acute Lymphoblastic Leukemia (ALL) progression in vivo. Our network model is enriched for cellular processes associated with hematopoietic differentiation and homeostasis even though none of the individual ‘omic sets showed this enrichment. The model identifies genes associated with the TGF-beta pathway and predicts a role in ALL progression for many genes without this functional annotation. We further experimentally validate the hidden genes – Wwp1, a ubiquitin ligase, and Hgs, a multi-vesicular body associated protein – for their role in ALL progression. Our ALL pathway model includes genes with roles in multiple types of leukemia and roles in hematological development. We identify a tumor suppressor role for Wwp1 in ALL progression. This work demonstrates that network integration approaches can compensate for off-target effects, and that these methods can uncover novel biology retroactively on existing screening data. We anticipate that this framework will be valuable to multiple functional genomic technologies – siRNA, shRNA, and CRISPR – generally, and will improve the utility of functional genomic studies.
Insight, innovation, integrationThis work integrates multiple ‘omic data sets to better understand leukemia pathology. The most striking finding in this work is that we can identify biological annotations from these data when these datasets are integrated in a network model even though these annotations were not present in any individual input dataset. Further, we use RNAi screening data as the model's foundation; this screening technology is a popular tool for probing gene function that is criticized for noise and off-target effects. With integration, we derive novel insights in spite of this noise and are able to test our theoretical findings through dedicated validation. |
Introduction
Functional genomic screens are a powerful tool for systematically probing gene function in the context of many biological systems.1–6 Shortly after its adaptation to experimental work, RNAi gained popularity as the technology is relatively easily and quickly adaptable to multiple biological systems.3,5,6 However, off-target effects (OTEs) which can result from seed matches between the individual RNAi and unintended genes7 are a widely criticized limitation of this technology. These effects complicate validation and pursuit of further hypotheses6,8,9 and thus, RNAi screens require analysis methods that can more efficiently identify true targets for validation.6,7 Many studies have focused on improving the stability and specificity of the RNAi reagents themselves,10 or have developed algorithms for predicting real effects by considering unintended seed matches.8,11,12 Other studies have considered alternative platforms, such as TALENS or CRISPR, for probing gene function.5 CRISPR systems can exhibit stronger loss of function phenotypes than RNAi and seem a promising alternative.13 These systems enable precision genome engineering by more efficiently blocking gene function, and have the added capacity of being able to activate and inactivate genes.13 CRISPR systems still suffer from OTEs and are sensitive to mismatches in the 12 bases proximal to the guide strand.14 Overall, these approaches only address the technical challenges of gene interference and do not consider the biological consequences.Few investigations have considered how a cell may compensate for a gene perturbation. An RNAi reagent may perfectly block an mRNA transcript, but a redundant protein may compensate for the loss of a particular gene or the targeted protein may be stable beyond the duration of knockdown, leading to false negatives. Further reasons for false negatives include the inability for RNAi to sufficiently diminish expression of highly stable proteins (e.g. enzymes which may retain function after knockdown) or the use of small, targeted libraries. To compensate for the possibility of false positives and false negatives, one group used GO analysis to find consensus among three different siRNA screens for HIV replication factors. The group saw little overlap between the specific hits from each screen, but saw that all three screens had top hits enriched for the same GO functions.15 Given the propensity for OTEs, it is not surprising that three independent screens identified different candidate hits, but it is striking that the individual hits fall in similar pathways.15 This work foreshadows the value of using pathways to provide context around any individual hit. However, our current definitions of cellular pathways are incomplete and there is a real need for discovering pathways and attributing new genes to existing pathways.
Here we pursued an integrated, pathway-based approach to identify in vivo specific regulators of acute lymphoblastic leukemia (ALL) progression. Development of treatments for acute lymphoblastic leukemia (ALL) has had mixed success and improvements in patient overall survival is still unchanging.16 For childhood ALL patients, 10% suffer remissions and these treatments have high toxicity.17 We already know that the tumor microenvironment affects how cancers progress and respond to therapies in a complex manner. Paracrine signaling in the bone-marrow microenvironment can confer resistance to therapy in myeloma18 and local cytokines can promote cancer development in the context of specific genetic lesions.19 More thorough disease characterization in the native microenvironment would facilitate development of new treatment strategies. Further, ALL is just one of many types of cancers which arises from incomplete hematopoietic differentiation. Given the similar origin of these diseases, it is possible that we can learn and repurpose molecular studies from other hematopoietic cancers to accelerate development for ALL. Already, we have used a genome-wide shRNA screen to discover genetic mediators of pre-B-cell ALL progression in vivo, and demonstrated the ability to identify micro-environment-specific genes affecting improper B-cell development.20
Recognizing the likelihood of significant OTEs and acknowledging the significant merits of pathways analysis methods, we developed a network model to discover missed targets, or predicted genes, from the initial shRNA screen. This network model builds on the pathway-based approach described earlier by incorporating diverse experimental datasets to better model the genes contributing to ALL progression. We assume that many pathway annotations are incomplete, and that modeling multiple experimental datasets will uncover novel pathways. We construct our network model using shRNA, ChIPseq, and mRNA expression data and use this model to understand and validate features of the in vivo system. We experimentally validate novel roles for Hgs and Wwp1: Hgs is a gene that is generally deleterious to B-cell ALL viability, and Wwp1 is an in vivo specific regulator of disease progression. We perform this analysis using screening data that was not designed for further computational modeling in mind – the screen did not contain redundant shRNAs or non-targeting controls. Taken together these results demonstrate the ability of network models to select candidate targets from an shRNA screen and discover novel pathways from disparate datasets. Biologically, the model makes specific predictions about gene targets that affect ALL progression by affecting the tumor microenvironment, illuminating multiple pathways that are relevant for therapeutic development in ALL.
Results
A network-based data integration scheme
To identify pathways that mediate ALL progression, using multiple experimental data − we introduce a network-based approach, described in Fig. 1. Conceptually, this approach uses published protein–protein interaction data (Fig. 1A) alongside computational derived protein–DNA interactions to construct a set of all possible interactions that can relate experimental measurements from shRNA screening and mRNA expression. This larger network will then be reduced (Fig. 1B and C) to identify biological pathways, either known or unknown, that are implicated by the experimental data, described below.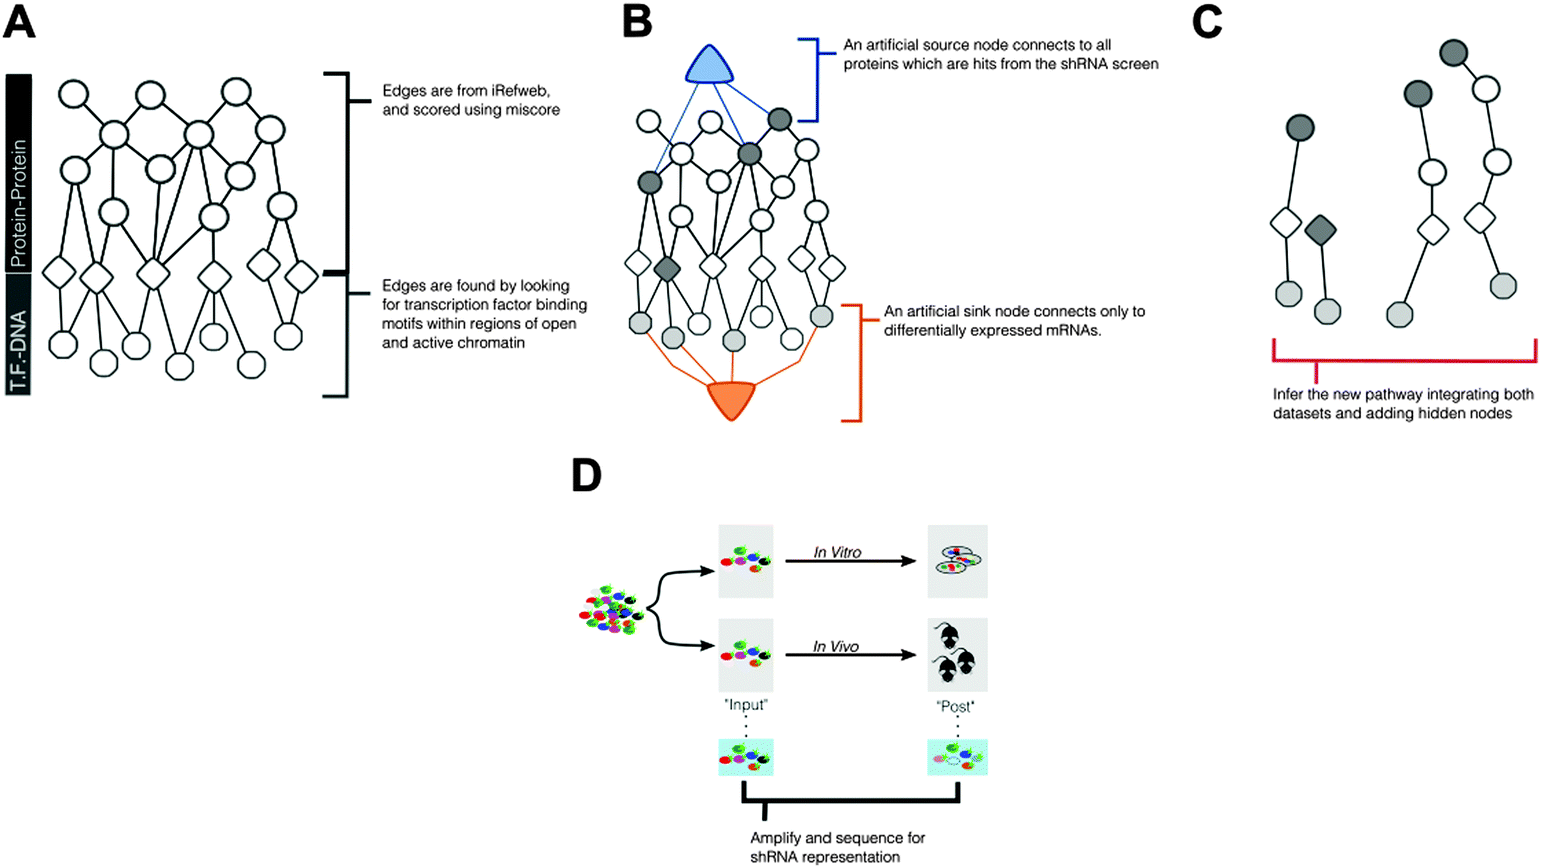 | ||
| Fig. 1 Constructing a network model from multiple ‘omic measurements. (A) We start with a probabilistic interactome that includes protein–protein interactions scored by the confidence of their interaction. This confidence score reflects the strength of evidence across multiple interaction databases and this score constrains the edge's capacity within our flow-based model. Higher confidence leads to higher capacity. Some of these proteins are transcription factors (triangles). We complement these edges with transcription-factor (triangles) to DNA (octagons) binding interactions. We predict these interactions and their edge probabilities by measuring active and open chromatin via ChIP-seq and looking for enrichment of transcription factor binding motifs. Conceptually, this is our available road map for creating pathways where the capacities are akin to speed limits. (B) We connect an artificial source node to all proteins that have corresponding shRNAs that were considered hits in the screen. These edge capacities reflect the strength of the shRNA effect. In our model, these edges reflect how strongly an shRNA depletes from input to morbidity. We connect an artificial sink node to differentially expressed mRNAs. These edges reflect the fold-change in expression. The algorithm introduces flow into the network and looks for an optimal route from the source to the sink, selecting edges based on available capacity. (C) The final path through the interactome becomes the de novo pathway. This pathway may or may not include all of the original inputs (e.g. differentially expressed mRNA or depleted shRNAs). Further, SAMNet allows the simultaneous construction of pathways for multiple conditions. In our investigation we treated the parallel in vitro and in vivo screens as separate conditions. (D) Screening design interrogates in vivo specific regulators of ALL progression. A genome-scale library was introduced to ALL cells in vitro. Representative samples were either maintained in culture or transplanted into mouse models. At time of morbidity, blood and culture samples were re-sequenced to measure shRNA representation. | ||
shRNA screen and mRNA expression data identify distinct and incomplete gene sets
We collected previously-published shRNA screens and mRNA expression data from a mouse model of ALL, one in vitro and the other in vivo20 (Fig. 1D). Together this data represents the direct and indirect effects of RNA knockdown in both environments.To identify the direct effects of shRNA screens, we calculated a fold-change in shRNA representation, comparing sequencing reads for each shRNA at input (time of transplant) and post disease burden (at morbidity). We ranked genes based on the greatest depletion from input to post disease burden and considered the top 1% (84/87 genes for the in vivo/in vitro screens) for further investigation (Table 1). GO enrichment of the ranked list, using GOrilla21,22 of targets from the in vivo dataset did not identify any enrichment of GO terms. GO enrichment of the ranked in vitro targets found enrichment of cellular homeostasis, and cation regulation; however, these terms were enriched merely based on the presence of TMEM165, KCNA5, and CEBPA, without contribution from any other targets in the ranking (Table 2). Overall, we found little functional enrichment or information from shRNA data alone, suggesting that we had an incomplete picture of genes regulating ALL progression.
| Gene | Abs (f.c.) |
|---|---|
| In vivo | |
| ASRGL1 | 10.818 |
| FNDC5 | 10.233 |
| MRPL37 | 9.670 |
| ATP6V1C1 | 9.478 |
| DHX37 | 9.244 |
| NRG2 | 9.155 |
| ATP10B | 8.940 |
| HOXD3 | 8.765 |
| HDHD1 | 8.760 |
| PCBP4 | 8.744 |
| DHDDS | 8.633 |
| SERF1A | 8.474 |
| SLC29A2 | 8.390 |
| STK32B | 8.296 |
| POLQ | 8.241 |
| GTF3C5 | 8.164 |
| SPC24 | 8.140 |
| IPO11 | 8.102 |
| GMPS | 8.102 |
| UBE2H | 8.073 |
| ZNF416 | 8.025 |
| CASP14 | 8.014 |
| SCD | 8.000 |
| MAPRE3 | 7.898 |
| PLEKHA5 | 7.879 |
| SMARCD1 | 7.856 |
| DENND1C | 7.840 |
| TMEM156 | 7.821 |
| TMEM176A | 7.800 |
| LPPR5 | 7.751 |
| SRP72 | 7.704 |
| ATP6AP2 | 7.595 |
| FOXO6 | 7.588 |
| WISP3 | 7.564 |
| LCE3C | 7.562 |
| ZBTB4 | 7.512 |
| RCC1 | 7.512 |
| FXYD6 | 7.512 |
| UBE2L6 | 7.505 |
| SNTB1 | 7.498 |
| TIMD4 | 7.480 |
| DVL1 | 7.452 |
| COLEC12 | 7.440 |
| DHRS7C | 7.440 |
| CTSC | 7.435 |
| CECR5 | 7.425 |
| IQCH | 7.425 |
| MTRF1L | 7.366 |
| TGS1 | 7.337 |
| TIGD5 | 7.327 |
| SPATA13 | 7.306 |
| CPSF6 | 7.296 |
| NDUFS1 | 7.292 |
| ARMCX6 | 7.281 |
| OR13C4 | 7.275 |
| BCMO1 | 7.270 |
| SF3A1 | 7.268 |
| DIAPH3 | 7.266 |
| PGLYRP2 | 7.249 |
| ABHD12B | 7.242 |
| DRD1 | 7.241 |
| ODF2 | 7.238 |
| POGZ | 7.215 |
| TDRD7 | 7.206 |
| C9orf69 | 7.193 |
| ALKBH2 | 7.143 |
| GRHL3 | 7.119 |
| C17orf97 | 7.111 |
| SUZ12 | 7.111 |
| TMEM79 | 7.106 |
| LAG3 | 7.062 |
| IDH3A | 7.042 |
| C4orf32 | 7.039 |
| PNO1 | 7.018 |
| FUT10 | 7.005 |
| VCPIP1 | 6.990 |
| TFDP1 | 6.974 |
| RPL7 | 6.966 |
| RNF11 | 6.956 |
| SLC6A2 | 6.951 |
| YEATS2 | 6.932 |
| LAP3 | 6.928 |
| ADAMTS18 | 6.927 |
| TRIM33 | 6.916 |
| In vitro | |
| C10orf71 | 10.038 |
| KCNA5 | 9.965 |
| TMEM165 | 9.751 |
| C1orf85 | 9.671 |
| KLF3 | 9.633 |
| CEBPA | 9.333 |
| TPSG1 | 8.975 |
| ZNF367 | 8.826 |
| GTPBP10 | 8.774 |
| MFSD3 | 8.754 |
| GLB1L | 8.558 |
| DNTT | 8.498 |
| MYT1 | 8.285 |
| ANKS6 | 8.262 |
| KRT77 | 8.160 |
| NRARP | 8.103 |
| PPP3CB | 8.099 |
| MAD2L1 | 8.055 |
| CRNKL1 | 8.016 |
| ACTC1 | 8.016 |
| AHCYL1 | 8.016 |
| FCRL3 | 7.996 |
| SURF4 | 7.996 |
| RCOR2 | 7.962 |
| FCGR3A | 7.955 |
| ZNF616 | 7.913 |
| BAG5 | 7.902 |
| SASS6 | 7.803 |
| SMYD5 | 7.760 |
| TRIM59 | 7.745 |
| ZNF347 | 7.723 |
| NFAT5 | 7.721 |
| MATR3 | 7.649 |
| MED8 | 7.643 |
| CCT2 | 7.550 |
| RAB33A | 7.545 |
| MCPH1 | 7.440 |
| KCTD1 | 7.407 |
| POLR3GL | 7.380 |
| MPZL1 | 7.365 |
| INTS1 | 7.341 |
| DNMT3A | 7.334 |
| ARL9 | 7.304 |
| DOK2 | 7.285 |
| SYNJ2 | 7.285 |
| MBTPS2 | 7.228 |
| C4orf17 | 7.183 |
| NHLRC1 | 7.107 |
| ATXN3 | 7.090 |
| MID2 | 7.090 |
| CHM | 7.022 |
| MEIS1 | 6.997 |
| ZNF583 | 6.922 |
| LAT | 6.909 |
| ZNF217 | 6.908 |
| TPRKB | 6.893 |
| POLR2B | 6.881 |
| SPIRE1 | 6.849 |
| ENO3 | 6.826 |
| ZKSCAN2 | 6.722 |
| C1orf106 | 6.694 |
| REG1A | 6.675 |
| ZBTB24 | 6.667 |
| TTLL9 | 6.663 |
| ITGB1BP1 | 6.633 |
| IL5RA | 6.607 |
| SNTB2 | 6.598 |
| AKR1D1 | 6.560 |
| ZFYVE26 | 6.554 |
| MRPL13 | 6.484 |
| TDGF1 | 6.457 |
| LGALS7 | 6.428 |
| GCH1 | 6.378 |
| DSEL | 6.301 |
| EIF2S3 | 6.300 |
| S100A4 | 6.299 |
| MRO | 6.279 |
| HMGA2 | 6.157 |
| RASL10A | 6.154 |
| GIT2 | 6.148 |
| PPARG | 6.131 |
| SCLT1 | 6.104 |
| ASXL2 | 6.091 |
| TM7SF3 | 6.078 |
| NOS3 | 6.044 |
| BICD1 | 6.040 |
| NR3C1 | 6.035 |
| Go process | FDR q-value |
|---|---|
| Cellular homeostasis | 3.79 × 10⁻² |
| Ion homeostasis | 4.07 × 10⁻² |
| Cellular divalent inorganic cation homeostasis | 4.38 × 10⁻² |
| Divalent inorganic cation homeostasis | 4.74 × 10⁻² |
| Cellular chemical homeostasis | 5.17 × 10⁻² |
| Cation homeostasis | 5.69 × 10⁻² |
| Calcium ion homeostasis | 6.32 × 10⁻² |
| Metal ion homeostasis | 7.12 × 10⁻² |
| Monovalent inorganic cation homeostasis | 8.13 × 10⁻² |
| Chemical homeostasis | 9.32 × 10⁻² |
| Inorganic ion homeostasis | 9.49 × 10⁻² |
| Metal ion transport | 1.14 × 10⁻¹ |
| Cellular cation homeostasis | 1.42 × 10⁻¹ |
| Cellular metal ion homeostasis | 1.90 × 10⁻¹ |
| Cellular ion homeostasis | 2.85 × 10⁻¹ |
| Cellular calcium ion homeostasis | 5.69 × 10⁻¹ |
Using microarrays, we also collected differential mRNA expression data to compare between cellular contexts at morbidity. Genes were considered based on their fold-change relative to the in vivo context, and ranked based on fold-change. Again, we investigated the top 1% of genes up-regulated in vivo (77 genes) and up-regulated in vitro (66 genes) (Table 3). Using GOrilla, we found few enriched GO terms in the in vivo data genes as compared to the whole genome; these terms included regulation of transport, and actin cytoskeleton organization (Table 4). There were no enriched GO terms in the set of genes up regulated in the in vitro context. We would expect that for any biological process, not all relevant genes will be differentially expressed or be sensitive to shRNA perturbation. Given these circumstances, we would not expect differential expression analysis or shRNA screening to uncover all relevant genes or expect these measurements to identify the same genes. The fact that there was little functional enrichment in these top candidates reaffirms the incomplete nature of individual high-throughput measurements,23 and suggests an integrated approach could find hidden information.
| In vivo, genes with fold-change values | |||||
| HBA-A1 | 12.10 | LOC671894///LOC674 | 7.75 | MYOM2 | 7.03 |
| S100A9 | 11.93 | RTP4 | 7.63 | MX1 | 7.01 |
| S100A8 | 10.92 | MS4A1 | 7.61 | TIAM1 | 7.00 |
| IIGP1 | 9.91 | 4732416N19RIK | 7.57 | D430019H16RIK | 6.97 |
| RHOJ | 9.80 | 2900041A09RIK | 7.56 | DOCK9///LOC670309 | 6.96 |
| NKG7 | 9.76 | CASP4 | 7.55 | SPARC | 6.96 |
| AQP1 | 9.75 | IFITM3 | 7.53 | FPR-RS2 | 6.93 |
| ANXA2 | 9.64 | SLFN4 | 7.53 | PLF///PLF2///MRP | 6.91 |
| CSF1R | 8.94 | 5830431A10RIK | 7.49 | MYH6///LOC671894/ | 6.81 |
| IL18 | 8.85 | ZBP1 | 7.44 | CCL3 | 6.75 |
| NRP1 | 8.68 | B230343A10RIK | 7.41 | S100A5 | 6.73 |
| FOS | 8.52 | CCL5 | 7.37 | TIMM8A2 | 6.72 |
| SAA3P | 8.47 | 4921525O09RIK | 7.36 | LGMN | 6.69 |
| CHI3L3 | 8.45 | C5AR1 | 7.33 | DLGH3 | 6.65 |
| TCRB-J///TCRB-V13 | 8.29 | C1QB | 7.30 | ITGA5 | 6.65 |
| LOC240327 | 8.27 | HTRA3 | 7.28 | KLK3 | 6.64 |
| IGL-V1///2010309G2 | 8.26 | LAMB2 | 7.26 | LGALS3BP | 6.64 |
| ENPP3 | 8.24 | PLXNB1 | 7.25 | CD97 | 6.63 |
| PGLYRP1 | 8.19 | IL2RA | 7.24 | DIRAS2 | 6.60 |
| SLC9A3R2 | 8.11 | A330102K04RIK | 7.19 | KLF4 | 6.55 |
| LCN2 | 8.00 | GPRC5A | 7.16 | GZMA | 6.52 |
| BLR1 | 7.90 | TCRB-V13///LOC6655 | 7.12 | 2010300C02RIK///LO | 6.51 |
| HYDIN | 7.89 | TYROBP | 7.10 | ADCY6 | 6.51 |
| EPPK1 | 7.88 | 1100001G20RIK | 7.05 | A930013B10RIK | 6.49 |
| NGP | 7.82 | LMNA | 7.04 | TLR1 | 6.48 |
| MPA2L///LOC626578 | 7.80 | XDH | 7.04 | ||
| In vitro, genes with fold-changes | |||||
| TGFB3 | −9.74 | IL21R | −4.82 | 5730442G03RIK | −3.78 |
| HBB-BH1 | −8.50 | BEX6 | −4.57 | 1700025G04RIK | −3.77 |
| VLDLR | −7.05 | 1190002F15RIK | −4.39 | B230107K20RIK | −3.77 |
| HS3ST1 | −6.99 | FETUB | −4.34 | JDP2 | −3.77 |
| PLA2G2F | −6.02 | NUPR1 | −4.33 | NETO2 | −3.76 |
| 1700097N02RIK | −5.97 | REEP1 | −4.29 | PRG3 | −3.69 |
| NKX1-2 | −5.77 | GLRP1 | −4.25 | RTN4RL2 | −3.57 |
| ACTR3B | −5.69 | SENP8 | −4.17 | SLC6A13 | −3.57 |
| PPP1R3B | −5.52 | CCR2 | −4.15 | D19ERTD652E | −3.53 |
| UBQLN2 | −5.49 | PAX7 | −4.13 | ORC1L | −3.51 |
| ANKRD15 | −5.42 | POLH | −4.10 | CD248 | −3.51 |
| SOX6 | −5.38 | 2610019I03RIK | −4.05 | DPM3 | −3.48 |
| CDH1 | −5.37 | FADS2 | −4.03 | GM129 | −3.48 |
| 1810011H11RIK | −5.35 | DKK3 | −3.99 | USP2 | −3.48 |
| CD28 | −5.20 | PKP2 | −3.95 | EVA1 | −3.45 |
| LOC433844 | −5.13 | AXIN2 | −3.92 | ABCG1 | −3.44 |
| AI427515 | −5.09 | KIF2C///LOC631653 | −3.88 | AMMECR1 | −3.43 |
| ART4 | −5.01 | NAP1L3 | −3.84 | CMAH | −3.42 |
| PTGS1 | −4.95 | 2610021K21RIK | −3.83 | PLK1 | −3.40 |
| GFI1B | −4.95 | BARD1 | −3.83 | ZDHHC2 | −3.39 |
| SELENBP1 | −4.93 | CHAC1 | −3.80 | GCM2 | −3.39 |
| CTH | −4.93 | 4731417B20RIK | −3.79 | MAP6 | −3.38 |
| GO function | FDR q-value |
|---|---|
| Regulation of transport | 1.24 × 10⁻¹ |
| Response to transition metal nanoparticle | 1.96 × 10⁻¹ |
| Positive regulation of transport | 2.15 × 10⁻¹ |
| Actin filament-based process | 2.46 × 10⁻¹ |
| Actin cytoskeleton organization | 3.27 × 10⁻¹ |
Measuring histone activation for model specificity
When designing this model, we wanted to find interaction sets that connected the genes identified from the shRNA screen and from differential expression analysis. This model required protein to DNA interactions in addition to the existing protein to protein interactions in our interactome (Fig. 1A). These interactions were not publically available so we used a combined computational and experimental approach. Specifically, we used measurements of open and active chromatin to identify regions of putative transcriptional activity and predicted transcription factor to DNA binding interactions using computational modeling techniques.We collected ChIP-seq data for the activating histone markers H3K27Ac and H3K4me3 from our ALL model in culture. Compared to an IgG control, we identified 29![[thin space (1/6-em)]](https://www.rsc.org/images/entities/char_2009.gif) 468 and 18142 peaks in the H3K27Ac and H3K4me3 datasets respectively. To identify regions of possible transcription factor binding, we searched within these peak regions for local minima, or valleys, between histones; from this analysis we found 70894 and 24617 valley sequences in the H3K27Ac and H3K4me3 datasets. Of these valleys, 15178 regions overlapped between the two datasets (21% of the H3K27Ac and 62% of the H3K4me3). Fig. 2 shows example ChIP-seq reads, MACS peaks, valley regions, and IgG controls for 3 control genes: Trim27, E2f3, and Hist1h1b. We selected these example genes because they had relevant histone activation marks in mouse B-cell samples that were previously published in the UCSC Genome Browser. From existing data, we expected to measure activation, and used these results to benchmark the quality of our experimental data prior to computational analysis. For these genes, the H3K4me3 and H3K27Ac ChIP-seq and MACs peaks were well aligned, although the valleys varied slightly. In the case of Hist1h1b, the H3K27Ac data had a larger MACS peak and thus more valley regions. Given these trends, we used the union of all valley regions to identify possible regions of transcription factor binding.
468 and 18142 peaks in the H3K27Ac and H3K4me3 datasets respectively. To identify regions of possible transcription factor binding, we searched within these peak regions for local minima, or valleys, between histones; from this analysis we found 70894 and 24617 valley sequences in the H3K27Ac and H3K4me3 datasets. Of these valleys, 15178 regions overlapped between the two datasets (21% of the H3K27Ac and 62% of the H3K4me3). Fig. 2 shows example ChIP-seq reads, MACS peaks, valley regions, and IgG controls for 3 control genes: Trim27, E2f3, and Hist1h1b. We selected these example genes because they had relevant histone activation marks in mouse B-cell samples that were previously published in the UCSC Genome Browser. From existing data, we expected to measure activation, and used these results to benchmark the quality of our experimental data prior to computational analysis. For these genes, the H3K4me3 and H3K27Ac ChIP-seq and MACs peaks were well aligned, although the valleys varied slightly. In the case of Hist1h1b, the H3K27Ac data had a larger MACS peak and thus more valley regions. Given these trends, we used the union of all valley regions to identify possible regions of transcription factor binding.
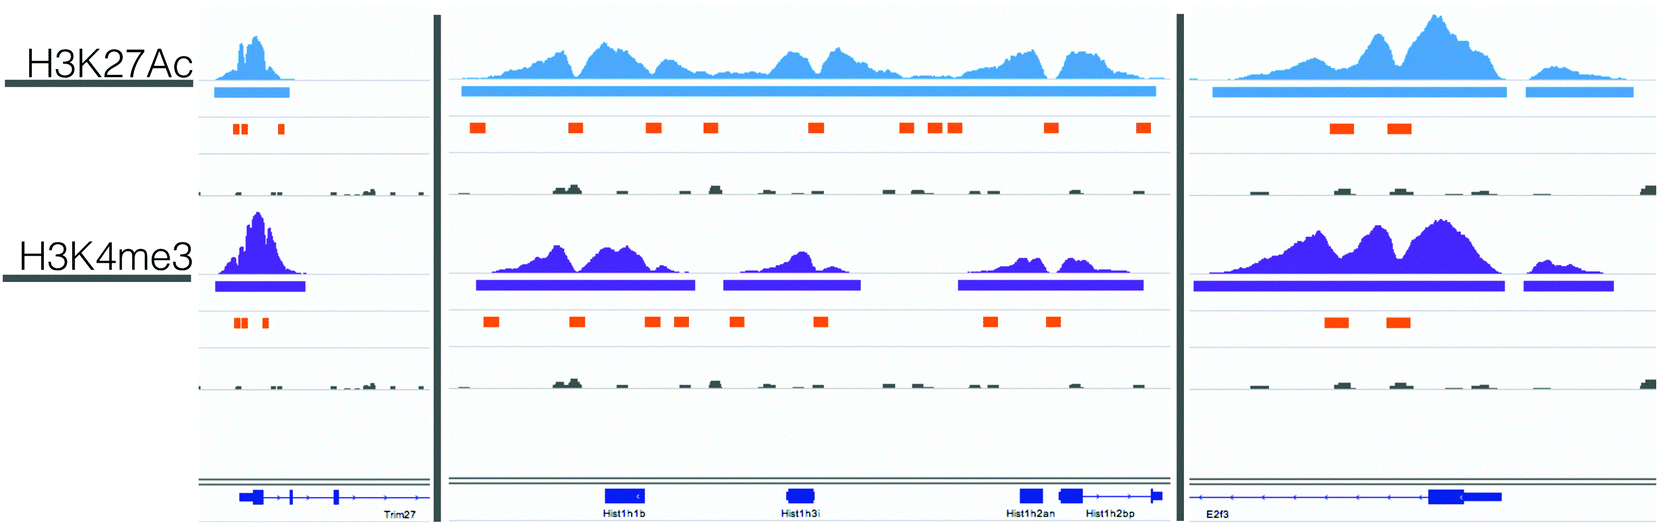 | ||
| Fig. 2 ChIP-seq with valley-finding identifies regions for transcription-factor binding. Genome viewer tracks for Trim27 (chr13:21,267,345-21,277,316), E2f3 (chr13:30,071,171-30,083,320), and Hist1h1b (chr13:21,868,763-21,874,488), showing ChIP-seq reads (top), MACs peaks (middle), valley regions (lower, orange), and IgG control (grey, lower) for H3K27Ac (top 4 rows) and H3K4me3 (bottom 4 rows). The valleys highlight regions where we searched for transcription factor binding motifs. | ||
From these active valley regions, we used our own software suite, Garnet, to identify transcription factor to DNA binding interactions. Garnet uses a weighted scoring approach to quantify the probability that a transcription factor occupies a region based on the strength of the transcription factor motif.24,25 The analysis created a list of 262705 interactions with scores above 0.3. We select 0.3 as a lower-bound for selecting interactions to reduce computational time. The algorithm is incentivized to use higher quality (i.e. higher scored) interactions, and so eliminating the weakest interactions creates smaller data objects. The upper bound is 0.99 because Garnet creates a normalized score. We append these interactions to an existing protein–protein interaction network derived from iRefWeb (interactome described in methods).
SAMNet identifies a network of genes affecting ALL progression
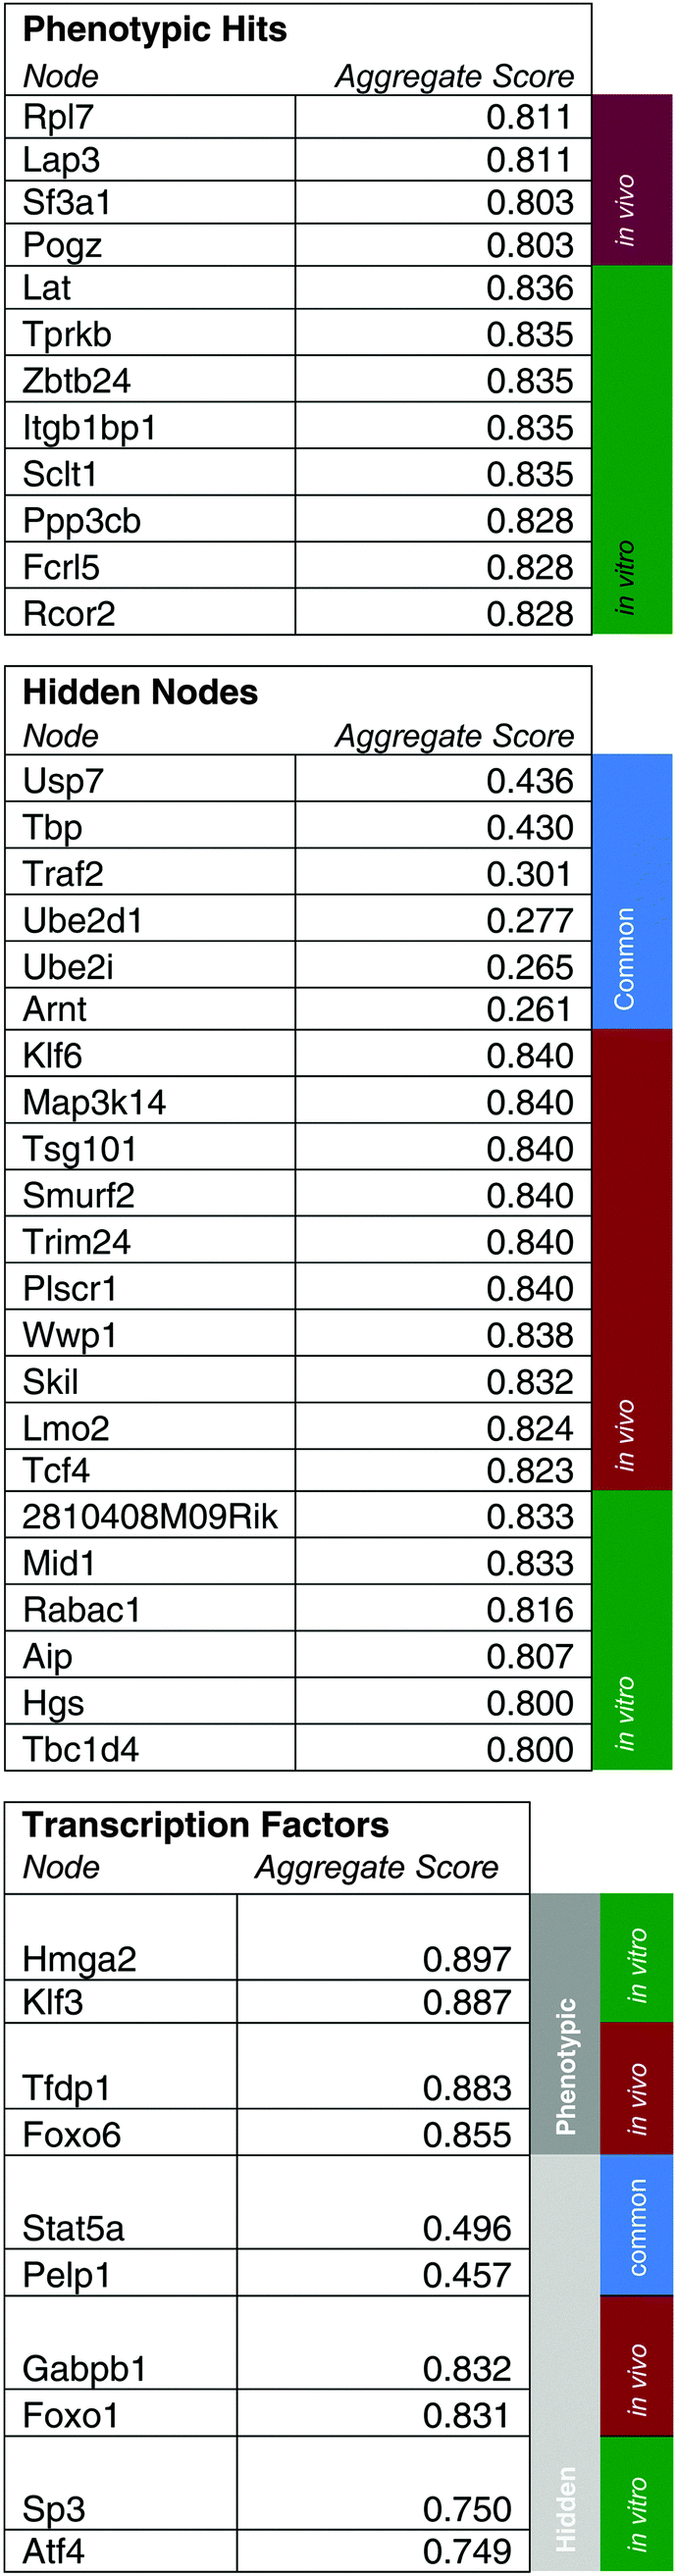
As we already knew that shRNA and mRNA measurements capture distinct pathway components,23 we pursued a data integration approach to predict new genes in the ALL progression pathway. We used the Simultaneous Analysis of Multiple Networks (SAMNet)26 to construct such a pathway because this was the most powerful tool given the data we had collected. The algorithm integrates diverse perturbation and response datasets and maps them to a physical interaction network comprising all possible ways by which the perturbed species (e.g. shRNA hits) can give rise to the observed response (e.g. differentially expressed transcripts). SAMNet then applies a network flow-based paradigm to select a subset of interactions that relates the experimentally-perturbed genes from the shRNA screen to the differentially expressed mRNA through the specified interactome. We conceptually depict how SAMNet integrates shRNA and mRNA data with our interaction network, or interactome in Fig. 1. In the context of the resulting model, RNAi genes are connected upstream of transcription factors and differentially-expressed mRNAs; sometimes, RNAi genes represent transcription factors themselves and are directly connected to differential mRNAs. Mathematically, the algorithm selects an interaction sub-network by pushing flow through a probabilistically-weighted interactome (described in methods). Flow initiates at the RNAi hits and terminates on differentially expressed mRNAs. Fold-change values from RNAi and mRNA expression data constrain the amount of flow any experimental gene hit can capture in the network. Genes are able to capture flow from either commodity, and interactions can be shared between commodities if the algorithm identifies that these interactions can connect data from both experimental environments.The foundational model consisted of 311 nodes and 480 edges (full network available at http://fraenkel-nsf.csbi.mit.edu/psiquic/cytoscape.html). We proceeded from this foundation by removing the ‘source’ and ‘sink’ nodes which are topological formalities for creating the network model. This created an interaction network where upstream protein–protein interactions converge on transcription factor to DNA binding interactions. To first focus on a protein interaction sub-network, we omitted the 43 mRNA nodes and transcription factors that are not directly connected to the protein–protein interactome (see below). The resulting sub-network contains 258 nodes and 259 edges (Fig. 3). This network contained 91 targets from the RNAi inputs (i.e. experimental genes), and 167 predicted genes. Of the 167 predicted genes, 33 are transcription factors.
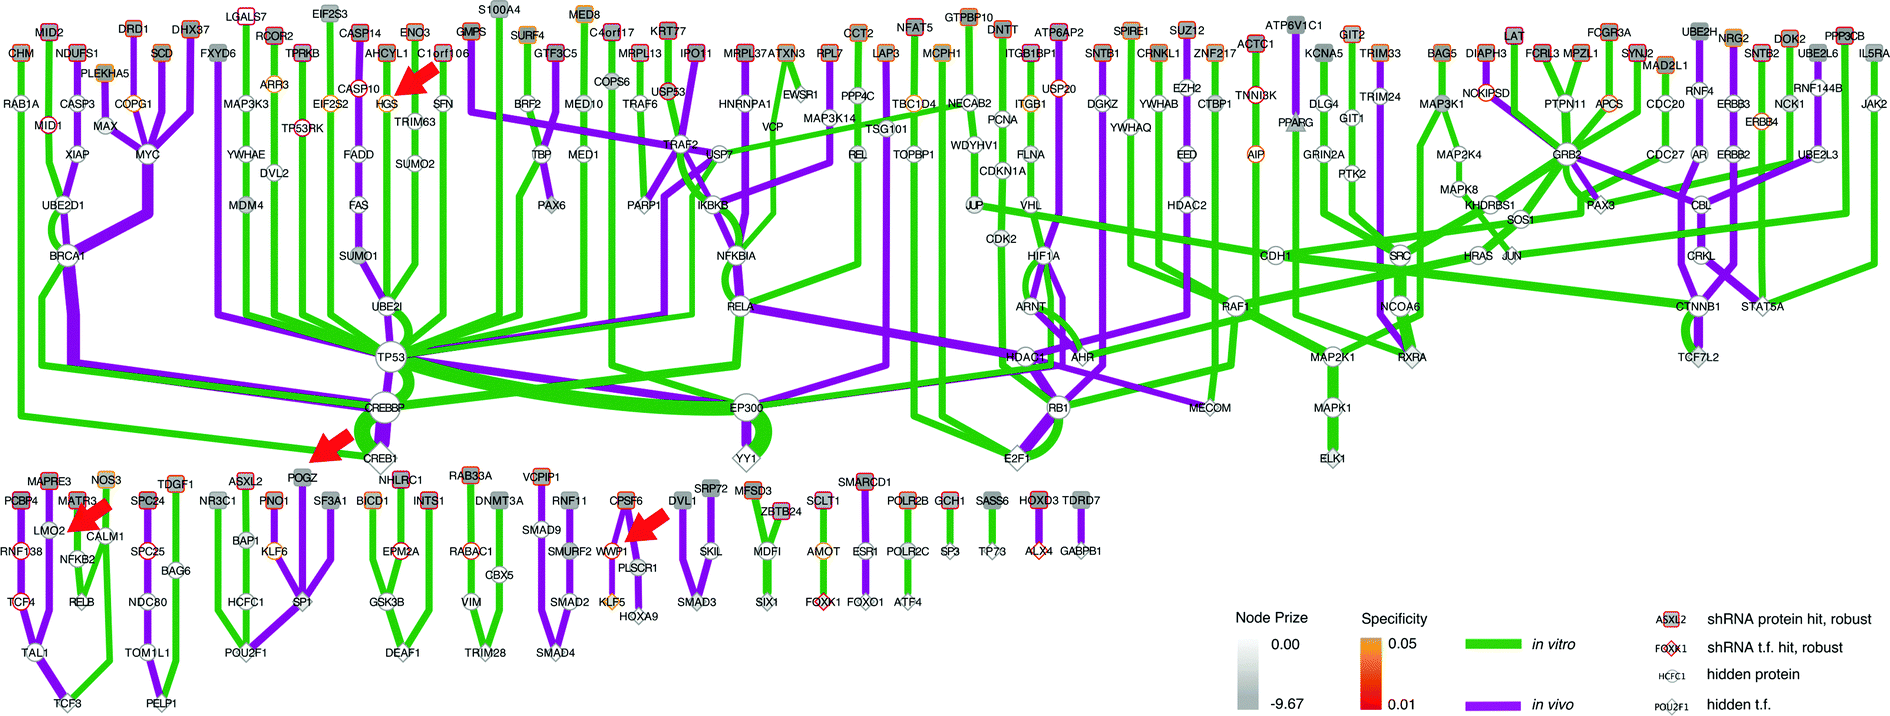 | ||
| Fig. 3 SAMNet identifies integrated network for ALL progression. The purple/green edges represent interactions from the in vivo/in vitro screens. RNAi hits are represented by a shaded square; the shading refers to the extent of depletion in the original screen. A diamond is a transcription factor selected by SAMNet; those that are shaded are also hits from the shRNA screen. All white-face nodes are hidden targets selected by the algorithm. Node border color represents fractional representation in a family of 100 random networks. Those without pink/orange border coloring are non-specific. The thickness of the interaction line represents the amount of flow captured by that interaction; qualitatively this reflects an edge with higher interaction confidence in the underlying interactome. Downstream mRNA pictured in Fig. 4. Red arrows indicate where Wwp1, Hgs, Lmo2, and Pogz exist within the network. A high-resolution image is available: http://fraenkel-nsf.csbi.mit.edu/psiquic/. | ||
A predicted transcription factor to DNA binding sub-network contains 84 nodes with 79 edges (Fig. 4); 41 nodes are transcription factors, and 43 nodes are differentially expressed mRNAs. This sub-network includes an additional 7 experimental genes from the RNAi input set; this yields a total of 40 transcription factors in the whole network, combining the two sub-networks. These 7 targets are transcription factors which had predicted connections to altered mRNAs, but did not have further connections to the protein–protein interaction network. This set of transcription factors comprises Tfdp1, Foxo6, Hmga2, Meis1, Myt1, Cebpa, and Klf3. Another identified transcription factor, Pparg, had connectivity both to the protein–protein interactome and directly to differential mRNA (Fig. 3 and 4).
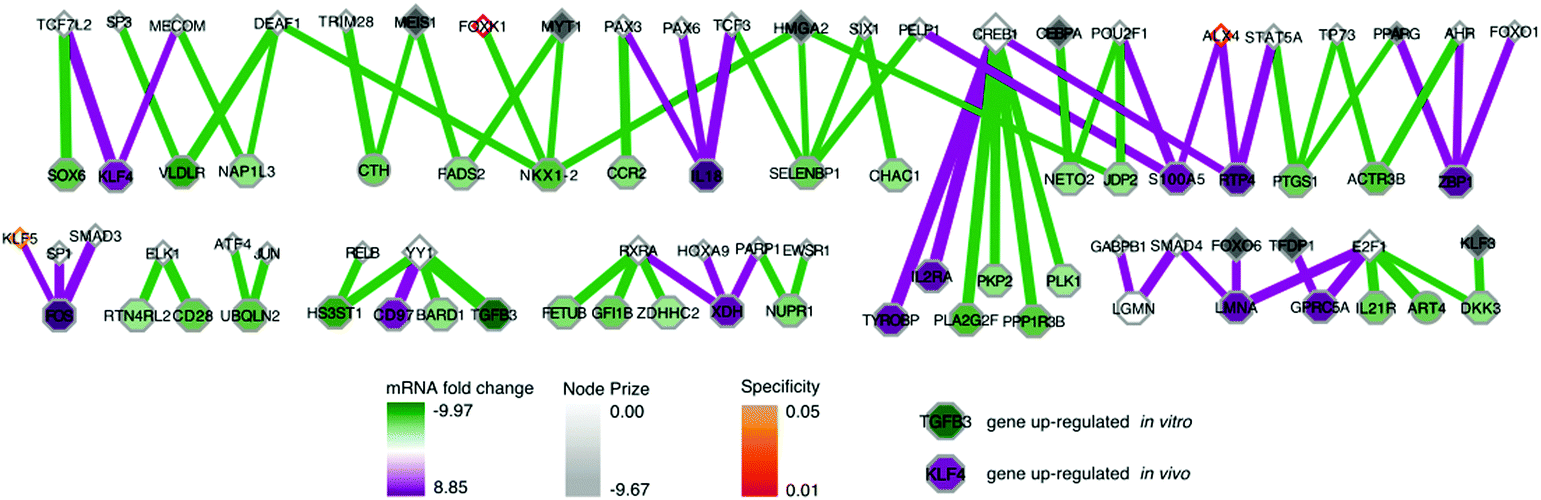 | ||
| Fig. 4 SAMNet selects transcription factors that explain genes with greatest differential expression. The transcription factors and differentially expressed genes are represented as triangles and octagons respectively. Grey shading on the transcription factors represents the extent of depletion in the original screen. Shading on the differentially expressed genes reflects either down-regulation (green) or up-regulation (purple) in the in vivo screen relative to the in vitro screen. The thickness of the interaction line represents the amount of flow captured by that interaction; qualitatively this reflects an edge with higher interaction confidence in the underlying interactome. Node border color represents fractional representation in a family of 100 random networks. Those without pink/orange border coloring are non-specific. A high-resolution image is available: http://fraenkel-nsf.csbi.mit.edu/psiquic/. | ||
Integrated approach finds genes connecting disparate data sets
This network further specifies interactions specific to either the in vivo or in vitro screen, as well as interactions common to both screens (Fig. 3 and 4). The network identified genes hits that connected the in vitro data (e.g. HGS, ARR, CASP10) or the in vivo data (e.g. CPSF6, WWP1, TCF4, KLF5, HOXA9), and genes that connected data from both screens (e.g. IKBKB, NFKBIA, RELA).We can also use the predicted genes identified by the algorithm to enhance the ability to identify known pathways using Gene Ontology (GO) functional enrichment statistics. Functional enrichment of the network genes compared to the whole genome identified GO processes distinct from those identified in the RNAi or mRNA expression data alone (Table 5). The processes include many associated with hematopoiesis including leukocyte homeostasis (q-value: 9.76 × 10⁻¹⁰), lymphocyte homeostasis (q-value: 1.67 × 10⁻⁹), regulation of leukocyte differentiation (q-value: 2.05 × 10⁻⁸), hemopoiesis (q-value: 4.16 × 10⁻⁸), and positive regulation of lymphocyte proliferation (q-value: 1.97 × 10⁻⁴). These processes included B-cell specific functions such as negative regulation of cell differentiation (q-value: 4.92 × 10⁻¹⁰) which reflect the undifferentiated state of B-cell leukemias.27 This set of GO processes also included functions associated with other hematopoietic progenitors, namely leukocytes. This enrichment occurs because genes with these annotations are shared among these two biological functions. 12 of the 13 genes annotated as having a role in leukocyte homeostasis are also involved in lymphocyte homeostasis. The enrichment analysis also identified pathways with known relationships to leukemias, if not specifically acute lymphoblastic leukemia. We address the potential significance of these pathways in the discussion.
| GO process | p-value | q-value | Enrichment | Genes |
|---|---|---|---|---|
| Transforming growth factor beta receptor signaling pathway | 1.27 × 10⁻¹² | 9.29 × 10⁻¹¹ | 13.76 (20822; 69; 307; 14) |
Fos, Parp1, Skil, Smad4, Tgfb3, Smad2, Smad9, Ptk2, Smad3, Trp53, Creb1, Jun, Map3k1, Src |
| Negative regulation of cell differentiation | 7.07 × 10⁻¹² | 4.92 × 10⁻¹⁰ | 3.89 (20822; 610; 307; 35) |
Med1, Hdac2, Vhl, Lmo2, Tcf7l2, Pparg, Hoxa9, Ptk2, Il18, Trp53, Foxo1, Jdp2, Apcs, Pkp2, Xdh, Itgb1, Vim, Ezh2, Erbb2, E2f1, Skil, Erbb4, Myc, Smad3, Hmga2, Meis1, Gsk3b, Itgb1bp1, Mapk1, Pax6, Suz12, Trp73, Ctnnb1, Stat5a, Nfkbia |
| Positive regulation of protein import into nucleus | 8.16 × 10⁻¹² | 5.65 × 10⁻¹⁰ | 3.00 (20822; 1084; 307; 48) |
Mcph1, Jak2, Med1, Plscr1, Pcna, Bag5, Map2k1, Vhl, Brca1, Pparg, Fadd, Hif1a, Crnkl1, Trp53, Foxo1, Trim28, Mdfi, Traf2, Gch1, Mecom, Atxn3, Ubqln2, Traf6, Atf4, Bag6, Xdh, Nck1, Zbp1, Klf4, Ccr2, Parp1, Skil, Epm2a, Dvl2, Myc, Smad3, Mapk1, Ppp4c, Trp73, Rela, Cd28, Il2ra, Map3k3, Stat5a, Map3k1, Map2k4, Nfkbia, Rab33a |
| Leukocyte homeostasis | 1.50 × 10⁻¹¹ | 9.76 × 10⁻¹⁰ | 13.16 (20822; 67; 307; 13) |
Ahr, Sos1, Fas, Lat, Skil, Ppp3cb, Hif1a, Fadd, Casp3, Ikbkb, Il2ra, Stat5a, Mecom |
| Lymphocyte homeostasis | 2.66 × 10⁻¹¹ | 1.67 × 10⁻⁹ | 14.53 (20822; 56; 307; 12) |
Sos1, Ikbkb, Ahr, Lat, Fas, Il2ra, Skil, Ppp3cb, Stat5a, Fadd, Hif1a, Casp3 |
| Regulation of leukocyte differentiation | 3.73 × 10⁻¹⁰ | 2.05 × 10⁻⁸ | 5.75 (20822; 236; 307; 20) |
Sos1, Fas, Ccr2, Erbb2, Fos, Fadd, Myc,Tal1, Creb1, Gfi1b, Jun, Apcs, Asxl2, Cd28, Il2ra, Ctnnb1, Rb1, Stat5a, Traf6, Tyrobp |
| Regulation of myeloid leukocyte differentiation | 4.13 × 10⁻¹⁰ | 2.24 × 10⁻⁸ | 9.13 (20822; 104; 307;14) |
Fos, Fadd, Myc, Tal1, Creb1, Gfi1b, Jun, Asxl2, Apcs, Ctnnb1, Rb1, Stat5a, Traf6, Tyrobp |
| Hemopoiesis | 7.79 × 10⁻¹⁰ | 4.16 × 10⁻⁸ | 8.71 (20822; 109; 307; 14) |
Jak2, Med1, Klf4, Ahr, Ccr2, Lmo2, Hif1a, Hoxa9, Meis1, Tal1, Sox6, Ctnnb1, Sp3, Sp1 |
| Positive regulation of chromosome organization | 4.45 × 10⁻⁹ | 2.13 × 10⁻⁷ | 8.48 (20822; 104; 307; 13) |
Brca1, Smad4, Eed, Trp53, Tal1, Plk1, Ctbp1, Jdp2, Gfi1b, Asxl2, Ctnnb1, Rb1, Ep300 |
| Positive regulation of myeloid leukocyte differentiation | 7.35 × 10⁻⁸ | 3.06 × 10⁻⁶ | 11.52 (20822; 53; 307; 9) |
Gfi1b, Jun, Fos, Asxl2, Rb1, Stat5a, Fadd, Traf6, Creb1 |
| Positive regulation of cytokine production | 7.47 × 10⁻⁸ | 3.10 × 10⁻⁶ | 4.21 (20822; 322; 307; 20) |
Jak2, 2Atp6ap2, Ccr2, Brca1, Fadd, Hif1a, Smad3, Il18, Creb1, Rela, Cd28, Rel, Traf2, Stat5a, Arnt, Hdac1, Traf6, Src, Atf4, |
| Regulation of apoptotic signaling pathway | 1.16 × 10⁻⁶ | 3.79 × 10⁻⁵ | 5.31 (20822; 166; 307; 13) |
Jak2, Plscr1, Nck1, Fas, Skil, Fadd, Mapk8, Smad3, Myc, Trp53, Gsk3b, Trp73, Traf2 |
| Myeloid cell development | 4.62 × 10⁻⁶ | 1.31 × 10⁻⁴ | 10.32 (20822; 46; 307; 7) |
Sox6, Med1, Ptpn11, Tal1, Meis1, Ep300, Src |
| Positive regulation of lymphocyte proliferation | 7.38 × 10⁻⁶ | 1.97 × 10⁻⁴ | 5.95 (20822; 114; 307; 10) |
Nck1, Ccr2, Cdkn1a, Cd28, Stat5a, Fadd, Traf6 |
| Regulation of Wnt signaling pathway | 3.49 × 10⁻⁵ | 7.84 × 10⁻⁴ | 3.88 (20810; 227; 307; 13) |
Hdac2, Cdh1, Atp6ap2, Tcf7l2, Dvl2, Smad3, Dkk3 Dvl1, Foxo1, Mdfi, Hdac1, Src, Xiap |
Predicted pathway contains genes contributing to ALL progression specifically in vivo and genes affecting B-cell viability
As initial evidence supporting the effective capabilities of our integrative pathways-based modeling approach, we note that the model predicts in vivo specific effects for Lmo2 and Pogz. These two targets have, in fact, been previously validated successfully.20 For additional evidence, we undertook here new dedicated experimental tests of predicted hidden genes selected from the model-determined ranking list (Table 6). From the ranked gene list (Table 6), we used in vivo competition assays to measure the effects of loss of these predicted genes on ALL progression.
|
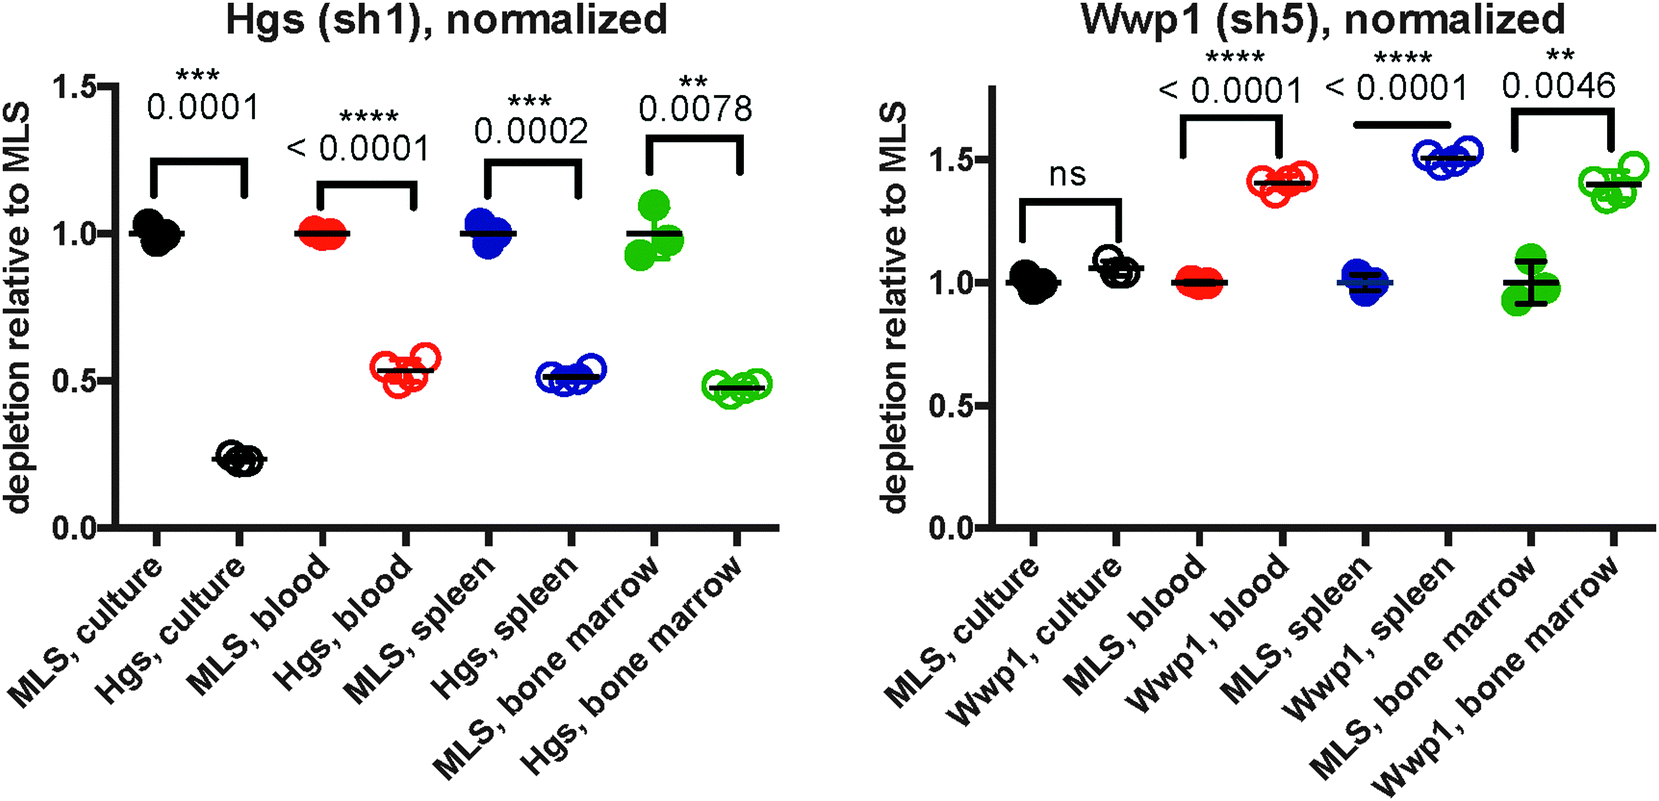 | ||
| Fig. 5 Validation shows in vitro and in vivo effects for Hgs and Wwp1. In the competition assays, we measure the relative abundances of pre-B-cells with and without an shRNA against our gene of interest either in culture or transplanted into mice. We measure relative proportions at the time of morbidity using FACS. All plots are mean ± S.D. For all samples, n = 3, except for Hgs, and Wwp1 tissue samples where n = 4. | ||
Hgs is a vesicular body-associated protein and was not included in our initial library screen. The model predicts that shRNAs targeting Hgs will deplete in vitro. In competition assays, an shRNA against Hgs depleted in culture, the blood, bone marrow, and spleen. The depletion in culture was greater than in all organs and was consistent with our model predictions (Fig. 5). These findings suggest that while Hgs confers a growth disadvantage to a pre-B-cell ALL, the in vivo environment mitigates the effect of Hgs loss. This may be due to growth factors or other paracrine signals that are relevant to hematological malignancies,19 direct cell-to-cell contact, disease compartmentalization, or many other factors unique to the in vivo environment.20
Wwp1, is a ubiquitin conjugating enzyme that was in our initial library, however the sequencing reads were below the limit of detection, suggesting a bad shRNA reagent. The model predicts that Wwp1 knockdown has an in vivo specific effect, and competition assays confirm this phenotype. shWwp1 enriches in the blood, bone marrow, and spleen (Fig. 5).
Discussion
Discovering pathways de novo by leveraging multiple ‘omics measurements can find latent information from functional genomic screens. We confirm the relevance of our model first through GO analysis. GO enrichment of the input RNAi and mRNA expression sets found no enrichment of relevant functions. This reaffirmed the disparate nature of individual data sets and suggested the possible value of an integrated approach. Further, we validated specific gene predictions from our network model. The model predicted an in vivo specific effect for Lmo2 and Pogz. They were functionally related to the very top gene targets as predicted by the pathway model, and were found to have in vivo specific effects through further validation. Hgs and Wwp1 were not included in the original screen analysis due to low sequencing coverage, yet the model predicted their relevance. Without such a model, they may never have been considered. Through focused validation, they both proved relevant to ALL progression.The model makes many predictions about genes with roles in development that have unclear roles in ALL. Many of these development-associated genes are implicated across leukemias, though degree of expression and directionality of their effects can be context dependent. Some transcription factors, such as TCF3, PAX5, IKZF1, and EBF1, are involved during many hematopoietic stages.28 Other network genes are characteristic of non-ALL leukemias. For instance, our network selects the transcription factor TCF4. This factor is up-regulated in the solid tumors of adult T-cell ALL patients29 but currently has an unknown roll in B-cell ALL, though it is highly expressed in this pre-B-cell ALL system. Additionally, functional enrichment identifies that network genes are enriched for the TGF-beta growth factor pathway process. Multiple leukemias, including chronic myelogenous (CML), acute T-cell leukemia (ATL), and ALL, express TGF-beta associated genes. Though, expression of TGF-beta components was higher in the T-cell leukemias than in the other leukemic cell lines30 and the ATL samples responded to exogenous TGF-beta. Further, TGF-beta and Foxo3a activity both promote the maintenance of leukemia-initiating cells in CML31 and loss of Foxo3a and TGF-beta inhibition better sensitized cells to Imatinib treatment. Clinically, patients with higher levels of TGF-beta are considered high-risk, as they often harbor additional mutations that prevent the tumor-suppressor roles of TGF-beta.32 The network also identifies the Wnt signaling pathway which is relevant in multiple hematological malignancies; specifically, stabilized beta-catenin is associated with differentiation arrest, is highly expressed in childhood T-cell ALL, and Wnt signaling can promote drug resistance.29,33–35 Hemopoiesis is governed by stage- and lineage-specific transcription factor regulation28,29 and finding relationships between differentiation and disease genes is valuable for understanding ALL generally. These predictions underscore our incomplete knowledge of this disease pathway. Additionally, specific network predictions are useful for translating therapeutic insight into ALL; specifically investigating TGF-beta and Wnt in ALL will inform research in therapeutics as these pathways have already been characterized in other leukemic contexts.
The network predictions about genes associated with B-cell development are relevant for interpreting therapeutic resistance. B-cell development pathways have been identified as hallmarks of drug-resistant leukemias and thus, therapeutic strategies promoting B-cell maturation show promise.17 Previous studies have also demonstrated the role of histone modification pathways in relapsed ALL; specifically CREBBP and CTCF, are mutated in these patients and may affect treatment response.36 The network confirms the relevance of CREBBP to pre-B-cell ALL, though, the model indicates that this gene is deleterious to B-cell viability and does not specifically modulate the response not specific to the in vivo environment. Identifying developmental pathways in ALL is not novel, but there is novelty in specifying which of these genes are deleterious for pre-B-cell growth and those that are deleterious in vivo.
We develop our model to select for context-specific interactions and can identify genes relevant to the in vitro or in vivo settings, or genes that are common to both. In the case of Hgs, the model predicts an in vitro specific effect. We demonstrate that Hgs loss confers a growth disadvantage in culture, blood, spleen, and bone marrow, but that this loss is most drastic in culture. This trend emphasizes the ability to distinguish genes relevant to the pre-B-cell model and those specifically responding to the cancer microenvironment. In the case of Hgs, loss of this gene is significant in culture, blood, spleen, and bone marrow, though our model predicts and confirms that this is not an effect specific to the tumor microenvironment. This framework is valuable as screening context (e.g. treatments or experimental environment) can affect which parts of a pathway are relevant. In our example, all genes in the model are predicted as part of the ALL pathway, but only a subset are relevant to ALL progression in vivo.
Hgs (Hrs) is a member of the ESCRT-0 family of proteins involved with multivesicular body (MVB) formation.37 This protein is involved with the internalization and degradation of activated cell-surface receptors38,39 and loss of Hrs is associated with increased accumulation of E-cadherin and decreased cell proliferation.38 Hrs is also essential for the termination of IL-6 signals by sorting gp130, a transducer of IL-6 stimulation, for endosomal degradation.40 Further, Hrs deficiency in mice decreased B-cell receptor expression; BCR expression is necessary for pre-B-cell expansion.39,41 The consequences of Hgs loss suggest that deficiencies in receptor internalization are deleterious to this type of pre-B-cell ALL.
The network predicts a novel role for Wwp1 in pre-B-cell ALL. Even though the network model was constructed using shRNAs that conferred a growth disadvantage, the model does not predict the directionality of effects for predicted genes. Validation experiments confirmed that Wwp1 had an in vivo specific effect, and that Wwp1 loss conferred a growth advantage. This enrichment is surprising because so far, most evidence suggests that Wwp1 is an oncogene; our competition assays suggests that in ALL, Wwp1 may have a tumor suppressor role. WWP1 is a member of the Nedd4 family of ubiquitin ligases, many of which are over-expressed in cancer.42 Many results suggest that WWP1 acts an oncogene by targeting tumor-suppressing proteins, such as LATS, for degradation. WWP1 is over-expressed in breast and prostate cancers, and seems to function in this oncogenic manner.43,44 Though, WWP1 also participates in a unique feedback loop with p53. Wwp1 stabilizes p53 protein in the cytoplasm, but decreases its expression, and in turn, p53 reduces the expression of Wwp1.45 This feedback loop is dependent upon p53 mutation status; mutated p53 abrogates this feedback dynamic leading to increased Wwp1 expression. In our pre-B-cell ALL, Wwp1 has relatively low expression and intact p53 suggesting an intact feedback loop. Loss of Wwp1 could lead to decreased p53 protein stability and enable interactions with other proteins. For instance, these cells express high levels of survivin (Birc5), which can prevent p53-mediated apoptosis in pediatric ALL.46
Off target effects are one of the largest criticisms of RNAi screens, yet even with these effects, we construct and validate a model for genes regulating ALL progression. We create this model with less than 100 input targets from each screen and find GO enrichment of genes related to leukemia and hematopoietic development. This demonstrates that the network filter is sufficiently powerful for analysis of screening data and that even stringent thresholds are sufficient for identifying genes relevant to a pathway. Further, we perform this analysis retroactively without controlling for OTEs or requiring specific negative controls, showing that RNAi analyses do not have to specifically compensate for OTEs. This suggests that even with limited and imperfect screening results, we can learn more from these screens, and that pathway discovery approaches are a viable path forward for the gene-interference community.
There are limitations associated with this approach. We have not yet made an estimate of validation rate for these network-based filters. To make this estimate, we would need to validate all genes in the network and determine the false positive rate. This method requires multiple datasets to create a possible network whereas other approaches require fewer input datasets. Some examples of tools that require a single input dataset include the Prize Collecting Steiner Forest (PCSF),47,48 TieDIE,49 and HOTNET.50,51 For a biologist, these tools could be easier to implement, but they lack the perspective gained by integrating multiple ‘omic measurements. Each ‘omic measurement captures a slightly different aspect of the cellular process under investigation, and so there are trade-offs between completeness and simplicity when selecting these tools.
Application of integration methods will improve understanding of gene-interference screens regardless of improvements in reagent design. CRISPR systems are more sensitive than RNAi and are better suited for discovering essential human genes.52,53 Though, both technologies are limited by biological compensation through alternative pathways or redundant proteins. Thus, adapting and applying interaction-based methods for data integration will continue to be of importance for functional genomic investigations. These integration methods can impact many biological problems beyond cancer investigations. To cite a few examples, RNAi screens are useful for uncovering synthetic lethal relationships,54 genes associated with homologous recombination,55 and genes responsible for ectodomain shedding.56 Many have promoted the value of data integration analysis methods,2,4,8,21 however, these analysis approaches remain under utilized in the gene interference community.
Materials and methods
shRNA screen, and data processing
The original shRNA screen and mRNA expression data are described previously.20 DESEQ2 size-factor normalized and calculated fold-changes for shRNA sequencing data. We ranked these fold-change values by p-value from DESEQ2.57 The GOrilla tool (http://cbl-gorilla.cs.technion.ac.il/)21,22 determined GO functional enrichment using the top 1% of differentially depleted shRNAs against the background of the whole mouse genome. GOrilla also determined functional enrichment of the top 1% of differentially expressed (up-regulated/down-regulated mRNAs for the in vivo/in vitro contexts) mRNAs against the background of the whole mouse genome.Cell culture and ChIP-seq
Pre-B-cell ALL cells58,59 were cultured as published.20 We performed ChIP assays as previously described.60 Briefly, 8.5 × 10⁶ pre-B-cells were cross-linked with 11% formaldehyde. Pellets were lysed and sonicated using the BioRuptor. Following sonication, activated DNA regions were immunoprecipitated using the following antibodies: K4me3 (Millipore Lot#1974075), K27Ac (Abcam Lot#GR1048521), and IgG (Millipore Lot#JBC17938060).Peak and valley finding
We used the MACS algorithm61 to identify peak regions 10k kb upstream of the transcription start site. Within these peak regions, we searched for valleys (local minima within peak regions) and then used these regions as inputs for potential transcription factor binding locations. The ChIP-seq data are available: GSE77570 (http://https://www.ncbi.nlm.nih.gov/geo/query/acc.cgi?acc=GSE77570). To discover valleys, we create a script that looks for local minima surrounding peaks in the H3K4me3 and H3K27Ac datasets. We use MACS61 to define significant peaks in each ChIP-seq data set and then define local minima between peaks. Our definition requires that a “minimum” region be less than half the height of the shorter of two neighboring peaks. This approach is motivated by the fact that transcriptional enhancers are more likely to bind in between histones and we needed these sequences to identify transcription factor motif regions. Previous work demonstrated that transcription factor binding is correlated with local minima in ChIP-seq data,62 and additional work has used these “dips” to look for enriched transcription factor motifs.63Interactome construction
We used Garnet to create transcription factor to DNA binding interactions. The Garnet package uses a weighted scoring function22 to determine which transcription factor motifs were the most likely to bind a set of Fasta sequences. For input, we used the valleys identified from our previously mentioned ChIP-seq data. The software is part of a suite of ‘omics integration tools (http://fraenkel.mit.edu/omicsintegrator).For our starting interaction network, we downloaded interactions from iRefWeb version 9 and we only kept interactions that mapped to UNIPROT reviewed human proteins. These interactions were scored using the miscore framework64 to create a probabilistically-weighted interactome. This score considers the number of publications, the type of interaction, and the evidence supporting the interaction. We discarded interactions with a score below 0.3. This yielded a starting network of 88117 interactions. The interactome is hosted on the Fraenkel Lab Website (http://fraenkel-nsf.csbi.mit.edu/psiquic/).
Simultaneous analysis of multiple networks (SAMNet)
We built the model using SAMNet.26 We used the top 1% of depleted shRNAs (for in vivo and in vitro), the top 1% differentially expressed mRNAs (up-regulated genes were assigned prizes for the in vivo context and down-regulated genes were assigned prizes for the in vitro context), the transcription factor to DNA binding interactions, and the weighted interactome as inputs to the algorithm. For simplicity, we mapped all mouse data to human gene symbols using homology. We used a gamma parameter of 17 as this was found to maximize the number of shRNA-targeted genes in the network. We again used GOrilla to determine the functional enrichment of the network, this time using the set of network nodes as a foreground against the background of the whole mouse genome.Randomizations and robustness analysis
For randomizations, we completed 100 runs of the algorithm at the same gamma parameter, but with the depletion and differential expression scores distributed to random sets of genes. We calculated node enrichment fraction, or specificity, by counting the number of times a node from the real network was selected in a random network. For further scoring and ranking, we used 1-specificity to keep all network parameters on a 0–1 scale. We used networkx in Python to determine the authority scores for network genes. SAMNet outputs the amount of flow converging on a gene. Our aggregate scoring method weighted each of these normalized values by the standard deviation of these metrics across all genes and was normalized to the sum of all metric standard deviations: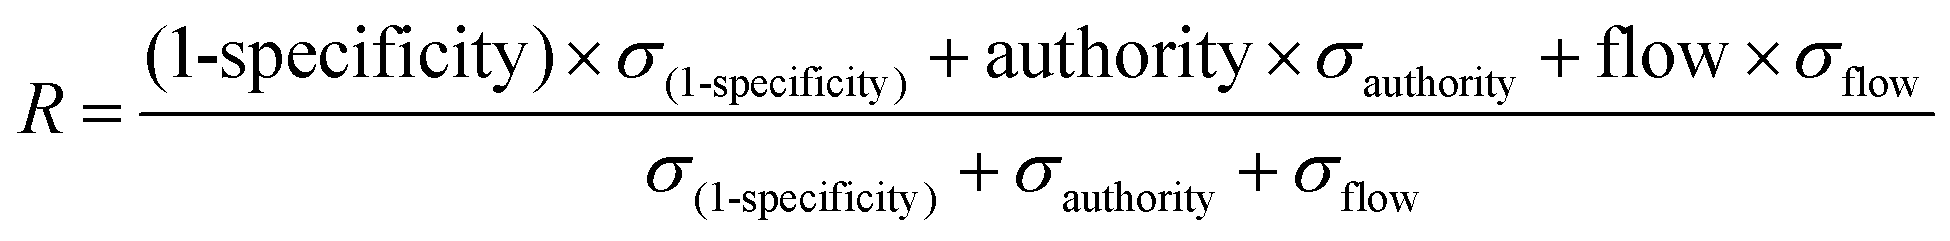
We completed this calculation separately for genes unique to in vivo/in vitro contexts and common between both contexts because common genes had two authority and flow scores. Because we designed the model to allow for multiple out-going connections from transcription factors but not from hidden genes and because phenotypic (shRNA) hits did not have incoming flow in the mode, we created separate rankings for transcription factors and phenotypic hits.
GFP competition assays
For model validation, we conducted parallel in vitro and in vivo GFP competition assays. We created shRNA constructs for Hgs and Wwp1, and infected pure populations of mCherry positive ALL cells as described.20 At the time of experiment, infected pre-B-cells were mixed 50:50 with mCherry positive ALL cells. From these populations, 100k cells were tail-vein injected into four 8-week-old, female C57BL6 mice, and 100k cells were plated in triplicate. Cultured populations were split 1:5 daily until mice reached morbidity (10–12 days following injection). At the time of morbidity, we collected blood, spleen, and bone marrow. For all in vivo and in vitro samples, we measure the %GFP of mCherry-labeled cells and calculated a fold-change relative to the 50:50 ratio at input. We normalized %GFP-fold-change to the MLS control for the respective tissue and used a t-test with Welch?s correction to determine significance. The sequences used for Hgs and Wwp1 shRNAs are CCAGAAACCACTTATATGTCTA and CTCCCTATTTTATACAGAGCAA. We tested shRNA knockdown using qPCR relative to Gapdh using Taqman expression assays. shHgs and shWwp1 left 23.28% and 67.64% mRNA remaining (Fig. S1, ESI†).
All experiments were performed in compliance with the relevant laws and institutional guidelines. Animal protocols were submitted to and approved by the MIT CRC. Animals were housed in compliance with the DCM policies for live subjects.
Author contributions
Douglas A. Lauffenburger (D. A. L.), Ernest Fraenkel (E. F.), Michael Hemann (M. H.), Sara Gosline (S. G.), Simona Dalin (S. D.), and Jennifer L. Wilson (J. L. W.). D. A. L., E. F., J. L. W., and S. G. designed the project; J. L. W. and S. D. performed research; E. F., D. A. L., M. H., and S. G., contributed new reagents/analytic tools; J. L. W. analyzed data; J. L. W. wrote the paper; and E. F., and D. A. L. supervised all aspects of the work.Availability of data and materials
The interactome dataset used for modeling is available on the Fraenkel Lab website, http://fraenkel-nsf.csbi.mit.edu/psiquic/.The ChIP-seq data are available in the GEO repository under identifier GSE77570, http://https://www.ncbi.nlm.nih.gov/geo/query/acc.cgi?acc=GSE77570.
An online version of our algorithm, SAMNetWeb,65 is available online (http://fraenkel-nsf.csbi.mit.edu/samnetweb/), and the full version is available on GitHub: http://https://github.com/sgosline/SAMNet. An archived version of the code used to create this manuscript is available on the Fraenkel Lab website, http://fraenkel-nsf.csbi.mit.edu/psiquic/.
List of abbreviations
| ALL | Acute lymphoblastic leukemia |
| GO | Gene ontology |
| OTE | Off-target effects |
| RNAi | RNA interference |
| SAMNet | Simultaneous analysis of multiple networks (algorithm) |
Funding
The work was supported by the NIH grants NIH Grant U01-CA155758, U54-CA112967 (D. A. L.), U01-CA184898 (E. F.), U01-CA155758 (M. H.), and NSF GRFP and Koch Graduate Fellowship (J. L. W.). Computing resources were partially supported by the National Science Foundation Grant DB1-0821391 and sequencing was partially supported by the National Institutes of Health Grant P30-ES002109.Acknowledgements
We acknowledge support from the Koch Flow Cytometry Core and express appreciation to Eleanor Fiedler, and the Biological Engineering Communication Lab for helpful discussion and support, Jordan Bartlebaugh, and Azucena (Susy) Ramos for experimental advice and guidance.References
- S. Mohr, C. Bakal and N. Perrimon, Annu. Rev. Biochem., 2010, 79, 37–64 CrossRef CAS PubMed.
- J. L. Wilson, M. T. Hemann, E. Fraenkel and D. A. Lauffenburger, Sem. Cancer. Biol., 2013, 23, 213–218 CrossRef CAS PubMed.
- M. Fennell, Q. Xiang, A. Hwang, C. Chen, C. H. Huang, C. C. Chen, R. Pelossof and R. J. Garippa, J. Biomol. Screening, 2014, 19, 1327–1337 CrossRef CAS PubMed.
- S. E. Mohr, J. A. Smith, C. E. Shamu, R. A. Neumüller and N. Perrimon, Nat. Rev. Mol. Cell Biol., 2014, 15, 591–600 CrossRef CAS PubMed.
- M. Boettcher and M. T. McManus, Mol. Cell, 2015, 575–585 CrossRef CAS PubMed.
- J. Taylor and S. Woodcock, J. Biomol. Screening, 2015, 20, 1040–1051 CrossRef CAS PubMed.
- A. L. Jackson and P. S. Linsley, Nat. Rev. Drug Discovery, 2010, 1–11 Search PubMed.
- F. D. Sigoillot, S. Lyman, J. F. Huckins, B. Adamson, E. Chung, B. Quattrochi and R. W. King, Nature, 2012, 9, 363–366 CAS.
- W. G. Kaelin, Science, 2012, 337, 421–422 CrossRef PubMed.
- A. L. Jackson, RNA, 2006, 12, 1197–1205 CrossRef CAS PubMed.
- A. Rapkiewicz, V. Espina, J. A. Zujewski, P. F. Lebowitz, A. Filie, J. Wulfkuhle, K. Camphausen, E. Petricoin, L. Liotta and A. Abati, Cancer, 2007, 111, 1–12 CrossRef PubMed.
- E. Buehler, A. A. Khan, S. Marine, M. Rajaram and A. Bahl, Sci. Rep., 2012, 1–6 Search PubMed.
- L. A. Gilbert, M. A. Horlbeck, B. Adamson, J. E. Villalta, Y. Chen, E. H. Whitehead, C. Guimaraes, B. Panning, H. L. Ploegh, M. C. Bassik, L. S. Qi, M. Kampmann and J. S. Weissman, Cell, 2014, 159, 647–661 CrossRef CAS PubMed.
- T. J. Cradick, E. J. Fine, C. J. Antico and G. Bao, Nucleic Acids Res., 2013, 1–9 Search PubMed.
- F. D. Bushman, N. Malani, J. Fernandes, I. D'Orso, G. Cagney, T. L. Diamond, H. Zhou, D. J. Hazuda, A. S. Espeseth, R. König, S. Bandyopadhyay, T. Ideker, S. P. Goff, N. J. Krogan, A. D. Frankel, J. A. T. Young and S. K. Chanda, PLoS Pathog., 2009, 5, e1000437 CrossRef PubMed.
- J. M. Rowe, Best Pract. Res., Clin. Haematol., 2015, 28, 69–72 CrossRef PubMed.
- J. A. E. Irving, Br. J. Haematol., 2015, 656–666 Search PubMed.
- T. Hideshima, C. Mitsiades, G. Tonon, P. G. Richardson and K. C. Anderson, Nat. Rev. Cancer, 2007, 7, 585–598 CrossRef CAS PubMed.
- L. A. Gilbert and M. T. Hemann, Genes Dev., 2012, 26, 1758–1768 CrossRef CAS PubMed.
- C. E. Meacham, L. N. Lawton, Y. M. Soto-Feliciano, J. R. Pritchard, B. A. Joughin, T. Ehrenberger, N. Fenouille, J. Zuber, R. T. Williams, R. A. Young and M. T. Hemann, Genes Dev., 2015, 29, 483–488 CrossRef CAS PubMed.
- E. Eden, D. Lipson, S. Yogev and Z. Yakhini, PLoS Comput. Biol., 2007, 3, e39 CrossRef PubMed.
- E. Eden, R. Navon, I. Steinfeld, D. Lipson and Z. Yakhini, BMC Bioinf., 2009, 10, 48 CrossRef PubMed.
- E. Yeger-Lotem, L. Riva, L. J. Su, A. D. Gitler, A. G. Cashikar, O. D. King, P. K. Auluck, M. L. Geddie, J. S. Valastyan, D. R. Karger, S. Lindquist and E. Fraenkel, Nat. Genet., 2009, 41, 316–323 CrossRef CAS PubMed.
- C. W. Ng, F. Yildirim, Y. S. Yap, S. Dalin, B. J. Matthews, P. J. Velez, A. Labadorf, D. E. Housman and E. Fraenkel, Proc. Natl. Acad. Sci. U. S. A., 2013, 1–6 Search PubMed.
- N. Tuncbag, S. J. C. Gosline, A. Kedaigle, A. R. Soltis, A. Gitter and E. Fraenkel, PLoS Comput. Biol., 2016, e1004879 CrossRef PubMed.
- S. Gosline, S. Spencer and E. Fraenkel, Integr. Biol., 2012, 1415–1427 RSC.
- C. Cobaleda and I. S. García, BioEssays, 2009, 600–609 CrossRef PubMed.
- R. Somasundaram, M. Prasad and J. Ungerbäck, Blood, 2015, 144–152 CrossRef CAS PubMed.
- O. H. Ng, Y. Erbilgin, S. Firtina, T. Celkan and Z. Karakas, Blood Cancer J., 2014, 1–8 Search PubMed.
- Y. Niitsu, Y. Urushizaki, Y. Koshida, K. Terui and K. Mahara, Blood, 2015, 1–5 Search PubMed.
- K. Naka, T. Hoshii, T. Muraguchi, Y. Tadokoro, T. Ooshio, Y. Kondo, S. Nakao, N. Motoyama and A. Hirao, Nature, 2010, 463, 676–680 CrossRef CAS PubMed.
- J. R. Downing, N. Engl. J. Med., 2004, 351, 528–530 CrossRef CAS PubMed.
- T. K. Fung, A. Leung and C. So, Stem Cells and Cancer Stem Cells, 2013 Search PubMed.
- W. Fiskus, S. Sharma, S. Saha, B. Shah, S. G. T. Devaraj, B. Sun, S. Horrigan, C. Leveque, Y. Zu, S. Iyer and K. N. Bhalla, Leukemia, 2014, 29, 1267–1278 CrossRef PubMed.
- E. Ashihara, T. Takada and T. Maekawa, Cancer Sci., 2015, 106, 665–671 CrossRef CAS PubMed.
- C. G. Mullighan, J. Zhang, L. H. Kasper, S. Lerach, D. Payne-Turner, L. A. Phillips, S. L. Heatley, L. Holmfeldt, J. R. Collins-Underwood, J. Ma, K. H. Buetow, C.-H. Pui, S. D. Baker, P. K. Brindle and J. R. Downing, Nature, 2011, 471, 235–239 CrossRef CAS PubMed.
- J. R. Edgar, E. R. Eden and C. E. Futter, Traffic, 2014, 197–211 CrossRef CAS PubMed.
- M. Toyoshima, N. Tanaka, J. Aoki, Y. Tanaka, K. Murata, M. Kyuuma, H. Kobayashi, N. Ishii, N. Yaegashi and K. Sugamura, Cancer Res., 2007, 67, 5162–5171 CrossRef CAS PubMed.
- T. Nagata, K. Murata, R. Murata, S.-L. Sun, Y. Saito, S. Yamaga, N. Tanaka, K. Tamai, K. Moriya, N. Kasai, K. Sugamura and N. Ishii, Biochem. Biophys. Res. Commun., 2014, 443, 351–356 CrossRef CAS PubMed.
- Y. Tanaka, N. Tanaka, Y. Saeki, K. Tanaka, M. Murakami, T. Hirano, N. Ishii and K. Sugamura, Mol. Cell. Biol., 2008, 28, 4805–4818 CrossRef CAS PubMed.
- M. Zhang, G. Srivastava and L. Lu, Cell. Mol. Immunol., 2004, 1, 89–94 CAS.
- C. Chen and L. E. Matesic, Cancer Metastasis Rev., 2007, 26, 587–604 CrossRef CAS PubMed.
- Z. Zhongmei, R. Liu and C. Chen, Int. J. Cancer, 2011, 130, 1504–1510 Search PubMed.
- B. Yeung, K.-C. Ho and X. Yang, PLoS One, 2013, 8, e61027 CrossRef CAS PubMed.
- A. Laine and Z. Ronai, Oncogene, 2006, 26, 1477–1483 CrossRef PubMed.
- J. W. Tyner, A. M. Jemal, M. Thayer, B. J. Druker and B. H. Chang, Leukemia, 2012, 623–632 CrossRef CAS PubMed.
- S.-S. C. Huang and E. Fraenkel, Sci. Signaling, 2009, 2, ra40 Search PubMed.
- N. Tuncbag, A. Braunstein, A. Pagnani, S.-S. C. Huang, J. Chayes, C. Borgs, R. Zecchina and E. Fraenkel, J. Comput. Biol., 2013, 20, 124–136 CrossRef CAS PubMed.
- E. O. Paull, D. E. Carlin, M. Niepel, P. K. Sorger, D. Haussler and J. M. Stuart, Bioinformatics, 2013, 29, 2757–2764 CrossRef CAS PubMed.
- F. Vandin, E. Upfal and B. J. Raphael, Lecture Notes in Computer Science, Springer Berlin Heidelberg, Berlin, Heidelberg, 2010, vol. 6044, pp. 506–521 Search PubMed.
- F. Vandin, E. Upfal and B. J. Raphael, J. Comput. Biol., 2011, 18, 507–522 CrossRef CAS PubMed.
- T. Hart, K. R. Brown, F. Sircoulomb, R. Rottapel and J. Moffat, Mol. Syst. Biol., 2014, 10, 733 CrossRef PubMed.
- T. Hart, M. Chandrashekhar, M. Aregger, Z. Steinhart, K. R. Brown, S. Angers and J. Moffat, Systematic discovery and classification of human cell line essential genes, 2015 Search PubMed.
- C. Scholl, S. Fröhling, I. F. Dunn, A. C. Schinzel, D. A. Barbie, S. Y. Kim, S. J. Silver, P. Tamayo, R. C. Wadlow, S. Ramaswamy, K. DOhner, L. Bullinger, P. Sandy, J. S. Boehm, D. E. Root, T. Jacks, W. C. Hahn and D. G. Gilliland, Cell, 2009, 137, 821–834 CrossRef CAS PubMed.
- B. Adamson, A. Smogorzewska, F. D. Sigoillot, R. W. King and S. J. Elledge, Nat. Cell Biol., 2012, 14, 318–328 CrossRef CAS PubMed.
- M. Dang, K. Dubbin, A. D'Aiello, M. Hartmann, H. Lodish and A. Herrlich, J. Biol. Chem., 2011, 286, 17704–17713 CrossRef CAS PubMed.
- S. Anders and W. Huber, Genome Biol., 2010, 11, R106 CrossRef CAS PubMed.
- R. T. Williams, M. F. Roussel and C. J. Sherr, Proc. Natl. Acad. Sci. U. S. A., 2006, 103, 6688–6693 CrossRef CAS PubMed.
- R. T. Williams, W. den Besten and C. J. Sherr, Genes Dev., 2007, 21, 2283–2287 CrossRef CAS PubMed.
- K. D. MacIsaac and E. Fraenkel, Computational Biology of Transcription Factor, 2010 Search PubMed.
- J. Feng, T. Liu and Y. Zhang, Current Protocols in Bioinformatics, 2011 Search PubMed.
- S. A. Ramsey, T. A. Knijnenburg, K. A. Kennedy, D. E. Zak, M. Gilchrist, E. S. Gold, C. D. Johnson, A. E. Lampano, V. Litvak, G. Navarro, T. Stolyar, A. Aderem and I. Shmulevich, Bioinformatics, 2010, 26, 2071–2075 CrossRef CAS PubMed.
- J. A. Wamstad, J. M. Alexander, R. M. Truty and A. Shrikumar, Cell, 2012, 206–220 CrossRef CAS PubMed.
- J. M. Villaveces, R. C. Jimenez, P. Porras, N. del-Toro, M. Duesbury, M. Dumousseau, S. Orchard, H. Choi, P. Ping, N. C. Zong, M. Askenazi, B. H. Habermann and H. Hermjakob, Database, 2015, 2015, bau131 CrossRef PubMed.
- S. Gosline, C. Oh and E. Fraenkel, Bioinformatics, 2015, 1124–1126 CrossRef CAS PubMed.
Footnote |
| † Electronic supplementary information (ESI) available. See DOI: 10.1039/c6ib00040a |
| This journal is © The Royal Society of Chemistry 2016 |