 Open Access Article
Creative Commons Attribution 3.0 Unported Licence
Methionine sulfoxide profiling of milk proteins to assess the influence of lipids on protein oxidation in milk
Johannes
Wüst
and
Monika
Pischetsrieder
*
Food Chemistry Unit, Department of Chemistry and Pharmacy, Emil Fischer Center, Friedrich-Alexander Universität Erlangen-Nürnberg (FAU), Schuhstr. 19, 91052 Erlangen, Germany. E-mail: monika.pischetsrieder@fau.de; Tel: +49-9131-8524102
First published on 23rd February 2016
Abstract
Thermal treatment of milk and milk products leads to protein oxidation, mainly the formation of methionine sulfoxide. Reactive oxygen species, responsible for the oxidation, can be generated by Maillard reaction, autoxidation of sugars, or lipid peroxidation. The present study investigated the influence of milk fat on methionine oxidation in milk. For this purpose, quantitative methionine sulfoxide profiling of all ten methionine residues of β-lactoglobulin, α-lactalbumin, and αs1-casein was carried out by ultrahigh-performance liquid chromatography–electrospray ionization tandem mass spectrometry with scheduled multiple reaction monitoring (UHPLC–ESI–MS/MS–sMRM). Analysis of defatted and regular raw milk samples after heating for up to 8 min at 120 °C and analysis of ultrahigh-temperature milk samples with 0.1%, 1.5%, and 3.5% fat revealed that methionine oxidation of the five residues of the whey proteins and of residues M 123, M 135, and M 196 of αs1-casein was not affected or even suppressed in the presence of milk fat. Only the oxidation of residues M 54 and M 60 of αs1-casein was promoted by lipids. In evaporated milk samples, formation of methionine sulfoxide was hardly influenced by the fat content of the samples. Thus, it can be concluded that lipid oxidation products are not the major cause of methionine oxidation in milk.
Introduction
Milk has been a basic component of the human diet for thousands of years.1 Before consumption, milk is usually heated to ensure microbial safety and to prolong shelf-life. However, thermal treatment such as pasteurization (at 72–75 °C for 15–20 s), ultrahigh-temperature heating (at 135–150 °C for 1–2 s) or sterilization (at ≥110 °C for 10–30 min) leads to numerous chemical modifications of milk proteins and other components.2 In this context, the Maillard reaction between milk proteins and lactose plays an important role: protein-bound amino groups, mainly the ε-amino groups of lysine residues, react with the aldehyde group of the reducing sugar lactose to form lactulosyllysine (“Amadori product”).3 Further oxidation, degradation and/or rearrangement reactions form a wide range of products, the advanced glycation end products (AGEs).4 Apart from glycation products, protein oxidation products are important modifications in heated milk, which arise when amino acids like methionine, cysteine, histidine, and tryptophan are oxidized.5–8 Among those, protein-bound methionine residues can be easily oxidized to methionine sulfoxide by reactive oxygen species, either by two- (e.g. hydrogen peroxide) or one-electron transfer (e.g. hydroxyl radicals).9 In commercial milk products, like evaporated milk, conversion rates of methionine to methionine sulfoxide of up to 9% were measured and reached even up to 60% in whey protein concentrate.6 Further oxidation to methionine sulfone is observed to a much lesser extent.10 Methionine is a relatively non-polar amino acid residue and is, therefore, often located in hydrophobic regions of the tertiary protein structure.11 Formation of methionine sulfoxide thus results in a considerable increase of hydrophilicity of the side chain and consequently in disruption of protein conformation.12 As a result, numerous examples have been described, where methionine oxidation leads to a substantial loss of protein function via changes of protein conformation.11 Hence, conformational changes of milk proteins may lead, for example, to changes in emulsifying properties,13 dispersibility,14 gelling properties,15 enzymatic activity,11 or vitamin binding.16 Apart from conformational changes, methionine oxidation may also have more severe consequences on protein integrity by enhancing peptide backbone cleavage.17The different thermally induced degradation reactions do not occur in isolation, but are heavily interrelated. Therefore, effects cannot be considered separately, but rather in the context of the complex food composition. It is well established, for example, that oxidation reactions promote AGE formation, while protein oxidation is also enhanced by other food components, such as sugars.18,19 Reactive oxygen species, which are responsible for the formation of methionine sulfoxide, can be generated by Maillard reaction, autoxidation of sugars, or lipid peroxidation.20 Oxidation of unsaturated fatty acids, for example, seems to play an important role in protein oxidation. Several studies reported that lipid peroxides are able to oxidize protein-bound methionine residues to methionine sulfoxide.21–25 Brock et al. demonstrated by an incubation experiment with glucose or arachidonic acid that methionine in ribonuclease A was oxidized to a greater extent during lipid oxidation than during glycoxidation reactions.20 The influence of fat on protein oxidation was also shown by one study, which reported an increase of protein oxidation in beef patties with higher fat content.26
In a previous study, diverse commercial milk products were analyzed by ultrahigh-performance liquid chromatography–electrospray ionization tandem mass spectrometry (UHPLC–ESI–MS/MS) to monitor the site-specific reaction kinetics of β-lactoglobulin modifications, including the formation of methionine sulfoxide.27 Coffee cream with a lipid content of 10–12% showed four- to ninefold higher methionine oxidation indices than evaporated milk with lipid contents between 3–7.5%. Moreover, evaporated milk products with higher lipid content tended to have higher methionine oxidation indices. A possible explanation for these findings could be the generation of reactive oxygen species by lipid peroxidation that stimulated the formation of methionine sulfoxide.27 Therefore, the goal of the present study was to investigate how protein oxidation -evaluated as methionine sulfoxide- in heated milk and different milk products is influenced by lipids. Comprehensive quantitative profiling of methionine sulfoxide formation in three milk proteins, αs1-casein and the two whey proteins α-lactalbumin and β-lactoglobulin, was performed by UHPLC–ESI–MS/MS. To investigate the impact of fat on methionine oxidation, the developed scheduled multiple reaction monitoring method (sMRM) was applied to raw milk after heating with or without milk fat, and to commercial milk products, namely ultrahigh-temperature (UHT) milk and evaporated milk, with various fat contents.
Experimental
Materials
Acetonitrile (LC-MS Chromasolv), formic acid (eluent additive for LC-MS), disodium phosphate (purum p.a.), monosodium phosphate (purum p.a), β-lactoglobulin variant A/B (from bovine milk, ≥85%), α-lactalbumin (from bovine milk, type III, calcium depleted, ≥85%), and α-casein (from bovine milk, minimum 70% αs-casein) were purchased from Sigma-Aldrich (Taufkirchen, Germany). Sodium chloride was obtained from VWR Chemicals (Darmstadt, Germany), hydrogen peroxide (30%) from Solvay GmbH (Hannover, Germany), 1,4-dithiothreitol (DTT, ≥99%) from Roth (Karlsruhe, Germany) and endoproteinase GluC from Roche (Mannheim, Germany). Ultrapure water was used for all experiments (18.2 MΩ cm resistivity).Preparation of oxidized milk proteins
To prepare model proteins with high contents of methionine sulfoxide, α-lactalbumin and α-casein were incubated with hydrogen peroxide. Forced oxidation of β-lactoglobulin was not necessary because all methionine residues in the β-lactoglobulin standard were already partially oxidized. For oxidation, solutions of, respectively, 9.9 mg of α-lactalbumin or 10.4 mg of α-casein in 7.5 ml of phosphate-buffered saline (PBS, 10 mM sodium phosphate, 8 mM sodium chloride, pH 6.8) were heated with 16 mM hydrogen peroxide in an autoclave (Systec V-65, Linden, Germany) at 121 °C for 30 min with a pressure of 98.5 kPa. Subsequently the proteins were dialyzed for 6 h against water (molecular weight cutoff 8000–10![[thin space (1/6-em)]](https://www.rsc.org/images/entities/char_2009.gif) 000 Da, volume ratio 1
000 Da, volume ratio 1![[thin space (1/6-em)]](https://www.rsc.org/images/entities/char_2009.gif) :
:![[thin space (1/6-em)]](https://www.rsc.org/images/entities/char_2009.gif) 200, water was replaced three times) and then lyophilized.
200, water was replaced three times) and then lyophilized.
Milk samples
Bovine raw milk, pooled from 12 Fleckvieh dairy cows with an average age of 7 years, was provided by a local farmer directly after milking and was immediately cooled on ice. Evaporated milk with fat contents of 4% (n = 3), 7.5% (n = 3), and 10% (n = 3) as well as UHT milk with fat contents of 0.1% (n = 2), 1.5% (n = 3), and 3.5% (n = 3) were obtained from local supermarkets. The samples were analyzed directly after purchase. Milk samples were defatted twice by centrifugation in a Hettich Universal 32 R centrifuge (Tuttlingen, Germany) for 60 min at 3850 g and 4 °C. Then the upper fat layer was carefully removed with a spatula. Small amounts of remaining lipids had no noticeable impact on chromatography, enzymatic hydrolysis, or mass analysis. Defatted milk samples were further processed directly after defatting.Heating of raw milk
Aliquots of 0.5 ml of defatted or not defatted raw milk were pipetted into aluminum boxes closed with a screw cap. The boxes were placed into a preheated, sand-filled container. Within the container, samples were heated for 0, 1, 2, 4, 6, and 8 min in an oven at 120 °C. This setup ensured constant temperatures in the samples even when the oven door was opened. After heating, the milk samples were immediately cooled on ice. Afterwards, the fat-containing milk samples were defatted as described above. All heating experiments and the subsequent enzymatic hydrolysis were performed in triplicate.Specific enzymatic hydrolysis
Aliquots of 25 μl (400 μM) of oxidized α-lactalbumin and α-casein, or the β-lactoglobulin standard were transferred to Eppendorf tubes and specifically hydrolyzed by addition of 75 μl of endoproteinase GluC (0.08 μg μl−1 in 25 mM phosphate buffer, pH 7.8). The tubes were kept for 16 h at 37 °C in an Eppendorf thermomixer. Hydrolyzed proteins were reduced by adding 10 μl of 1 M DTT. After incubation at room temperature for 30 min, 890 μl of water was added. The addition of formic acid to a final concentration of 0.2% stopped the enzymatic reaction. Finally, the samples were filtered through a PVDF filter (0.22 μm, Roth, Karlsruhe, Germany). Before injection into UHPLC–MS/MS, the hydrolyzed β-lactoglobulin and α-lactalbumin samples were both diluted 1![[thin space (1/6-em)]](https://www.rsc.org/images/entities/char_2009.gif) :
:![[thin space (1/6-em)]](https://www.rsc.org/images/entities/char_2009.gif) 1 with water, the α-casein sample was diluted 1
1 with water, the α-casein sample was diluted 1![[thin space (1/6-em)]](https://www.rsc.org/images/entities/char_2009.gif) :
:![[thin space (1/6-em)]](https://www.rsc.org/images/entities/char_2009.gif) 5.
5.
Aliquots of 6.25 μl of the milk samples were put into plastic tubes and were reduced by adding 23.75 μl of water and 2.5 μl of DTT (0.2 M). Following 30 min of incubation at room temperature, 17.5 μl of endoproteinase GluC (0.2 μg μl−1) was added. The tubes were shaken in an Eppendorf thermomixer for 16 h at 37 °C. Afterwards, 2.5 μl of DTT (1 M) was added. After 30 min of incubation at room temperature, 195 μl of water and 2.5 μl of formic acid (20%) were added. Before injection, the samples were filtered (0.22 μm, PVDF). Because methionine residues are easily oxidized, e.g. by air during sample preparation, it is important that all samples were handled in exactly the same way during the heating experiments and subsequent sample preparation.9,28–30
Methionine sulfoxide profiling by UHPLC–ESI–MS/MS
LC–MS/MS experiments were carried out with an Ultimate 3000 UHPLC system (Dionex, Idstein, Germany), coupled to an 4000 QTRAP mass spectrometer, equipped with an ESI source (both AB Sciex, Foster City, CA, USA).Hydrolyzed proteins were separated on a C18 column (Waters Acquity UPLC BEH 300; 2.1 × 100 mm, 1.7 μm) at a flow rate of 0.3 ml min−1, using the following gradient with 0.1% formic acid as eluent A and acetonitrile as eluent B: 0 min 1.5% B; 5 min 1.5% B; 55 min 42.5% B, 55.5 min 95% B, 60 min 95% B. Prior to each injection, the system was equilibrated for 6 min using a mixture of 98.5% A and 1.5% B. The LC-column was operated at 30 °C and the injection volume was 10 μl. The LC flow was directed into the mass spectrometer from min 1.3–55. All MS experiments were carried out in positive mode. The ESI-source was held at 500 °C with ion spray voltage of 5000 V and nitrogen as drying gas. The curtain gas was set to 50 psig and heating gas to 75 psig. For the identification of peptides containing methionine sulfoxide, the hydrolyzed proteins were first analyzed using enhanced mass spectrum (EMS) scans with the following parameters: scan range 300–1200 m/z, scan rate 1000 Da s−1, declustering potential 50 V, collision energy 10 eV, collision-activated dissociation (CAD) gas high, dynamic fill time on. The enhanced resolution (ER) scans were then acquired within a range of 30 Da from the target mass with a scan rate of 250 Da s−1. Fragmentation spectra were obtained by enhanced product ion (EPI) scans. In this mode, the precursor ion is selected in Q1 with the resolution unit, fragmented into the fragment ions by CAD in the collision cell Q2 and then captured in ion trap and subsequently scanned out. Following parameters were applied: collision energy depending on the peptide mass, scan rate 1000 Da s−1, scan range depending on the mass of precursor ion, dynamic fill time on. Other parameters were the same as in EMS mode. The development of a MRM method was based on the results of the acquired EPI spectra. One quantifier and three qualifiers were chosen for each peptide. By injecting solutions of the hydrolyzed proteins, the MS parameters collision energy and declustering potential were optimized by Skyline optimization tool (64-bit, 2.5.0.6157, MacCoss Lab at the University of Washington, Seattle, WA, USA) for each single quantifier and qualifier. The collision energy of each transition, which had been suggested by Skyline, was further optimized experimentally to gain maximum peak area of the fragment ion so that maximal signal-to-noise-ratio was achieved. Because the declustering potential had only negligible influence on the peak areas of the fragment ions, this parameter was not further experimentally optimized, but the values proposed by Skyline were used for the MRM method. For sMRM, the resolution of Q1 and Q3 was set to unit with a detection window of 60 s. The target scan time was set to 1.0 s.
Calculation of modification indices
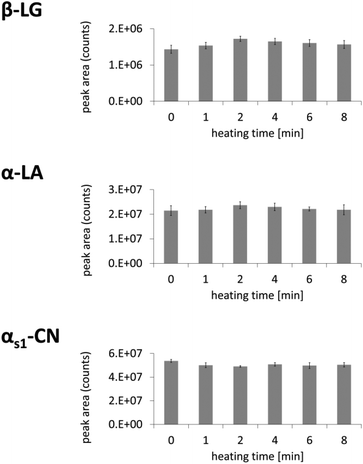
The extracted ion chromatograms (EICs) of MRM runs were used to calculate the modification indices for methionine sulfoxide:Signal integration was performed with Analyst 1.5.1 (AB Sciex) to obtain the areas of extracted ion chromatograms. Peptide AA 159–162 (QCHI) from β-lactoglobulin was used as internal standard for oxidized peptides of β-lactoglobulin, as reported in literature.27 Peptide AA 8–11 (VFRE) from α-lactalbumin and peptide AA 15–18 (VLNE) from αs1-casein served as internal standard peptides for oxidized peptides of α-lactalbumin or αs1-casein, respectively. No significant increase of signal areas of these three peptides could be observed when raw milk was heated for 8 min at 120 °C (Fig. 1).
Statistical analysis and spectrum interpretation
The significance of differences was calculated by the unpaired, two-tailed Student's t-test for homoscedastic or heteroscedastic distribution using Microsoft Excel 2013. Variance homogeneity was tested with an F-test. A p-value < 0.05 was considered to be significant. For spectra interpretation, BioAnalyst software (version 1.5) and mMass (version 5.4.0) were used.Results and discussion
Methionine sulfoxide has already been identified and quantified in milk5,6,27,31,32 indicating that it represents a good marker to assess the degree of protein oxidation. Goal of the present study was to investigate on the basis of methionine sulfoxide determination how protein oxidation in heated milk and various milk products is influenced by lipids. Since different milk proteins and also different binding sites may be affected differently by oxidation,27,33 a UHPLC–ESI–MS/MS method was developed for comprehensive profiling of methionine sulfoxide in three different milk proteins: αs1-casein, α-lactalbumin, and β-lactoglobulin. Thus, effects become evident, which may not be covered when the overall methionine sulfoxide content was analyzed. For this purpose, specific enzymatic hydrolysis was carried out prior to mass spectrometric analysis. Afterwards, site-specific relative quantification of all peptides containing methionine sulfoxide was performed by UHPLC–ESI–MS/MS in sMRM mode in raw milk after heating either with or without milk fat and in dairy products (UHT milk, evaporated milk) with different fat contents.Methionine sulfoxide profiling
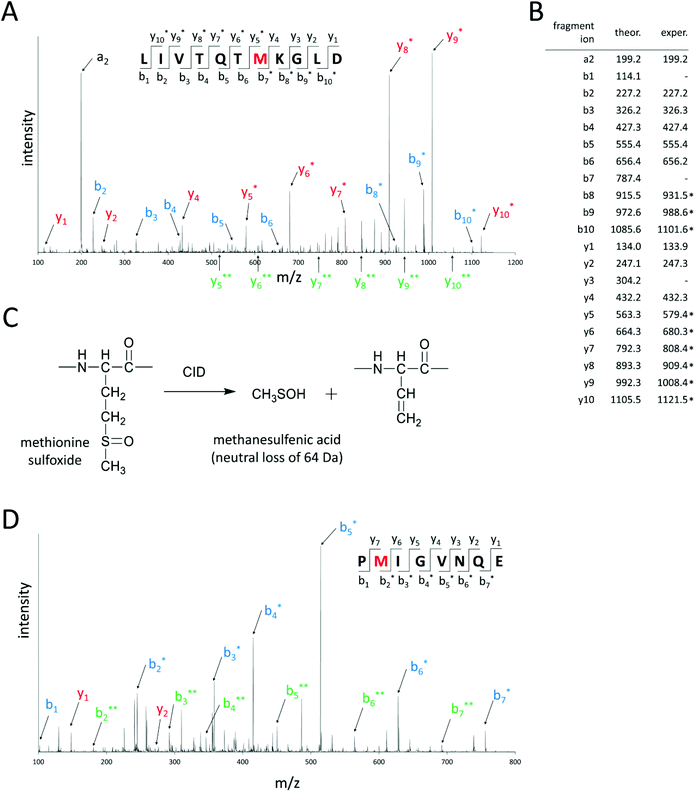
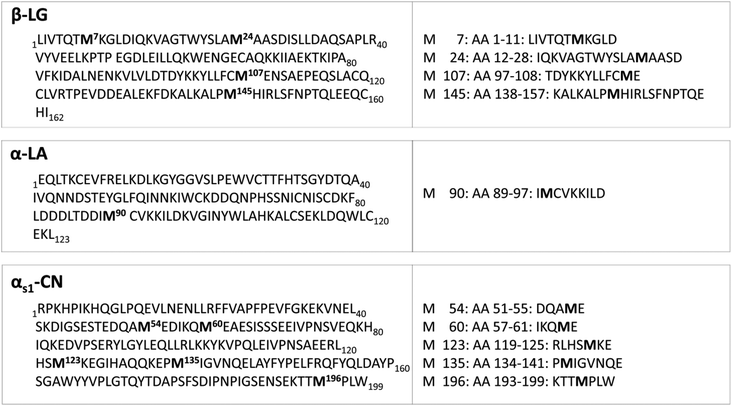
For methionine sulfoxide profiling, first in-silico hydrolysis of the target proteins by endoproteinase GluC was performed. Only peptides that contained one methionine residue and had maximal one missed cleavage site were considered for further analysis. The masses of these unmodified (“native”) peptides were increased by 16.0 Da, because this mass shift is characteristic for peptides bearing one methionine sulfoxide in their amino acid sequences. In this way, a set of predicted peptides containing methionine sulfoxide was obtained that could be used for further analysis. In the next step, oxidized model proteins were prepared by heating αs1-casein and α-lactalbumin with hydrogen peroxide for 30 min at 120 °C to force the oxidation of methionine residues. The β-lactoglobulin standard was already sufficiently oxidized so that further treatment with hydrogen peroxide was not necessary. These model proteins were enzymatically hydrolyzed by endoproteinase GluC. The resulting peptide mixture was then chromatographically separated and analyzed by UHPLC–ESI–MS/MS in different mass spectrometric scan modes. First, EMS scans were recorded for a rapid overview of all peptides present in the analyzed samples. Signals of predicted methionine sulfoxide-containing peptides were searched in the corresponding extracted ion chromatograms of the acquired EMS. If a matching peak could be detected, the identity of the predicted peptide was further confirmed by its monoisotopic mass and charge state. For this purpose, ER scans were acquired to obtain a better mass resolution than in the EMS scan. Besides methionine residues, peptides containing other oxidable amino acids like histidine, tryptophan, and proline can also display a mass shift of Δm = +16.0 Da due to the formation of hydroxytryptophan (tryptophan), γ-glutamic semialdehyde (proline), or 2-oxo-histidine (histidine).34 Therefore, MS/MS experiments were performed in the EPI scan mode and the localization of methionine sulfoxide in the amino acid sequence was confirmed. Fig. 2 exemplifies the EPI spectra of peptide AA 1–11 of β-lactoglobulin, where methionine 7 is oxidized to methionine sulfoxide and peptide AA 134–141 of αs1-casein, which bears methionine sulfoxide at M 135. The EPI scan of Fig. 2A reveals that methionine 7 of this peptide was oxidized, because b-fragment ions 1–6 and y-fragment ions 1–4 were detected with their native masses, whereas b-fragment ions 7–10 and y-fragment ions 5–10 were shifted by Δm = +16.0 Da. The fragmentation of methionine sulfoxide-containing peptides in collision induced dissociation additionally resulted in a neutral loss of 64.0 Da from precursor and/or fragment ions (Fig. 2C). This neutral loss of 64 Da, which is very characteristic for the loss of methanesulfenic acid (CH3SOH) in proteins and peptides,9,28 further confirmed the presence of methionine sulfoxide in the corresponding amino acid sequence.Fig. 3 shows the amino acid sequences of the three investigated milk proteins. β-Lactoglobulin contains four methionine residues, (M 7, M 24, M 107, and M 145), α-lactalbumin only one (M 90), and αs1-casein five methionine residues (M 54, M 60, M 123, M 135, and M 196). UHPLC–ESI–MS/MS analysis revealed methionine sulfoxide formation at all ten methionine residues of the three oxidized model proteins (Fig. 3). Thus, the newly developed method was suitable to generate a comprehensive overview of the degrees of methionine oxidation in heated milk and different milk products. Since it was expected that the oxidized peptides were present in milk in low concentrations, a sensitive sMRM method for the analysis of all oxidized methionine-containing peptides was developed. During sMRM, the respective transitions of every peptide are recorded in a relatively narrow retention time window, which provides increased sensitivity compared to standard MRM methods. The established sMRM method with all transitions, optimized collision energies and declustering potentials is displayed in Table 1. Semi-quantification of methionine sulfoxide-containing peptides was performed by normalizing the peak area of the extracted ion chromatogram of the oxidized peptides to an internal standard peptide, which was released during enzymatic hydrolysis of the same protein, but was not affected by heating (Fig. 1). This quantification approach has already been successfully applied in previous studies.27,35 Normalization also compensates for differences in the mass spectrometric performance during different runs and for differences in protein concentrations between the various milk products.27
| Protein | Amino acid | Sequence | Localization | Retention time (min) | Precursor (z) | Fragment ion | CE (eV) | DP (V) | |
|---|---|---|---|---|---|---|---|---|---|
| β-LG | 1–11 | LIVTQTMKGLD | M 7 | 22.8 | 617.8(2) | Quant. | 1008.5 (y9*) | 31 | 68 |
| 617.8(2) | Quali. | 680.3 (y6*) | 31 | 68 | |||||
| 617.8(2) | Quali. | 909.4 (y8*) | 31 | 68 | |||||
| 617.8(2) | Quali. | 988.5 (b9*) | 29 | 68 | |||||
| β-LG | 12–28 | IQKVAGTWYSLAMAASD | M 24 | 32.5 | 914.4(2) | Quant. | 1047.6 (b9) | 41.9 | 105.8 |
| 914.4(2) | Quali. | 510.2 (y5*) | 41.9 | 105.8 | |||||
| 914.4(2) | Quali. | 1247.7 (b11) | 41.9 | 105.8 | |||||
| 914.4(2) | Quali. | 1318.7 (b12) | 41.9 | 105.8 | |||||
| β-LG | 97–108 | TDYKKYLLFCME | M 107 | 33.6 | 785.4(2) | Quant. | 1025.6 (b8) | 42.5 | 88.4 |
| 785.4(2) | Quali. | 545.2 (y4) | 40.5 | 88.4 | |||||
| 785.4(2) | Quali. | 912.4 (b7) | 42.5 | 88.4 | |||||
| 785.4(2) | Quali. | 1172.6 (b9) | 38.5 | 88.4 | |||||
| β-LG | 138–157 | KALKALPMHIRLSFNPTQE | M 145 | 31.8 | 581.6(4) | Quant. | 688.3 (b18*; z = 3) | 21.5 | 57.5 |
| 581.6(4) | Quali. | 869.0 (b15*; z = 2) | 31.1 | 57.5 | |||||
| 581.6(4) | Quali. | 968.0 (b17*; z = 2) | 25.1 | 57.5 | |||||
| 581.6(4) | Quali. | 1032.0 (b18*; z = 2) | 25.1 | 57.5 | |||||
| β-LG | 159–162 | QCHI | Internal standard | 11.9 | 250.6(2) | Quant. | 269.2 (y2) | 18 | 41.4 |
| 250.6(2) | Quali. | 372.2 (y3) | 18 | 41.4 | |||||
| 250.6(2) | Quali. | 369.1 (b3) | 14 | 41.4 | |||||
| α-LA | 89–97 | IMCVKKILD | M 90 | 22.6 | 539.8(2) | Quant. | 818.5 (y7) | 30 | 70.5 |
| 539.8(2) | Quali. | 719.4 (b6*) | 34 | 70.5 | |||||
| 539.8(2) | Quali. | 832.5 (b7*) | 30 | 70.5 | |||||
| 539.8(2) | Quali. | 965.5 (y8*) | 26.5 | 70.5 | |||||
| α-LA | 8–11 | VFRE | Internal standard | 12.8 | 275.7(2) | Quant. | 451.2 (y3) | 18 | 51.2 |
| 275.7(2) | Quali. | 219.0 (a2) | 16 | 51.2 | |||||
| 275.7(2) | Quali. | 304.2 (y2) | 18 | 51.2 | |||||
| 275.7(2) | Quali. | 403.2 (b3) | 14 | 51.2 | |||||
| αs1-CN | 51–55 | DQAME | M 54 | 1.8 | 609.2(1) | Quant. | 366.1 (y3*) | 33 | 75.5 |
| 609.2(1) | Quali. | 244.1 (b2) | 45 | 75.5 | |||||
| 609.2(1) | Quali. | 295.1 (y2*) | 37 | 75.5 | |||||
| 609.2(1) | Quali. | 315.1 (b3) | 39 | 75.5 | |||||
| αs1-CN | 57–61 | IKQME | M 60 | 3.0 | 332.7(2) | Quant. | 551.2 (y4*) | 20 | 55.4 |
| 332.7(2) | Quali. | 370.2 (b3) | 24 | 55.4 | |||||
| 332.7(2) | Quali. | 423.2 (y3*) | 18 | 55.4 | |||||
| 332.7(2) | Quali. | 487.3 (y4* –64 Da) | 18 | 55.4 | |||||
| αs1-CN | 119–125 | RLHSMKE | M 123 | 1.6 | 458.7(2) | Quant. | 407.2 (b3) | 31 | 64.6 |
| 458.7(2) | Quali. | 494.3 (b4) | 33 | 64.6 | |||||
| 458.7(2) | Quali. | 577.3 (b5* –64 Da) | 33 | 64.6 | |||||
| 458.7(2) | Quali. | 641.3 (b5) | 27 | 64.6 | |||||
| αs1-CN | 134–141 | PMIGVNQE | M 135 | 18.3 | 452.2(2) | Quant. | 514.3 (b5*) | 19.5 | 64.1 |
| 452.2(2) | Quali. | 358.2 (b3*) | 25.5 | 64.1 | |||||
| 452.2(2) | Quali. | 415.2 (b4*) | 29.5 | 64.1 | |||||
| 452.2(2) | Quali. | 628.3 (b6*) | 21.5 | 64.1 | |||||
| αs1-CN | 193–199 | KTTMPLW | M 196 | 25.5 | 446.7(2) | Quant. | 688.4 (b6*) | 19.5 | 63.7 |
| 446.7(2) | Quali. | 415.2 (y3) | 19.5 | 63.7 | |||||
| 446.7(2) | Quali. | 478.2 (b4*) | 25.5 | 63.7 | |||||
| 446.7(2) | Quali. | 575.3 (b5*) | 25.5 | 63.7 | |||||
| αs1-CN | 15–18 | VLNE | Internal standard | 11.4 | 474.2(1) | Quant. | 262.1 (y2) | 26 | 65.7 |
| 474.2(1) | Quali. | 213.2 (b2) | 30 | 65.7 | |||||
| 474.2(1) | Quali. | 327.2 (b3) | 24 | 65.7 | |||||
| 474.2(1) | Quali. | 375.2 (y3) | 28 | 65.7 |
Influence of lipids on methionine oxidation
To investigate the influence of lipids on the formation of methionine sulfoxide in milk, aliquots of defatted and fat-containing raw milk were heated at 120 °C. Methionine sulfoxide profiling was subsequently performed by UHPLC–ESI–MS/MS in sMRM mode.In a first experiment, raw milk was heated either with or without milk fat up to 2 min at 120 °C. In contrast to heated milk, unheated raw milk showed significantly higher modification indices of methionine sulfoxide (data not shown). This observation could be explained by enzymatic processes that take place in raw milk during sample workup. The enzyme lactoperoxidase, a member of the peroxidase family, is naturally present in milk.36 This enzyme prevents the growth of bacteria by catalyzing the conversion of thiocyanate (SCN−) to the antibacterial hypothiocyanate (OSCN−) in the presence of hydrogen peroxide.37 Allen et al. further demonstrated that the addition of lactoperoxidase to a milk model system led to increased lipid oxidation.38 Ostdal et al. reported that radicals, which are formed from lactoperoxidase during its reaction with hydrogen peroxide can be transferred to milk proteins such as β-lactoglobulin and caseins.39 Thus, methionine residues in milk proteins could react with these radicals to methionine sulfoxide. Marks et al. demonstrated that the enzyme was still active during normal pasteurization (72 °C for 15 s),40 whereas heating at 80 °C for 4 s inactivated the enzyme.41 In our experiments, raw milk was heated for up to 2 min at 120 °C. It can be assumed that the combined influence of temperature and time inactivated lactoperoxidase during thermal treatment. Thus, enzymatic oxidation of methionine did not continue during the following sample workup, whereas lactoperoxidase activity in unheated raw milk might lead to the artificial formation of methionine sulfoxide. Therefore, unheated raw milk was excluded from further analysis.
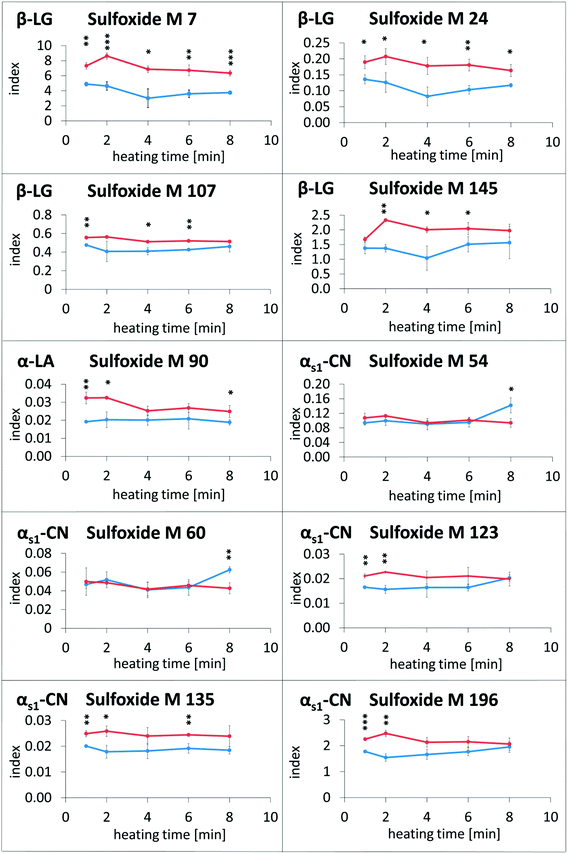
In the next experiments, defatted and fat-containing raw milk samples were heated for up to 8 min at 120 °C and subsequently analyzed by the LC–MS method. The results are displayed in Fig. 4. No clear tendency could be observed towards higher modification indices of methionine sulfoxide with increasing heat exposure (except for M 54 and M 60 in αs1-casein in fatty milk after 6 min of heating). These results are in good agreement with a previous study, which investigated the reaction kinetics of methionine sulfoxide of β-lactoglobulin in milk.27 Thus, methionine sulfoxide formation seems to be only weakly dependent on the duration of thermal impact. Therefore, divergent levels of methionine sulfoxide in different milk products may be caused by other production parameters than heating time.
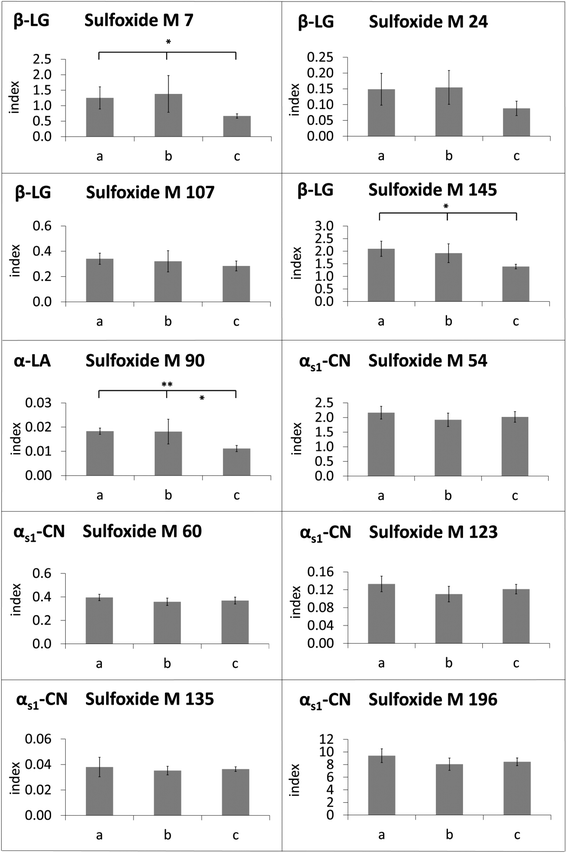
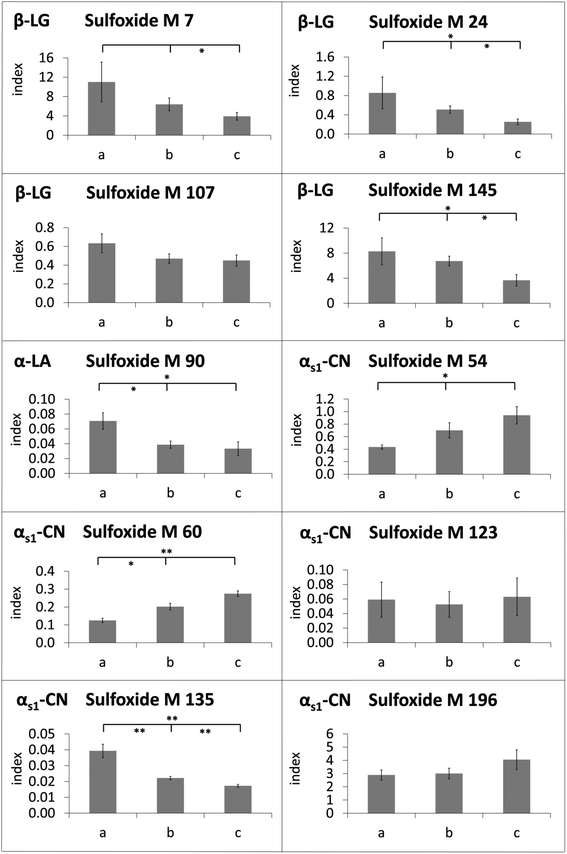
The modification indices of methionine sulfoxide in heated lipid-containing milk were lower than or in the same range as the modification indices in defatted milk (Fig. 4). Only in two cases, namely for methionine sulfoxide at M 54 and M 60 of αs1-casein in the milk heated for 8 min, the modification indices were significantly increased in the presence of milk fat compared to the defatted milk. In contrast, methionine residues M 7, M 24, M 107, and M 145 of β-lactoglobulin, M 90 of α-lactalbumin, and M 135 of αs1-casein, for example, showed higher oxidation rates in the absence of fat during the whole, or almost the whole heating period. The observed effect may be considered as an artefact resulting from sample preparation, when the residual oxidation could proceed during the defatting step. However, a very similar picture was obtained, when evaporated milk samples with different fat contents of 4%, 7.5%, and 10% (Fig. 5) or UHT milk samples with different fat content (Fig. 6) were analyzed. The methionine residues M 7, M 24, M 107, M 145, M 90, and M 135, which seemed to be protected in the heating experiments by the presence of lipids, also showed significantly lower oxidation rates or at least a corresponding trend in commercial milk samples with increasing fat content.
Surprisingly, the methionine residues of αs1-casein displayed partially different behavior. Oxidation of M 135 was reduced in the heating experiments as well as in the UHT milk samples in the presence of fat. The formation of methionine sulfoxide at M 123 and M 196 was also less pronounced as a result of laboratory heating, but not affected in UHT milk samples with varying fat contents. In contrast, M 54 and M 60, which were the only residues with significantly elevated oxidation index in the presence of fat after prolonged heating, were also more heavily modified in UHT milk samples with higher fat content.
Conclusion
Overall, it can be concluded from the present results that (i) methionine oxidation is only marginally related to the heating duration, so that enhanced modification rates in some commercial products are probably caused by other production parameters than duration of thermal treatment. (ii) Protein modification behavior depends to some extent on protein structure and also on the location of respective amino acids in the protein, so that general conclusions are difficult to draw and site-specific analysis is necessary to reveal reaction mechanisms. (iii) In the heated raw milk samples as well as in the commercial UHT samples, fat rather exerted protective than promoting effects on methionine oxidation. In evaporated milk samples, the fat content hardly affected methionine oxidation. A previous study showed that processing conditions of evaporated milk in general led to considerably lower methionine oxidation compared to other milk products,27 so that the influence of lipids may be of minor relevance. (iv) Lipid oxidation products are apparently not the major oxidants that attack methionine residues.Acknowledgements
The graduate scholarship by Universität Bayern e.V. (to J.W.) is gratefully acknowledged. Furthermore, we thank Christine Meissner for proofreading the manuscript.References
- J. N. de Wit, J. Dairy Sci., 1998, 81, 597–606 CrossRef CAS PubMed.
- G. Moatsou, in Milk and Dairy Products in Human Nutrition, ed. Y. W. Park and G. F. Haenlein, John Wiley & Sons, Oxford, 2013, pp. 288–309 Search PubMed.
- M. A. J. S. van Boekel, Food Chem., 1998, 62, 403–414 CrossRef CAS.
- S. Arena, A. M. Salzano, G. Renzone, C. D'Ambrosio and A. Scaloni, Mass Spectrom. Rev., 2014, 33, 49–77 CrossRef CAS PubMed.
- J. Meltretter, C. M. Becker and M. Pischetsrieder, J. Agric. Food Chem., 2008, 56, 5165–5171 CrossRef CAS PubMed.
- J. H. Baxter, C. S. Lai, R. R. Phillips, L. Dowlati, J. J. Chio, S. T. Luebbers, S. R. Dimler and P. W. Johns, J. Chromatogr. A, 2007, 1157, 10–16 CrossRef CAS PubMed.
- S. Guedes, R. Vitorino, M. R. Domingues, F. Amado and P. Domingues, Anal. Bioanal. Chem., 2010, 397, 1985–1995 CrossRef CAS PubMed.
- B. S. Berlett and E. R. Stadtman, J. Biol. Chem., 1997, 272, 20313–20316 CrossRef CAS PubMed.
- B. Ghesquiere and K. Gevaert, Mass Spectrom. Rev., 2014, 33, 147–156 CrossRef CAS PubMed.
- W. Vogt, Free Radical Biol. Med., 1995, 18, 93–105 CrossRef CAS PubMed.
- M. J. Davies, Biochim. Biophys. Acta, 2005, 1703, 93–109 CrossRef CAS PubMed.
- C. C. Chao, Y. S. Ma and E. R. Stadtman, Proc. Natl. Acad. Sci. U. S. A., 1997, 94, 2969–2974 CrossRef CAS.
- L. Ye, Y. Liao, W. Sun and M. Zhao, CYTA – J. Food, 2015, 13, 49–55 CrossRef CAS.
- D. Scheidegger, P. M. Radici, V. A. Vergara-Roig, N. S. Bosio, S. F. Pesce, R. P. Pecora, J. C. P. Romano and S. C. Kivatinitz, J. Dairy Sci., 2013, 96, 3414–3423 CrossRef CAS PubMed.
- H. D. Belitz, W. Grosch and P. Schieberle, Food Chemistry, Springer, Berlin Heidelberg, 2009 Search PubMed.
- M. D. Perez and M. Calvo, J. Dairy Sci., 1995, 78, 978–988 CrossRef CAS PubMed.
- M. Hellwig, K. Lobmann and T. Orywol, J. Pept. Sci., 2015, 21, 17–23 CrossRef CAS PubMed.
- R. Nagai, K. Ikeda, T. Higashi, H. Sano, Y. Jinnouchi, T. Araki and S. Horiuchi, Biochem. Biophys. Res. Commun., 1997, 234, 167–172 CrossRef CAS PubMed.
- J. Meltretter, S. Seeber, A. Humeny, C. M. Becker and M. Pischetsrieder, J. Agric. Food Chem., 2007, 55, 6096–6103 CrossRef CAS PubMed.
- J. W. Brock, J. M. Ames, S. R. Thorpe and J. W. Baynes, Arch. Biochem. Biophys., 2007, 457, 170–176 CrossRef CAS PubMed.
- V. Mohsenin and J. L. Gee, J. Appl. Physiol., 1989, 66, 2211–2215 CrossRef CAS PubMed.
- H. K. Nielsen, P. A. Finot and R. F. Hurrell, Br. J. Nutr., 1985, 53, 75–86 CrossRef CAS PubMed.
- B. Garner, A. R. Waldeck, P. K. Witting, K. A. Rye and R. Stocker, J. Biol. Chem., 1998, 273, 6088–6095 CrossRef CAS PubMed.
- B. Garner, P. K. Witting, A. R. Waldeck, J. K. Christison, M. Raftery and R. Stocker, J. Biol. Chem., 1998, 273, 6080–6087 CrossRef CAS PubMed.
- R. Mashima, S. Yoshimura and Y. Yamamoto, Biochem. Biophys. Res. Commun., 1999, 259, 185–189 CrossRef CAS PubMed.
- M. Utrera, D. Morcuende and M. Estévez, Lebensm. – Wiss. Technol., 2014, 56, 62–68 CrossRef CAS.
- J. Meltretter, J. Wust and M. Pischetsrieder, J. Agric. Food Chem., 2014, 62, 10903–10915 CrossRef CAS PubMed.
- Z. Guan, N. A. Yates and R. Bakhtiar, J. Am. Soc. Mass Spectrom., 2003, 14, 605–613 CrossRef CAS PubMed.
- I. Verrastro, S. Pasha, K. T. Jensen, A. R. Pitt and C. M. Spickett, Biomolecules, 2015, 5, 378–411 CrossRef CAS PubMed.
- Y. W. Lao, M. Gungormusler-Yilmaz, S. Shuvo, T. Verbeke, V. Spicer and O. V. Krokhin, J. Proteomics, 2015, 125, 131–139 CrossRef CAS PubMed.
- J. Meltretter, J. Wust and M. Pischetsrieder, J. Agric. Food Chem., 2013, 61, 6971–6981 CrossRef CAS PubMed.
- G. Renzone, S. Arena and A. Scaloni, J. Proteomics, 2015, 117, 12–23 CrossRef CAS PubMed.
- B. Meyer, F. Baum, G. Vollmer and M. Pischetsrieder, J. Agric. Food Chem., 2012, 60, 7306–7311 CrossRef CAS PubMed.
- T. Koivumaki, G. Gurbuz, M. Poutanen and M. Heinonen, J. Agric. Food Chem., 2012, 60, 6799–6805 CrossRef CAS PubMed.
- J. W. Brock, D. J. Hinton, W. E. Cotham, T. O. Metz, S. R. Thorpe, J. W. Baynes and J. M. Ames, J. Proteome Res., 2003, 2, 506–513 CrossRef CAS PubMed.
- M. Sisecioglu, E. Kirecci, M. Cankage, H. Ozdemir, H. Gulcin and A. Atasever, Afr. J. Pharm. Pharmacol., 2010, 4, 671–677 CAS.
- S. S. Shariat, N. Jafari, N. Tavakoli and R. B. Najafi, Res. Pharm. Sci., 2015, 10, 152–160 Search PubMed.
- J. C. Allen and W. L. Wrieden, J. Dairy Res., 1982, 49, 239–248 CrossRef CAS.
- H. Ostdal, M. J. Bjerrum, J. A. Pedersen and H. J. Andersen, J. Agric. Food Chem., 2000, 48, 3939–3944 CrossRef CAS PubMed.
- N. E. Marks, A. S. Grandison and M. J. Lewis, J. Appl. Microbiol., 2001, 91, 735–741 CrossRef CAS PubMed.
- E. Seifu, E. M. Buys and E. F. Donkin, Trends Food Sci. Technol., 2005, 16, 137–154 CrossRef CAS.
| This journal is © The Royal Society of Chemistry 2016 |


