DOI:
10.1039/C5FO00841G
(Paper)
Food Funct., 2016,
7, 425-433
Mulberry anthocyanin extract regulates glucose metabolism by promotion of glycogen synthesis and reduction of gluconeogenesis in human HepG2 cells†
Received
12th July 2015
, Accepted 27th September 2015
First published on 29th September 2015
Abstract
Mulberry has been demonstrated to possess important biological activities such as antioxidation and antiinflammation. However, research on the ability of mulberry for diabetes improvement mainly focuses on the leaves and less on the fruit. This study showed that a mulberry anthocyanin extract (MAE) had a significant effect on increasing the glucose consumption in HepG2 cells. The MAE enhanced the glycogen content and suppressed levels of glucose production. The enzyme activities of phosphoenolpyruvate carboxykinase (PEPCK) and glucose-6-phosphatase (G6Pase) were decreased in HepG2 cells after MAE treatment due to PPARγ coactivator 1α (PGC-1α) and forkhead box protein O1 (FOXO1) inhibition. Moreover, the phosphorylation of protein kinase B (AKT) and glycogen synthase kinase-3β (GSK-3β) was increased by the MAE, leading to an expression enhancement of glycogen synthase 2 (GYS2). And this effect was blocked by the phosphoinositide 3-kinase (PI3K) inhibitor LY294002. In summary, our results suggested that the MAE regulates glucose metabolism by activating the PI3K/AKT pathway that relates to glycogen synthesis as well as through the inhibition of key molecules that promote gluconeogenesis.
Introduction
Diabetes is a chronic disease and it is rapidly emerging as a global health challenge in the 21st century with the improvement in the world's living standards.1 Therefore, there is an urgent need to look for programs for inhibiting the growing incidence of diabetes.
Considering the adverse effects of antidiabetic drugs, using natural products from fruits and vegetables as preventive or therapeutic interventions for metabolic syndrome has drawn extensive attention because of their non-toxicity and beneficial health effects. Many phytochemicals have been demonstrated to exhibit anti-diabetic activity in different experimental models. Tetrastigma, rosemary and litchi pulp extracts were discovered to cause the enhancement of the glucose consumption rate in HepG2 cells.2–4 Cocoa flavonoids are also found to improve insulin signaling through AKT and AMPK modulation and attenuate a high glucose-induced insulin signaling blockade in HepG2 cells.5,6 Furthermore, it has been discovered that cyanidin 3-glucoside (C3G), which is the most widespread anthocyanin in nature, ameliorates hyperglycemia and insulin sensitivity in type 2 diabetic mice.7
Mulberry as a kind of traditional Chinese plant has been reported to possess many pharmacological effects. Much of the research suggested that mulberry shows great antioxidant activity in vitro because the deep colored fruit is rich in phenolic compounds including flavonoids and anthocyanins.8 In addition, a significant increase in antioxidant capacity is found in the plasma of Wistar rats that are orally administered anthocyanin-rich extract from wild mulberry, implying that the ingestion of anthocyanins is responsible for an elevated level of some antioxidant compounds in the blood.9 The free radical scavenging ability of mulberry resulted in many benefits such as liver protection, antiinflammation, anticancer action and so on in both cultured cells and animal models. Recent research also has focused on its anti-obesity effect. Chang et al.10 indicated the hypolipidemic effects of mulberry anthocyanin extracts (MAEs) on oleic acid induced HepG2 cells and Wu et al.11 also illustrated that a diet supplemented with MAEs could protect against body weight gain in high fat diet-induced mice. Their various functions such as a protective effect on the liver and an anti-obesity effect may reduce the risk for type 2 diabetes.12,13 Mulberry leaf exhibits remarkable hypoglycemic-like effects because it contains appreciable active components. 1-Deoxynojirimycin (DNJ) isolated from mulberry leaves was discovered to be an α-glycosidase inhibitor, exhibiting an effective inhibition of various carbohydrate-degrading enzymes. Meanwhile, polysaccharides from the plants have been reported to be useful in improving damaged pancreatic islets and β-cell function.14 Although it is generally accepted that mulberry leaves have an obvious effectiveness on diabetes improvement, concentration is less on the fruit.8,15,16 There are a few researchers reporting that C3G from mulberry fruit showed a protection of erectile function in diabetes mellitus rats and H2O2-induced cell death in pancreatic β-cells.17,18 However, the precise hypoglycemic effect of mulberry anthocyanins and the mechanisms related to glucose metabolism in the liver remain largely unclear.
In this study, we firstly purified anthocyanins from the fresh fruits of mulberry and then aimed to investigate the effect of mulberry anthocyanins on glucose regulation in the liver as well as the possible mechanisms involved by using HepG2 cells as a model.
Materials and methods
Extraction and purification of anthocyanins from mulberry
500 g of fresh mulberries (Morus alba L., purchased from a local fruit market in Hangzhou) were subjected to extraction with a 3-fold volume of 95% ethanol containing 1% HCl for 24 h at 4 °C. The combined extract was filtrated to remove the slurry and evaporated at 38 °C to remove the solvent. Then the remaining extract was loaded onto an equilibrated Amberlite XAD-7 column (having been cleaned in 1 M HCl solution) and orderly eluted with 1% formic acid in methanol.11 The filtrate was evaporated at 38 °C again and lyophilized to obtain the MAE and stored at −80 °C before use.
Evaluation of the main composition of MAE
The total phenols were determined according to the Folin–Ciocalteu method.19 Gallic acid was used as a standard and the data were represented in the form of mg of gallic acid equivalent (GAE) per g of dry powder. The total flavonoids were measured by the aluminum chloride colorimetric method with modification.20 Rutin was chosen as a standard and the results were expressed in the form of mg of rutin equivalent (RE) per g of dry powder. The separation of anthocyanins was conducted on a Promosil C18 column (4.6 × 250 mm, 5 μm) using a HPLC instrument (Thermo UltiMate 3000). The column was operated at a temperature of 30 °C. A linear gradient from 5% A to 60% B in 30 min was used for the HPLC assay. Solvent A was acetonitrile and solvent B was water containing 10% formic acid. The flow rate was 0.8 mL min−1 and the absorption spectrum was recorded at 520 nm.21 Three replicates were performed in the analysis.
Cell culture and treatments
HepG2 cells were grown in RPMI-1640 supplemented with 10% fetal bovine serum, 100 IU mL−1 penicillin and 100 μg mL−1 streptomycin at 37 °C, and a 5% CO2 atmosphere. After reaching 70–80% confluence, the cells were washed with PBS twice and treated with different concentrations of the MAE or metformin (2 mM) diluted in serum-free culture medium for 24 h. Cells with no treatment (medium only) were used as the negative control.
MTT method
Cells were seeded into a 96-well plate at a density of 5 × 10³ cells per well for 24 h and then treated with the MAE or metformin at the indicated concentration for 24 h. MTT diluted with PBS at a final concentration of 0.5 mg mL−1 was added to each well. After 4 h of incubation at 37 °C, the formazan precipitate was dissolved in 150 μL DMSO, and the absorbance was measured at 570 nm with a spectrophometer.22 There were five replicates for each treatment and the experiment was repeated twice.
Glucose consumption assay
The glucose consumption was estimated using the method of Lv et al.4 with modification. Cells were seeded into a 96-well plate at a density of 4 × 10³ cells per well with five wells left as blanks. After reaching 80% confluence, the medium was replaced by RPMI-1640 supplemented with 0.2% bovine serum albumin (BSA) (FBS will affect the accuracy of the glucose concentration assay) and metformin or the MAE at various concentrations. The medium was removed 24 h later and the glucose consumption was calculated from the glucose concentration of the blank wells minus the glucose concentrations of the plated wells. The MTT assay was used to adjust the glucose consumption. There were five replicates for each treatment and the experiment was repeated twice.
Glycogen content assay
Cells were seeded in a 6-well plate (4 × 10⁵ cells per well) and treated with 2 mM metformin or the MAE (100 and 250 μg mL−1) for 24 h. The cells were washed twice with PBS and homogenized in 30% KOH (0.5 mL per well). The samples were boiled for 20 min and centrifuged at 12![[thin space (1/6-em)]](https://www.rsc.org/images/entities/char_2009.gif) 000g for 15 min after adding 1.5 mL ethyl alcohol. The precipitates were dissolved in 0.5 mL distilled water and boiled for 20 min after adding 0.2% anthrone diluted with 98% H2SO4. The OD values were detected at 620 nm and the glycogen content values employed glucose as a standard level and were normalized to the protein level by the Bradford reagent.
000g for 15 min after adding 1.5 mL ethyl alcohol. The precipitates were dissolved in 0.5 mL distilled water and boiled for 20 min after adding 0.2% anthrone diluted with 98% H2SO4. The OD values were detected at 620 nm and the glycogen content values employed glucose as a standard level and were normalized to the protein level by the Bradford reagent.
Glucose production assay
HepG2 cells were seeded in a 12-well plate (1 × 10⁵ cells per well) and treated with 100 and 250 μg mL−1 of the MAE or 2 mM metformin for 24 h. The medium was replaced with glucose-free RPMI-1640 supplemented with 100 IU mL−1 penicillin and 100 μg mL−1 streptomycin. After a 4 h incubation, the medium was collected and the glucose concentration was measured with the DNS reagent.23 The OD values were determined at 540 nm and the readings were normalized to the total protein level by the Bradford reagent.
Quantitative RT-PCR analysis
Cells were seeded in a 6-well plate (4 × 10⁵ cells per well) and treated with 2 mM metformin or the MAE (100 and 250 μg mL−1) for 24 h. The total RNA from the HepG2 cells was extracted using an RNAiso Plus kit (code D9108B, TaKaRa, Japan) according to the manufacturer's instructions. Real-time PCR was performed using the SYBR Green Kit (Roche) on the ABI Step One RT-PCR system. Gene-specific primers (Table S1†) were designed with Primer Blast.
PEPCK, G6Pase activities and GYS2 content assays
PEPCK, G6Pase activities and GYS2 content were measured using the Human Elisa Kit (Yuanye Bio-Technology, China) according to the manufacturer's instructions and were normalized to the protein levels. The protein concentration was determined with a BCA protein assay kit.
Western blot
Western blotting experiments were performed as described previously.3 Equal amounts of protein from the total cellular lysates were subjected to SDS-PAGE and transferred to polyvinylidene difluoride membranes. The membranes were probed with primary antibodies against phosphor-AKT (Ser473) and total AKT, phosphor-GSK3β and total GSK3β, and phosphor-FOXO1 (Thr24) and total FOXO1 (Beyotime Biotechnology, China). Then the membranes were examined with horseradish peroxidase conjugated secondary antibodies using an ECL detection system (Beyotime Biotechnology, China). β-Actin was used as a loading control. Densitometry analysis was performed using Image-pro plus 6.0 software.
Statistical analyses
The statistical analyses of the data were performed with SPSS for Windows Version 11.5. One-way ANOVA analyses and two-tailed, unpaired t-tests were used to detect statistical significance, and differences were considered significant when p < 0.05.
Results
Ingredients of mulberry anthocyanin extract (MAE)
The categories and contents of the purified MAE were determined by HPLC. HPLC analysis showed that the retention time of cyanidin-3-glucoside (C3G), cyanidin-3-rutinoside (C3R) and pelargonidin-3-glucoside (P3G) was 8.6, 9.2 and 10.5 min, respectively (Fig. 1). And 1 g of the MAE contained 468.12 ± 5.34 mg C3G, 272.48 ± 4.17 mg C3R and 13.86 ± 1.92 mg P3G. The total phenolic and flavonoid content of 1 g of the MAE, expressed as the gallic acid and rutin equivalent, was 516 ± 5.24 mg GAE and 871 ± 6.91 mg RE, respectively (Table 1).
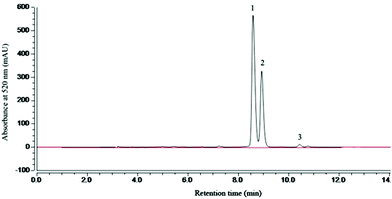 |
| | Fig. 1 HPLC analysis of mulberry anthocyanin extract (MAE) at 520 nm. Mobile phase: A (acetonitrile) and B (H2O/formic acid, 9:1, v/v); flow rate: 0.8 mL min−1; elution gradient: 0 min 5% A; 15 min 15% A; 21 min 28% A; 22 min 40% A; 24 min 60% A; 27 min 5% A; 30 min 5% A. | |
Table 1 Major components identified in mulberry anthocyanin extract (1 gram)
| Ingredients |
Concentration |
| Values are expressed as mean ± SD. |
| Total phenolics |
516 ± 5.24 mg GAE |
| Flavonoids |
871 ± 6.91 mg RE |
| Cyanidin-3-glucoside chloride |
468.12 ± 5.34 mg |
| Cyanidin-3-rutinoside chloride |
272.48 ± 4.17 mg |
| Pelargonidin-3-glucoside |
13.86 ± 1.92 mg |
MAE enhanced glucose consumption in HepG2 cells
Firstly, we evaluated the cytotoxicity of the MAE and metformin toward HepG2 cells using the MTT method. As shown in Fig. 2A, the cell viability was not significantly decreased when cells were treated with the MAE at a concentration lower than 500 μg mL−1, but approximately 70% of cells were not viable when exposed to 1000 μg mL−1 of the MAE for 24 h. In addition, metformin at a concentration of 2 mM had no cytotoxic effect, indicating that it could be used as a positive control in further experiments. Compared with the control, the MAE obviously increased the glucose consumption by 97% and 107% at 100 and 250 μg mL−1, respectively, which was equivalent to the effect of metformin (increased by 108%). But the MAE showed no effect from 0.5 to 50 μg mL−1 (Fig. 2B). Accordingly, concentrations of the MAE of 100 and 250 μg mL−1 were selected for the following experiments to investigate further mechanisms.
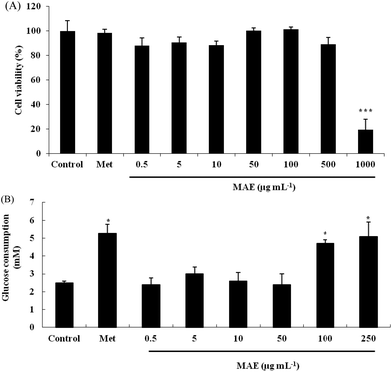 |
| | Fig. 2 Effect of MAE on glucose consumption in HepG2 cells. (A) HepG2 cells were treated with different concentrations of MAE for 24 h and analyzed by MTT assays; (B) glucose consumption from culture medium after 24 h treatment of HepG2 cells. Vertical lines represent standard deviations of five replicates. *p < 0.05, ***p < 0.005, compared to the control. Metformin (2 mM) was used as a positive control. | |
MAE improved glycogen levels and prevented hepatic gluconeogensis
In order to understand the reason for the glucose increase in the cells, we measured the glycogen content and glucose production after MAE treatment. In relation to the control, the glycogen content was 3.53-fold increased for the 250 μg mL−1 MAE group, which was better than the treatment with metformin at 2 mM (2.55-fold), although 100 μg mL−1 of the MAE showed no effect (Fig. 3A). On the other hand, all three intervention groups represented a comparable drop in glucose production (Fig. 3B).
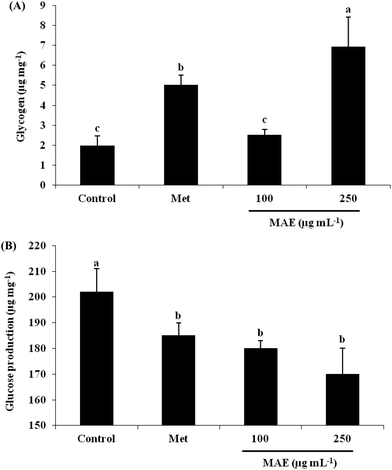 |
| | Fig. 3 MAE increased glycogen content and decreased glucose production in HepG2 cells. (A) Cells were lysed in KOH solution after treatment with metformin or MAE for 24 h, and the lysates were used to measure glycogen content. (B) Culture medium without glucose incubated cells with different treatments was collected to measure glucose content. Vertical lines represent standard deviations of three replicates. Values with different letters above are significantly different, p < 0.05, one-way ANOVA test. Metformin (2 mM) was used as a positive control. | |
Effect of MAE on gluconeogensis related gene and protein expression
PEPCK gene expression was 50% and 28% lower for the MAE treatments (100 and 250 μg mL−1), leading to an evident decrease in the enzyme activity (Fig. 4A and D). As a positive control, metformin showed an inhibitory effect on PEPCK both in gene and protein levels. Although we did not find suppressed gene expression of G6Pase (data not shown), the activity of G6Pase was reduced 14% and 20% respectively after treatment with 100 and 250 μg mL−1 of MAE (Fig. 4E). The expression level of PGC-1α was down-regulated 26% and 37% by MAE-treatment at 100 and 250 μg mL−1 for 24 h (Fig. 4B). The change in the mRNA level of FOXO1 exhibited a similar tendency (decreased 14% and 18%) but less obviously than the level of PGC-1α (Fig. 4C). Meantime, treatment of HepG2 cells with Metformin and MAE (250 μg mL−1) over 24 h augmented the phosphorylated levels of FOXO1 (Fig. 4F and G).
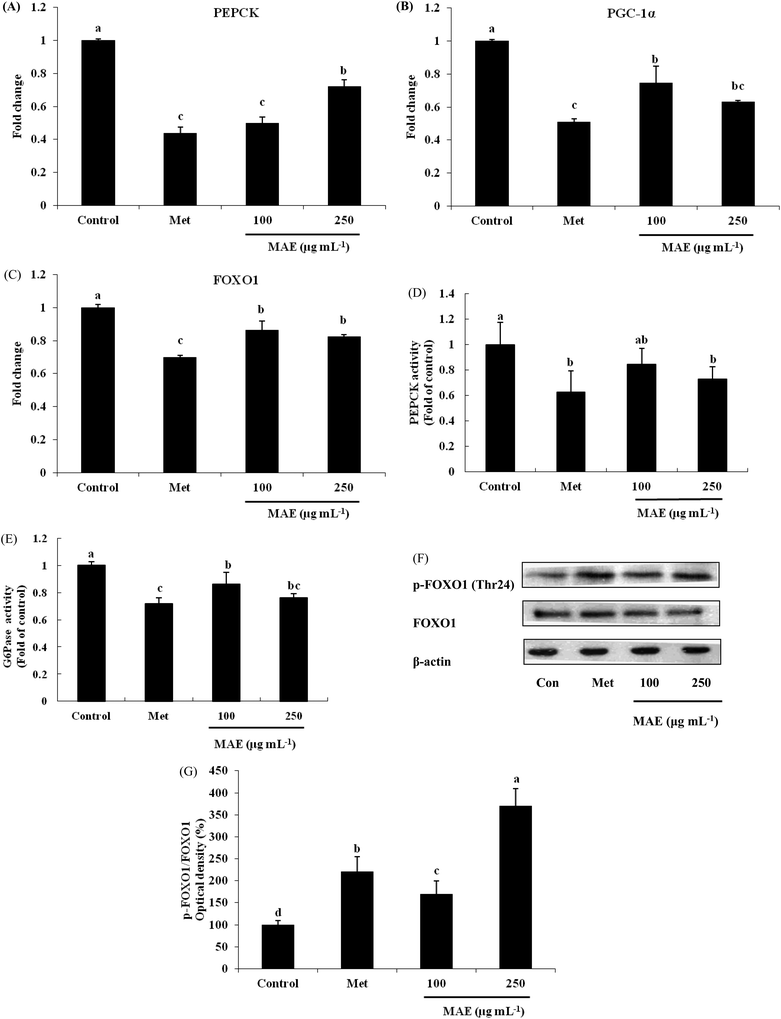 |
| | Fig. 4 MAE treatment decreased expression of genes and proteins associated with gluconeogenesis. (A) PEPCK, (B) PGC-1α and (C) FOXO1 mRNA expressions were assessed by quantitative RT-PCR. PEPCK (D) and G6Pase (E) activities were measured by ELISA kits. Values are expressed as a fold change relative to the control conditions. (F) Bands of representative experiments. (G) Percentage data of p-FOXO1/FOXO1 ratio relative to controls. Equal loading of western blots was ensured by β-actin. Vertical lines represent standard deviations of three replicates. Values with different letters above are significantly different, p < 0.05, one-way ANOVA test. | |
MAE regulated PI3K/AKT pathway in HepG2 cells
The expression of AKT1 was activated and GSK3β was inhibited in cells treated with the MAE at the mRNA level (Fig. 5A and B). The MAE produced a significant increase in the p-AKT/total AKT ratios in a dose-dependent fashion in HepG2 cells (Fig. 6A and C). Interestingly, the total level of GSK3β declined while the phosphprylated levels of GSK3β were enhanced in cells treated with the MAE (Fig. 6A and B), which directly contributed to the activation of GYS2. The results in Fig. 5C and 6D also proved that the MAE at 250 μg mL−1 increased both the gene and protein expression quantities of GYS2 (1.57-fold and 1.4-fold). With the use of LY294002 (a specific PI3K inhibitor) to pretreat the HepG2 cells for 2 h followed by the addition of the MAE for 24 h, the MAE-induced phosphorylation of AKT was obviously decreased, which confirmed that the ability of the MAE to regulate the glucose metabolism was PI3K-mediated. The effect of the MAE on the phosphorylation of GSK3β and FOXO1, two AKT substrates, was also blocked when cells were in the presence of LY294002, implying that the GSK3β and FOXO1 phosphorylation detected here may well be due to AKT (Fig. 7).
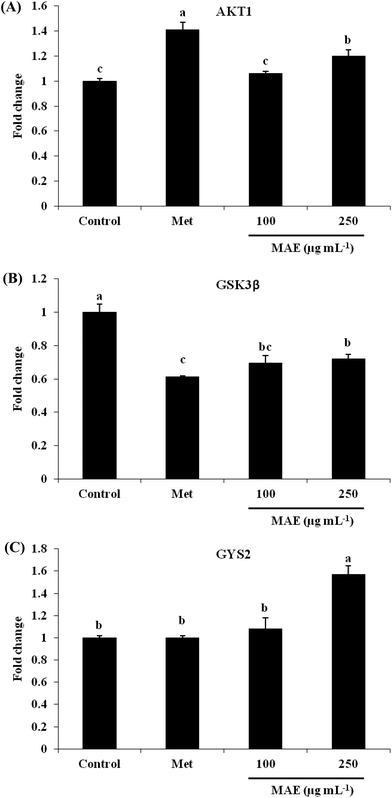 |
| | Fig. 5 Effects of MAE on mRNA levels of (A) AKT1, (B) GSK-3β and (C) GYS2 in HepG2 cells. Values were normalized by β-actin and expressed relative to control cells. Means without a common letter differ, p < 0.05, one-way ANOVA test. | |
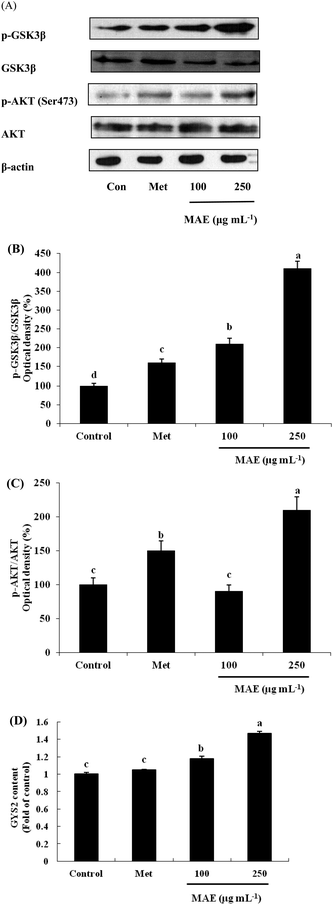 |
| | Fig. 6 Effects of MAE on protein levels of AKT1, GSK-3β and GYS2 in HepG2 cells. (A) Bands of representative experiments. (B) Percentage data of p-GSK3β/GSK3β ratio relative to controls. (C) Percentage data of p-AKT/AKT ratio relative to controls. (D) GYS2 content assayed by a human ELISA kit. Equal loading of western blots was ensured by β-actin. Vertical lines represent standard deviations of three replicates. Values with different letters above indicate a significant difference, p < 0.05, one-way ANOVA test. | |
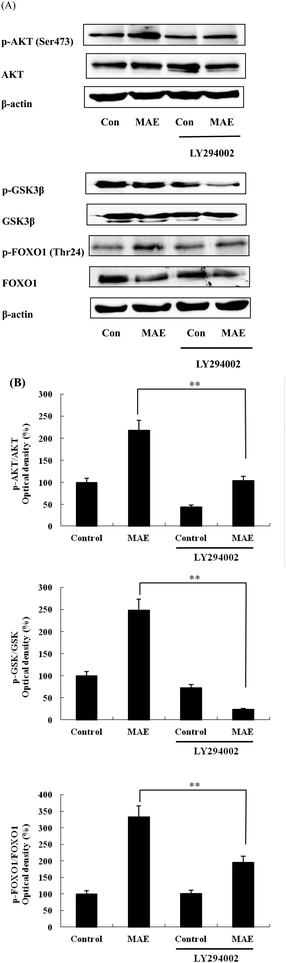 |
| | Fig. 7 Phosphorylation of AKT and its substrates in HepG2 cells exposed to MAE and LY294002. (A) HepG2 cells were treated with MAE (250 μg mL−1) for 24 h with or without the PI3K inhibitors LY294002 (15 μM) and then proteins were harvested for western blotting analysis. (B) Bands were quantified and results were expressed as phosphorylated/total protein and represented relative to control cells. Vertical lines represent standard deviations of three independent experiments. **p < 0.01. | |
Discussion
Anthocyanins, a kind of subclass of flavonoids, are not only responsible for the colors of plant organs, but are also considered to be a functional food factor due to their health-promoting properties.24 Mulberry fruits are very rich in anthocyanins and the deeper the color, the higher the content.25 In this study, we extracted and purified anthocyanins from fresh mulberry fruits, finding that mulberry fruits revealed three main anthocyanins recognized as C3G, C3R and P3G which was consistent with previous research.26 Besides anthocyanins, we infer that the MAE also contains other phenolic acids and flavonoids (especially gallic acid and protocatechuic acid) as well as polysaccharides which have been proved to possess fine bioactivity likewise.8,27 Many researchers have demonstrated that C3G can improve insulin resistance in adipose tissue and the liver.7,28 It has been reported that C3G exerts a protective role against H2O2 or TNF-α induced insulin resistance in 3T3-L1 adipocytes.29 Zhu et al.30 also discovered that C3G prevented hyperglycemia-induced hepatic oxidative damage through glutathione synthesis activation and attenuated oxidative stress damage in db/db mice. Although there is accumulating evidence suggesting the antidiabetic activity of C3G with high purity, there has been insufficient investigation at the glucose metabolism level to illustrate the hypoglycemic effect. In vivo studies found that anthocyanins extracted from mulberry fruits could lower blood glucose levels as well as protect erectile function in diabetes mellitus rats.15,17 But it has not yet been elucidated why MAE exhibits anti-diabetic properties and the molecular mechanism remains unclear. Since MAE has been demonstrated to show an ability for diabetes improvement in previous reports, its modulation of glucose metabolism and the involved mechanism are what we are interested in.
Our results showed that the MAE increased glucose consumption at concentrations of 100 and 250 μg mL−1 (Fig. 2B) and the measurements were almost equivalent to metformin, one of the therapeutic agents for type-2 diabetes patients.31 Furthermore, an increase in the glycogen content and a decrease in the glucose production of cells treated with the MAE were demonstrated in our results (Fig. 3A and B), explaining the phenomenon of glucose consumption enhancement in HepG2 cells. The liver plays an important role in glucose homeostasis both through glycogenolysis and gluconeogenesis to supply glucose to the circulation system and via increasing glycogen synthesis to remove glucose from the cycle. In type 2 diabetes, glucose is overproduced in the hepatocytes but is not effectively utilized by other organs due to the impairment of insulin signal transduction.32 Therefore, interventions to protect hepatocytes from insulin resistance are of great interest for diabetic therapy.
In order to further investigate the mechanism in terms of the glucose metabolism, we determined the effects of the MAE on gluconeogenesis and glycogen at the mRNA and protein level. The MAE down-regulated the gene expression of PEPCK in cells, as well as inactivating PEPCK activity (Fig. 4A and D). G6Pase activity in HepG2 cells was also suppressed by the MAE (Fig. 4E), although it seemed that its gene expression had no obvious change (data not shown). However, it is possible that the expression change between the gene level and protein level is different sometimes. PEPCK catalyzes the early committed step of gluconeogenesis, the process whereby glucose is synthesized, and G6Pase catalyzes the final step. Both enzymes play a key role in glucose homeostasis. Overexpression of PEPCK was found in diabetic mice, resulting in hepatic glucose overproduction.33 FOXO1 is a member of the forkhead family of transcription factors and the regulation of its phosphorylation and intracellular localization is crucial for its transcriptional activity. In addition, FOXO1 modulates the glucose metabolism in the liver by regulating the expression of PEPCK and G6Pase genes via binding to its target DNA sequence directly.34 Our research showed that the mRNA levels of PGC-1α and FOXO1 were impaired in HepG2 cells after incubation with the MAE for 24 h (Fig. 4B and C). Moreover, the MAE (250 μg mL−1) increased the ratio of p-FOXO1/FOXO1 3.2-fold in response to the control (Fig. 4F and G). In the liver, the expression of PGC-1α is induced by fasting and then gluconeogenesis promotion occurs. Its overexpression results in expressions of PEPCK and G6Pase enhancement and hepatic insulin resistance exacerbation,35 exhibiting a similar effect to FOXO1. What's more, FOXO1 function is required for the activation of gluconeogenic gene expression in hepatic cells and mouse livers by PGC-1α, which means there is an interaction between FOXO1 and PGC-1α in the execution of insulin-regulated gluconeogenesis.36 Taken together, we strongly suggest that the role of MAE is in the down-regulation of FOXO1 and PGC-1α so that both PEPCK and G6Pase activities decrease which finally leads to a glucose production drop in HepG2 cells.
PI3K is regarded as a second messenger, which plays a crucial role in the transfer of chemical signals by the cell. It consists of a catalytic subunit (p85) that is coupled with tyrosine-phosphorylated receptor tyrosine kinases and a regulatory subunit (p110) that is required for the G-protein-mediated activation of PI3K. AKT is a vital node downstream of PI3K and the PI3K/AKT pathway is involved in the regulation of the glucose metabolism at several levels.37,38 AKT has been regarded as a key regulator involved in the glucose metabolism including in glucose transport, glycogen synthesis and the suppression of gluconeogenesis.39 The stimulation of AKT will lead to the inhibition of GSK3β by phosphorylation, and then it subsequently dephosphorylates and activates glycogen synthase so that the synthesis of glycogen is accelerated. Besides, AKT activation can inhibit the expression of PEPCK and G6Pase and restrain the gluconeogenesis by FOXO1 phosphorylation.32 The treatment of HepG2 cells with the MAE for 24 h induced an obvious enhancement in the phosphorylated levels of AKT and GSK3β, whereas the expression of the total GSK3β was significantly suppressed at both gene and protein levels (Fig. 6A–C). Meanwhile, an up-regulation of GYS2 at the mRNA and protein levels in HepG2 cells treated with the MAE at 250 μg mL−1 was investigated, explaining a rise in the glycogen content (Fig. 5C and 6D). Meanwhile, the MAE produced a distinct decrease in the p-AKT/total AKT, p-GSK3β/total GSK3β, and p-FOXO1/total FOXO1 ratios in the cells pretreated with LY294002, compared to the cells without the inhibitor (Fig. 7), indicating that the effect of the MAE on the regulation of glucose homeostasis is PI3K-dependent. Taking all these together, for one thing, we deduce that the MAE firstly increases the p-AKT values to inhibit the activity of GSK3β through an increase in the phosphorylation of GSK3β as well as a decrease in the total GSK3β so that GYS2 is evoked to add glycogen content. For another, the motivation of p-AKT also suppresses FOXO1 and PGC-1α expression and results in a decrease in PEPCK and G6Pase activities to impair glucose production.
Conclusions
We suggest that the MAE regulates glucose homeostasis by the modulation of the PI3K/AKT/GSK-3β pathway to accelerate glycogen synthesis as well as through the PI3K/AKT/FOXO1 pathway to inhibit the key signal molecules that promote gluconeogenesis. Although further experiments are needed to understand the precise role of the MAE in the regulation of the insulin pathway in the hepatocyte, mulberry fruits with abundant anthocyanins may have great potential as hypoglycaemic foods.
Acknowledgements
This work was supported by grants from Zhejiang Provincial Natural Science Foundation of China (no. LZ14C200001), National Key Technology R&D Program of China (no. 2012BAD33B08), and the Foundation of Fuli Institute of Food Science, Zhejiang University (no. 2013).
References
- S. Wild, G. Roglic, A. Green, R. Sicree and H. King, Diabetes Care, 2004, 27, 1047–1053 CrossRef.
- M. N. Jin, G. R. Shi, S. A. Tang, Q. Nan, W. Qiao and H. Q. Duan, Fitoterapia, 2013, 90, 240–246 CrossRef CAS PubMed.
- Z. Tu, T. Moss-Pierce, P. Ford and T. A. Jiang, J. Agric. Food Chem., 2013, 61, 2803–2810 CrossRef CAS PubMed.
- Q. Lv, M. Si, Y. Yan, F. Luo, G. Hu, H. Wu, C. Sun, X. Li and K. Chen, J. Funct Foods, 2014, 5, 44–52 Search PubMed.
- I. Cordero-Herrera, M. A. Martín, L. Bravo, L. Goya and S. Ramos, Mol. Nutr. Food Res., 2013, 57, 974–985 CAS.
- I. Cordero-Herrera, M. A. Martín, L. Goya and S. Ramos, Food Chem. Toxicol., 2014, 64, 10–19 CrossRef CAS PubMed.
- R. Sasaki, N. Nishimura, H. Hoshino, Y. Isa, M. Kadowaki, T. Ichi, A. Tanaka, S. Nishiumi, I. Fukuda, H. Ashida, F. Horio and T. Tsuda, Biochem. Pharmacol., 2007, 74, 1619–1627 CrossRef CAS PubMed.
- H. P. Huang, T. T. Ou and C. T. Wang, J. Tradit. Complement Med., 2013, 3, 7–15 CrossRef PubMed.
- N. M. A. Hassimotto, M. I. Genovese and F. M. Lajolo, Nutr. Res., 2008, 28, 198–207 CrossRef CAS PubMed.
- J. J. Chang, M. J. Hsu, H. P. Huang, D. J. Chung, Y. C. Chang and C. J. Wang, J. Agric. Food Chem., 2013, 61, 6069–6076 CrossRef CAS PubMed.
- T. Wu, X. Qi, Y. Liu, J. Guo, R. Zhu, W. Chen, X. Zheng and T. Yu, Food Chem., 2013, 141, 482–487 CrossRef CAS PubMed.
- A. J. Sanyal, C. Campbell-Sargent, F. Mirshahi, W. B. Rizzo, M. J. Contos, R. K. Sterling, V. A. Luketic, M. L. Shiffman and J. N. Clore, Gastroenterology, 2001, 120, 1183–1192 CrossRef CAS PubMed.
- C. G. Walker, M. G. Zariwala, M. J. Holness and M. C. Sugden, Clin. Sci., 2007, 112, 93–111 CrossRef CAS PubMed.
- Y. G. Li, D. F. Zhong, Z. Q. Lv, T. B. Lin, S. Chen and G. Y. Hu, J. Ethnopharmacol., 2011, 134, 961–970 CrossRef CAS PubMed.
- A. Sarikaphuti, T. Nararatwanchai, T. Hashiguchi, T. Ito, S. Thaworanunta, K. Kikuchi, Y. Oyama, I. Maruyama and S. Tancharoen, Exp. Ther. Med., 2013, 6, 689–695 CAS.
- Y. Yang, X. Yang, B. Xu, G. Zeng, J. Tan, X. He, C. Hu and Y. Zhou, Fitoterapia, 2014, 98, 222–227 CrossRef CAS PubMed.
- U. S. Ha, J. S. Koh, H. S. Kim, J. C. Woo, S. J. Kim, H. Jang, B. I. Yoon, S. Y. Hwang and S. W. Kim, Urol. Int., 2012, 88, 470–476 CrossRef CAS PubMed.
- J. S. Lee, Y. R. Kim, I. G. Song, S. J. Ha, Y. E. Kim, N. I. Baek and E. K. Hong, Int. J. Mol. Med., 2015, 35, 405–412 CAS.
- Y. You, X. Yuan, H. J. Lee, W. Huang, W. Jin and J. Zhan, Food Funct., 2015, 6, 401–408 CAS.
- S. Ercisli and E. Orhan, Food Chem., 2007, 103, 1380–1384 CrossRef CAS PubMed.
- T. B. Zou, M. Wang, R. Y. Gan and W. H. Ling, Int. J. Mol. Sci., 2011, 12, 3006–3017 CrossRef CAS PubMed.
- J. Yin, R. M. Hu, M. D. Chen, J. F. Tang, F. Y. Li, Y. Yang and J. L. Chen, Metabolism, 2002, 51, 1439–1443 CrossRef CAS PubMed.
- H. Xu, X. Leng, M. Wang and G. Zhang, Food Anal. Methods, 2012, 5, 1027–1032 CrossRef.
- E. Pojer, F. Mattivi, D. Johnson and C. S. Stockley, Compr. Rev. Food Sci. Food Saf., 2013, 12, 483–508 CrossRef CAS PubMed.
- S. Ercisli and E. Orhan, Food Chem., 2007, 103, 1380–1384 CrossRef CAS PubMed.
- A. M. Pawlowska, W. Oleszek and A. Braca, J. Agric. Food Chem., 2008, 56, 3377–3380 CrossRef CAS PubMed.
- C. Peng, L. Liu, C. Chuang, C. Chyau, C. Huang and C. Wang, J. Agric. Food Chem., 2011, 59, 2663–2671 CrossRef CAS PubMed.
- H. Guo, J. Guo, X. Jiang, Z. Li and W. Ling, Food Chem. Toxicol., 2012, 50, 3040–3047 CrossRef CAS PubMed.
- H. Guo, W. Ling, Q. Wang, C. Liu, Y. Hu and M. Xia, Biochem. Pharmacol., 2008, 75, 1393–1401 CrossRef CAS PubMed.
- W. Zhu, Q. Jia, Y. Wang, Y. Zhang and M. Xia, Free Radicals Biol. Med., 2012, 52, 314–327 CrossRef CAS PubMed.
- P. W. Caton, N. K. Nayuni, J. Kieswich, N. Q. Khan, M. M. Yaqoob and R. Corder, J. Endocrinol., 2010, 205, 97–106 CrossRef CAS PubMed.
- P. J. Klover and R. A. Mooney, Int. J. Biochem. Cell Biol., 2004, 36, 753–758 CrossRef CAS PubMed.
- A. Mendez-Lucas, J. A. G. Duarte, N. E. Sunny, S. Satapati, T. T. He, X. R. Fu, J. Bermudez, S. C. Burgess and J. C. Perales, J. Hepatol., 2013, 59, 105–113 CrossRef CAS PubMed.
- K. Sekine, Y. R. Chen, N. Kojima, K. Ogata, A. Fukamizu and A. Miyajima, EMBO J., 2007, 26, 3607–3615 CrossRef CAS PubMed.
- H. Liang, B. Balas, P. Tantiwong, J. Dube, B. H. Goodpaster, R. M. O'Doherty, R. A. DeFronzo, A. Richardson, N. Musi and W. F. Ward, Am. J. Physiol. Endocrinol. Metab., 2009, 296, 945–954 CrossRef PubMed.
- P. Puigserver, J. Rhee, J. Donovan, C. J. Walkey, J. C. Yoon, F. Oriente, Y. Kitamura, J. Altomonte, H. J. Dong, D. Accili and B. M. Spiegelman, Nature, 2003, 423, 550–555 CrossRef CAS PubMed.
- Y. Gao, M. Zhang, T. Wu, M. Xu, H. Cai and Z. Zhang, J. Agric. Food Chem., 2015, 63, 6019–6026 CrossRef CAS PubMed.
- J. Gao, J. Li, Y. An, X. Liu, Q. Qian, Y. Wu, Y. Zhang and T. Wang, BMC Complementary Altern. Med., 2014, 14, 198 CrossRef PubMed.
- E. L. Whiteman, H. Cho and M. J. Birnbaum, Trends Endocrinol. Metab., 2002, 13, 444–451 CrossRef CAS.
Footnote |
| † Electronic supplementary information (ESI) available. See DOI: 10.1039/c5fo00841g |
|
| This journal is © The Royal Society of Chemistry 2016 |


