 Open Access Article
Creative Commons Attribution 3.0 Unported Licence
Visualization of bond rearrangements in acetylene using near single-cycle laser pulses
Christian
Burger
*ab,
Nora G.
Kling
a,
Robert
Siemering
c,
Ali S.
Alnaser
bd,
Boris
Bergues
b,
Abdallah M.
Azzeer
e,
Robert
Moshammer
f,
Regina
de Vivie-Riedle
c,
Matthias
Kübel
a and
Matthias F.
Kling
ab
aDepartment of Physics, LMU Munich, D-85748 Garching, Germany. E-mail: christian.burger@mpq.mpg.de
bMax Planck Institute of Quantum Optics, D-85748 Garching, Germany
cDepartment of Chemistry and Biochemistry, LMU Munich, D-81377 Munich, Germany
dPhysics Department, American University of Sharjah, POB2666, Sharjah, UAE
eDepartment of Physics and Astronomy, King-Saud University, Riyadh 11451, Saudi Arabia
fMax Planck Institute of Nuclear Physics, D-69117 Heidelberg, Germany
First published on 10th May 2016
Abstract
The migration of hydrogen atoms resulting in the isomerization of hydrocarbons is an important process which can occur on ultrafast timescales. Here, we visualize the light-induced hydrogen migration of acetylene to vinylidene in an ionic state using two synchronized 4 fs intense laser pulses. The first pulse induces hydrogen migration, and the second is used for monitoring transient structural changes via Coulomb explosion imaging. Varying the time delay between the pulses reveals the migration dynamics with a time constant of 54 ± 4 fs as observed in the H+ + H+ + CC+ channel. Due to the high temporal resolution, vibrational wave-packet motions along the CC- and CH-bonds are observed. Even though a maximum in isomerization yield for kinetic energy releases above 16 eV is measured, we find no indication for a backwards isomerization — in contrast to previous measurements. Here, we propose an alternative explanation for the maximum in isomerization yield, namely the surpassing of the transition state to the vinylidene configuration within the excited dication state.
1 Introduction
The photo-excitation of hydrocarbons and the reactions of their nuclei have been studied extensively in order to reveal the underlying physical processes, such as vibrations,1,2 rotations,3 bond rearrangements4 and molecular fragmentation.5 Each process has a corresponding natural timescale, with the fastest nuclear motions occurring in less than 10 fs, and therefore ultrafast laser pulses are ideally suited for their study. Furthermore, bond rearrangement and molecular fragmentation of hydrocarbons can be influenced by tuning the laser parameters. For example, Xie et al. showed that they can control the fragmentation pathways in ethylene by varying the laser pulse duration,6 and Alnaser et al. showed that they could steer the directional emission of the deprotonation from acetylene with the carrier-envelope phase (CEP) of few-cycle laser pulses.7 The second example was interpreted with a vibrational state coupling model. Recently, CEP-control has been extended to the isomerization of acetylene and allene, demonstrating the general importance of the vibrational state coupling mechanism.8In fact, the process of hydrogen migration in acetylene has been the subject of numerous past studies, both theoretically9 and experimentally.2,10,11 More recent experiments have taken advantage of the Coulomb explosion imaging technique using a reaction microscope (REMI) in order to visualize the temporal evolution of the isomerization process in “real time”.12 Specifically, the isomerization of acetylene into vinylidene has been visualized for the dissociation channel: C2H23+ → H+ + C+ + CH+.12–15 The isomerization time was consistently found to be around 50 fs, independent from the chosen excitation wavelength and intensity, as well as independent of whether the dynamics occurred on the cation or dication intermediate states.
Here, we show how to exploit the additional channel C2H23+ → H+ + H+ + CC+ to obtain a more complete understanding of the proton migration as suggested in ref. 16. We use ultrashort laser pulses as pump and probe pulses to visualize the migration process. After a short introduction into our experimental and theoretical methods we present our results on the triple coincidence channels, focusing on the comparison between the channels H+ + C+ + CH+ and H+ + H+ + CC+. Additionally, we determine the isomerization time for the latter channel, and by means of Newton diagrams we present snapshots of the hydrogen migration for various time delays between the pump and probe pulses.
2 Experimental and theoretical methods
2.1 Experimental methods
In order to investigate the hydrogen migration from acetylene to vinylidene, the experimental setup depicted in Fig. 1 was used. The titanium:sapphire system (“FEMTOPOWER™ HR 10 kHz CEP4”, Spectra-Physics) produces laser pulses at a 10 kHz repetition rate with a pulse duration of 22 fs, a pulse energy of 800 μJ and a central wavelength of 790 nm. The pulses are spectrally broadened by a 1 m long hollow-core-fiber with a 275 μm inner core diameter, filled with 500 mbar of argon with the final spectrum covering a range from 400 nm to 1000 nm with a new central wavelength of 690 nm. Temporal compression is attained in a double-angle chirped mirror compressor,17 while the fine tuning to 4 fs full-width half-maximum (FWHM) is done with fused silica wedges. A variable neutral density filter allows us to change the intensity without changing the beam diameter or the dispersion and thus preserves the pulse parameters. The pulse duration is determined by transient-grating frequency-resolved optical gating (TG-FROG).18 The carrier-envelope-phase (CEP) is recorded by an f–2f interferometer throughout the measurement.19 The laser is split into two identical pump- and probe-pulses by a 50![[thin space (1/6-em)]](https://www.rsc.org/images/entities/char_2009.gif) :
:![[thin space (1/6-em)]](https://www.rsc.org/images/entities/char_2009.gif) 50 Mach–Zehnder interferometer prior to the entrance window of a REMI (base pressure: 4 × 10⁻¹⁰ mbar). The pulses are back-focused using a 12.5 cm focal length mirror onto a cold acetylene jet. The thickness of the jet can be varied using automated skimmers to maintain a constant overall count rate. Each pulse has an intensity around 5 × 10¹⁴ W cm−2. The time delay between the pulses is continuously swept from −267 fs to 267 fs in steps of 33 as. One period takes around 5 minutes, while the phase of both pulses changes by 2π within 7 s. This difference in timing ensures that no artificial CEP dependencies on the delay measurement are introduced, which is further verified by a flat CEP distribution for the complete delay range.
50 Mach–Zehnder interferometer prior to the entrance window of a REMI (base pressure: 4 × 10⁻¹⁰ mbar). The pulses are back-focused using a 12.5 cm focal length mirror onto a cold acetylene jet. The thickness of the jet can be varied using automated skimmers to maintain a constant overall count rate. Each pulse has an intensity around 5 × 10¹⁴ W cm−2. The time delay between the pulses is continuously swept from −267 fs to 267 fs in steps of 33 as. One period takes around 5 minutes, while the phase of both pulses changes by 2π within 7 s. This difference in timing ensures that no artificial CEP dependencies on the delay measurement are introduced, which is further verified by a flat CEP distribution for the complete delay range.
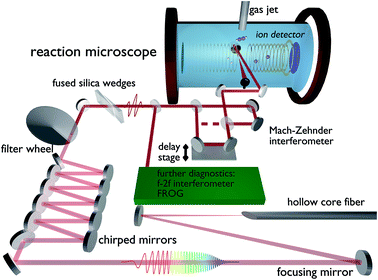 | ||
| Fig. 1 Experimental setup including all major optical components after the amplifier and a schematic drawing of the experimental chamber. | ||
The data acquisition for the results shown here was carried out over three days and consists of four individual measurements, in between which the pulse duration and spatial overlap were verified to ensure similar parameters throughout the entire duration of the experiment.
In Table 1, the accumulated amount of events is shown for each run and each coincidence channel. The statistics indicate that the H+ + C+ + CH+ channel has around 80% more counts than the H+ + H+ + CC+ channel. The total statistics are about 5 times higher than previously reported,14 attributed to the high repetition rate laser and the long-term stability of the overall system. Such high statistics, combined with the high temporal resolution, allows us to investigate the vibrational motion within the intermediate state in addition to the isomerization process.
| Measurement run | Coincidences per channel | |||
|---|---|---|---|---|
| 1 | 2 | 3 | 4 | |
| H+ + C+ + CH+ | 245![[thin space (1/6-em)]](https://www.rsc.org/images/entities/char_2009.gif) 552 552 |
89![[thin space (1/6-em)]](https://www.rsc.org/images/entities/char_2009.gif) 274 274 |
32![[thin space (1/6-em)]](https://www.rsc.org/images/entities/char_2009.gif) 796 796 |
146![[thin space (1/6-em)]](https://www.rsc.org/images/entities/char_2009.gif) 586 586 |
| H+ + H+ + CC+ | 129![[thin space (1/6-em)]](https://www.rsc.org/images/entities/char_2009.gif) 131 131 |
55![[thin space (1/6-em)]](https://www.rsc.org/images/entities/char_2009.gif) 396 396 |
18![[thin space (1/6-em)]](https://www.rsc.org/images/entities/char_2009.gif) 770 770 |
80![[thin space (1/6-em)]](https://www.rsc.org/images/entities/char_2009.gif) 105 105 |
| H+ + H+ + C+ + C+ | 53![[thin space (1/6-em)]](https://www.rsc.org/images/entities/char_2009.gif) 695 695 |
8156 | 5944 | 44![[thin space (1/6-em)]](https://www.rsc.org/images/entities/char_2009.gif) 955 955 |
To combine the CEP-dependent data from each measurement, the relative phase for each scan is shifted to match an independent reference data set. This reference is given by the strongest phase dependent signal, the double ionization asymmetry of acetylene, at a specific time delay (100 ± 10 fs) — far from the temporal overlap to avoid interference effects. The asymmetry is calculated by  where Nleft and Nright are the photo-ion yields to the left and right directions, respectively, along the polarization axis in the time-of-flight (TOF) spectrum. For further information see ref. 20. Furthermore, we checked that the measured data are independent of the sign of the delay. With this condition fulfilled, the data from negative and positive delays are combined to achieve better statistics.
Various dissociation channels from strong field pump–probe measurements can be identified in the coincidence spectra. Of these, the channels involving a clear isomerization component are:
| C2H22+ → C+ + CH2+ | (i) |
| C2H22+ → C2+ + H2+ | (ii) |
| C2H23+ → H2+ + C+ + C+ | (iii) |
| C2H23+ → H+ + C+ + CH+ | (iv) |
| C2H23+ → H+ + H+ + CC+ | (v) |
| C2H24+ → H+ + H+ + C+ + C+ | (vi) |
Channel (i) permits us to measure the fragmentation yield of vinylidene and therefore to determine the average isomerization time to 52 ± 15 fs, as investigated by Jiang et al.21 Channels (ii) and (iii) are relatively weak, most likely because they require both hydrogen migration and bond formation between the hydrogens. Despite being interesting channels, the low statistics prevented us from being able to determine much about them and therefore, they are left out of the main discussion here. Channels (iv) and (v) have excellent statistics, and while channel (iv) has been extensively studied (see ref. 12–15), the investigation of channel (v) has been proposed16 but reports have been lacking so far. Here, we compare both channels and highlight the advantages of channel H+ + H+ + CC+. For channel (vi), preliminary analysis also shows signs of isomerization. However, due to the additional complexity of the quadruply charged parent ion, and the data analysis of the four-body coincidence, it will not be discussed in detail here. Instead, our main focus is on channels (iv) and (v). These two channels enable us to compare our measurements with previous experiments on the H+ + C+ + CH+ channel and gain further information by analyzing the H+ + H+ + CC+ channel. However, we would also like to point out that a considerable advantage of channel (v) lies in the large difference in mass of the C2+ and H+ fragments, avoiding any overlap of their TOF's. This is especially important in contrast to the H+ + C+ + CH+ channel, where the C+ and CH+ fragment have overlapping TOF's, which make the molecular reconstruction more difficult.
2.2 Theoretical methods
We used a Complete Active Space Self-Consistent Field model (CASSCF) to calculate the potential energy surfaces for the ground states of the neutral, cation, dication, and trication states, as well as for different excited states. The active space provided for the electron correlation was adapted to the number of the valence electrons and consists of the same 10 molecular orbitals and all electrons except the 1s-core electrons of the carbon atoms. The calculations were performed using the program package MOLPRO with a 6-311++G** basis set.22 Using this model we utilize the precise description of excited states to calculate the molecular configurations. These results enable us to understand the pathway of the migrating hydrogen atom within the dication state.3 Results and discussion
In Fig. 2, the kinetic energy release (KER) of the three-fold coincidence channels is shown as a function of the time delay between the pump and probe pulses. The color scale in (a) and (b) indicates the yield, which is normalized to one for each time step. The integrated counts for each time step without normalization are plotted below in (c) and (d). Clearly visible in Fig. 2(a) and (b) is the strong signal at 16–17 eV that is largely delay independent and the contributions at lower KER values which are time dependent. Both areas can be separated at a KER of 13 eV, indicated by the black dashed line, which is later used for energy filtering. The low KER features are the result of bond stretching induced by the pump pulse, as seen in many other pump–probe studies on dissociating molecules.23–25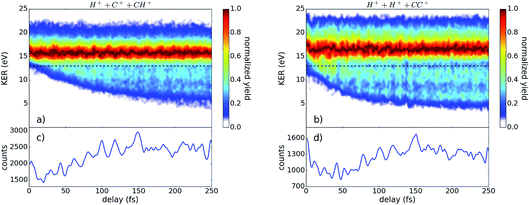 | ||
| Fig. 2 The yield of (a) H+ + C+ + CH+ and (b) H+ + H+ + CC+ as a function of the kinetic energy release (KER) and pulse delay. The yield for each time bin is normalized to its peak, revealing a small oscillation of the KER with the delay. The black dashed line indicates the separation of the regions investigated in Fig. 4. The total yield corresponding to (a) and (b) is plotted in (c) and (d), respectively. | ||
While the H+ + C+ + CH+ channel is sensitive to both the CC- and CH-bonds, the H+ + H+ + CC+ channel exclusively probes the CH-bonds. The slower temporal evolution of the low KER contribution in the H+ + C+ + CH+ channel indicates a slower bond stretching of the CC-bond in comparison to the CH-bond, as expected. Furthermore, the data shown in Fig. 2 contains two independent indications for a wave-packet motion in the intermediate state. First, we present in Fig. 2(c) and (d) the yield as a function of the pulse delay which shows a fine-structured oscillation. Secondly, we observe a periodical oscillation of the maximum position of the KER distribution around 17 eV which becomes observable only by using ultrashort pulses.26,27 Applying a Fourier analysis to the oscillations of the highest KER values, as well as to the oscillations of the total yield dependent of the pulse delay, reveals three major contributions: 11.5 fs ± 1.7 fs, 20.4 fs ± 1.5 fs, and 33.4 fs ± 1.2 fs. To attribute these experimentally determined periods to the corresponding wave-packet motion we calculated the periods of various modes within the neutral, cation, and dication, presented in Table 2.
| Mode | Period of oscillation (fs) | ||
|---|---|---|---|
| Neutral | Cation | Dication | |
| Trans-bending (x–z and y–z) | 59.2 ± 0.6 | 40.4 ± 0.5 and 70.1 ± 0.7 | 52.2 ± 0.6 |
| Cis-bending (x–z and y–z) | 48.1 ± 0.5 | 40.5 ± 0.5 and 45.4 ± 0.5 | 47.0 ± 0.5 |
| CC-stretching | 16.3 ± 0.5 | 23.0 ± 0.5 | 21.6 ± 0.5 |
| Antisymmetric CH-stretching | 10.0 ± 0.4 | 11.2 ± 0.4 | 11.4 ± 0.4 |
| Symmetric CH-stretching | 9.7 ± 0.4 | 10.9 ± 0.4 | 11.0 ± 0.4 |
Comparing our experimental results to the calculated modes in Table 2 we identify the 11.5 fs ± 1.7 fs oscillation with a CH-bond stretching mode and the 20.4 fs ± 1.5 fs vibration with a CC-bond stretching mode within the dication. Thus we can directly observe the CH- and CC-vibrations in acetylene via strong-field pump–probe measurements of the fragment ions. The slowest experimentally observed oscillation of 33.4 fs ± 1.2 fs is not identified by our theoretical calculations as the various bending modes are slower than 40 fs, while the stretching modes are too fast to explain our results. Even though we cannot link the observed oscillation to one distinct mode, it is likely that we observe a combination of the stretching modes resulting in slower oscillations. To investigate the populated state further, we present in Fig. 3 the different potential energy curves of acetylene.
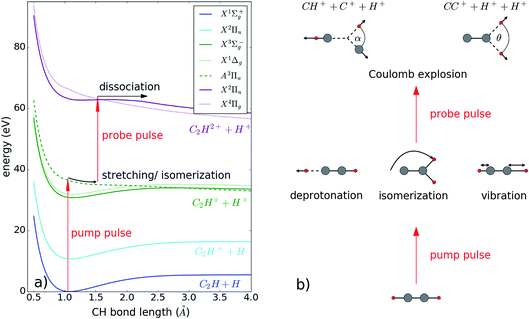
Selected potential energy curves along the CH-bond internuclear distance are depicted in Fig. 3 along with a sketch of the various configurations of acetylene in the intermediate state. First, the pump pulse is ionizing the molecule, bringing it into an intermediate state, either the cation or dication state, where hydrogen migration can take place. The probe pulse ionizes the molecule further until it dissociates from a triply or even higher charged state. Depending on the excitation wavelength and intensity, different populated intermediate states have been reported so far. While using XUV or UV light for excitation results in a populated cation state,14,15,28 IR strong field excitation populates the dication state.12,13 In our experimental setup, a dication state is the most probable to be populated, as we use identical pump and probe pulses (see Fig. 3). Reachable are the ground state X3Σg− and excited states X1Δg, and A3Πu. The latter is purely repulsive along the C–H bond.
Pumping the molecule into an excited dication state can trigger several motions such as vibration, dissociation, rotation and isomerization, as depicted schematically in Fig. 3(b). Experimentally, we observe the 3D momenta of each ionic fragment, enabling us to reconstruct the molecular arrangement at the time of Coulomb explosion. Together with the KER, this information allows us to disentangle the various molecular motions.
To describe isomerization, it is useful to define the angles α and θ of the migrating hydrogen (see Fig. 3(b)). In order to compare our results to previous measurements, α is defined as in ref. 12 and 13 and describes the angle between the proton and the carbon ion with respect to the center of gravity of the molecule (see Fig. 3(b)). The angle θ corresponds to the angle in between both protons seen from the C2+ ion. Using the C2+ ion as a center enables us to directly compare our results with theoretical calculations performed on the dication of acetylene. Both angles are calculated via: α,  where
where ![[p with combining right harpoon above (vector)]](https://www.rsc.org/images/entities/i_char_0070_20d1.gif) 1 and
1 and ![[p with combining right harpoon above (vector)]](https://www.rsc.org/images/entities/i_char_0070_20d1.gif) 2 are the momenta of the hydrogen and carbon ions for channel (iv) and of both protons for channel (v).
2 are the momenta of the hydrogen and carbon ions for channel (iv) and of both protons for channel (v).
By this definition of angles, we assign α at around 0° and θ at 180° to the acetylene configuration and α above 90° and θ below 90° to vinylidene. In the following part we will extend our analysis to the reconstruction of the molecular configuration — the angles α and θ provide us with the information about the angular position of the migrating proton.
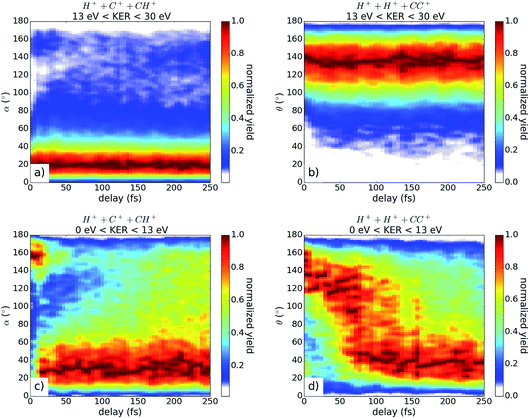
In Fig. 4, the fragmentation yield as a function of the angles α and θ and the pulse delay is shown for both coincidence channels with two different energy filters. The energy filter separates the time independent KER region (above 13 eV) from the dissociating contributions at lower KER values (see Fig. 2). For the high KER region in both channels, the angles stay relatively constant with broad angular distributions around 20° and 140°, respectively, indicating that the molecules tend to stay in the acetylene configuration. These results fit very well to the calculated configuration of excited acetylene molecules within the dication, where the hydrogen atoms are bent with respect to the CC axis. Likely, the excitation energy is thereby stored in a wave-packet motion in the acetylene configuration, which results in a widespread momenta distribution around the acetylene configuration, visible here by the broad angular distribution.
For the low KER contributions plotted in Fig. 4(c) and (d), a clear time dependence is observed showing the movement to smaller angles. This indicates the isomerization to the vinylidene configuration. In contrast to the H+ + C+ + CH+ channel, the majority of the molecules change their molecular configuration in the H+ + H+ + CC+ channel (see Fig. 4(d)). After approximately 100 fs, more than 60% of all molecules in the H+ + C+ + CH+ channel have reached the vinylidene configuration. We note that in contrast to ref. 12, the migration back to the acetylene configuration is not observed, but rather, the molecules tend to favor the vinylidene configuration for the remaining duration of the scanned time delay. We note that this discrepancy could, at least in part, be due to the fact that Hishikawa et al. used a background subtraction, which accounted for three-fold coincidences from only one pulse.12
For the coincidence channel H+ + C+ + CH+, it is visible that we have a considerable amount of molecules in the vinylidene configuration at small time delays. This contribution results from the overlap in the TOF spectrum for the slow C+ fragments and the fast CH+ fragments. Inevitably, the identification of the two fragments in the data analysis is convoluted, potentially leading to a wrong assessment of the molecular configuration. For the H+ + H+ + CC+ channel, the TOF's of each fragment are clearly separated, and the assessment of the molecular configuration is thus much more reliable.
Using the angular information as a filter, the molecules which ultimately dissociated from the vinylidene configuration are separated from those dissociated from the acetylene configuration. For channel H+ + C+ + CH+, all angles α above 90° (see Fig. 3(b)) are referred to as vinylidene while all angles below 90° are attributed to the acetylene configuration. For channel H+ + H+ + CC+, the vinylidene configuration is reached for all angles θ below 90° (see Fig. 3(b)) and all angles above 90° correspond to the acetylene configuration. The resulting KER distribution is plotted versus the pulse delay in Fig. 5.
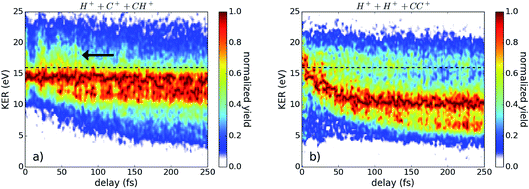 | ||
| Fig. 5 Kinetic energy release from (a) H+ + C+ + CH+ and (b) H+ + H+ + CC+versus the pulse delay, fulfilling the condition: α > 90° and θ < 90°, indicating the molecule dissociated from the vinylidene configuration. The dashed black lines indicates the new energy filter used for Fig. 7, while the arrow points to an area of interest used to identify the intermediate state, as explained in the text. | ||
In Fig. 5, the yield is plotted as a function of the KER and time delay for molecules in the vinylidene configuration. Compared to Fig. 2, the contribution at 16–17 eV is considerably weaker, while the delay dependent contribution below 16 eV becomes clearly visible. For the investigated pump–probe delays, this indicates that the isomerized molecules in the dication dissociate too fast to allow for a back migration of the proton into an acetylene-like configuration.
Taking a closer look at Fig. 5(a), one can see that the KER extends to higher values at delays between 0 fs and 100 fs, marked by an arrow in the plot. This increase in KER values in channel H+ + C+ + CH+, as well as the delay dependence in both KER plots in Fig. 5, can be well explained within the A3Πu excited dication state, where an isomerization can take place as shown by theoretical calculations, see Fig. 6.29
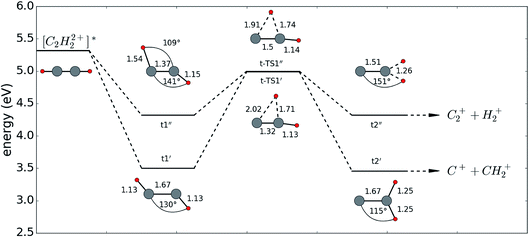 | ||
| Fig. 6 Sketch of the energies and corresponding configurations of an acetylene molecule in the excited dication state. All configurations were calculated using the CASSCF[8,10] model with a 6-311++G** basis set, where the bond lengths are given in units of 10−10 m. The idea for this figure was taken from ref. 29. | ||
According to our calculations in full dimension, acetylene in the A3Πu state relaxes into the two local minima t1′ and t1′′ with bent configurations having angles around 140° between the CH-and CC-bonds. From these local minima, the energetically higher lying transition states t-TS1′ and t-TS1′′ have to be overcome. The transition states are close in energy, the angle between both protons is around 90°, and the CH-bond of the migrating proton is elongated while the CC-bond is slightly shortened. In a last step, the molecule finishes its migration into vinylidene from where it can dissociate in either of two channels: [C2H22+]* → C2+ + H2+ or → C+ + CH2+. The probe pulse in our experiment is used to further ionize and dissociate the H2+ or CH2+, respectively. These dissociations are very well observed within both cases, visible in the time dependent low KER regions, whereas the intermediate transition states t-TS1′ and t-TS1′′ are observed in the following two ways. Within the H+ + H+ + CC+ channel, the stretched CH-bond of the migrating proton is probed, resulting in the rapidly decreasing KER within the first 100 fs. In the H+ + C+ + CH+ channel, the CC-bond can be probed resulting in a higher KER, seen at around 40 fs (see arrow in Fig. 5). This effect cannot be observed as easily as the CH-bond stretching because within this channel both effects occur simultaneously, washing out the signal as one contribution delivers higher KER (short CC-bonds) while the other yields lower KERs (long CH-bonds).
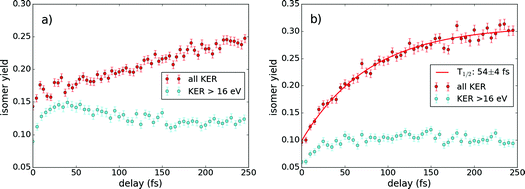
Since we can follow the isomerization dynamics in our pump–probe experimental scheme, we can also extract the isomerization time by measuring the isomer yield as a function of pulse delay. The isomer yield is calculated as the ratio of vinylidene molecules (α > 90°, θ < 90°) to all triple coincidences for each channel. In Fig. 7, the isomerization yield dependence on the pulse delay is shown for both investigated channels.
We investigated two different scenarios in Fig. 7. In the first scenario, we consider all isomerization counts appearing in Fig. 5 and in the second, we only consider the number of isomerization events that occurred with a KER above 16 eV, indicated by the dashed line in Fig. 5. For the first scenario, we see an increase of the isomer yield with pulse delay. In the H+ + H+ + CC+ channel an asymptotic behavior is observed for long delays indicating that the final isomerization yield is around 30%. Note that these 30% result from the investigation of all measured data without applying any filter. Fitting this data with an exponential function allows us to determine the isomerization time to be 54 ± 4 fs, which is consistent with previously reported isomerization times from both measurements and calculations.14,21,30,31
The H+ + C+ + CH+ channel, in contrast, shows more of a linear trend for the pulse delays considered, which makes a determination of the isomerization time difficult. After 250 fs, the isomerization yield is at 25%, which is considerably lower than for H+ + H+ + CC+. As the dynamics within the H+ + C+ + CH+ channel seems to occur on longer timescales, it is expected that the isomerization yield would also saturate for longer pulse delays, from which we can only speculate that the isomerization time for this channel is longer than for the H+ + H+ + CC+ channel.
For the second scenario, applying a high energy filter (KER > 16 eV), we reproduce previous measurements in the H+ + C+ + CH+ channel showing a peak at 40 fs, which was interpreted as an isomerization maximum, where afterwards the proton may migrate back into the acetylene configuration.14 However, as we do not observe a similar behavior in the second coincidence channel, we propose an alternative explanation for the peak around 40 fs. In the intermediate state t-TS1′′ (see Fig. 6), the CC-bond has a reduced equilibrium bond length, which may result in high KER values when dissociation is induced. For higher time delays the bond length increases again and the molecule stays within the vinylidene configuration without backwards migration. In other words, the peak of isomerization yield for the applied high KER filter is not due to a maximal isomerization yield, but rather to a CC vibrational motion. One would maybe think that a similar feature should appear in the H+ + H+ + CC+ channel, but this channel is less sensitive to the CC-bond length, as this bond remains intact. Indeed, for the channel H+ + H+ + CC+, the isomerization yield fluctuates always around 10% without any other clear trend (see Fig. 7(b)).
Furthermore, we observe in Fig. 7 that the isomer yield at zero delay is always above 5% — independent of the investigated channel. This is likely due to a population of the trication where the isomerization takes place followed by Coulomb explosion. The direct population becomes possible by the high intensities in the temporal overlap of both pulses. For higher pulse delays a direct ionization into the trication becomes unlikely as the intensity of one pulse alone is too low. The even higher isomer yields for Fig. 7(a) result from the artifact discussed above (see Fig. 4).
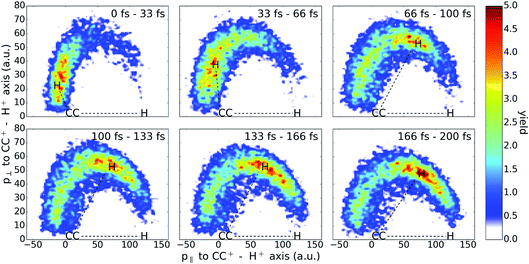
Finally, to visualize the hydrogen migration process, we plot a series of Newton diagrams for the H+ + H+ + CC+ channel in Fig. 8. Filtering only the events of one dissociating contribution (with a KER between 8 eV and 13 eV) highlights the isomerization process. Here, the Newton diagrams depict the 3D momenta in the following way: first, the momentum of the CC+ ion is subtracted from the proton momenta in order to use the heaviest fragment as the center. Secondly, the momentum of the first proton is used as a reference to turn the coordinate system such that the CC+ − H1+ axis is fixed along the positive horizontal axis. Finally, the momentum components of the second hydrogen along this CC+ − H1+ axis (p‖) and the momentum perpendicular (p⊥) are plotted for different time delays. It is well visible that the isomerization takes place in the first 100 fs until the majority of molecules are in the vinylidene configuration. For longer pulse delays, a maximal isomerization is reached and the momentum distribution stays mostly unchanged showing no sign of a backwards isomerization.
As mentioned in the Experimental methods section, the CEP was also recorded such that CEP effects can be investigated. We have not observed clear CEP-dependent signatures in the pump–probe data, but it should be mentioned that the CEP effects in single pulse data were relatively small (asymmetries of around 7% have been detected).8 With the data at hand we cannot rule out that time-dependent CEP-effects may be present, but if so, they are very small.
4 Conclusion
In summary, we have presented the molecular response in acetylene at various times after excitation by a near single-cycle pulse using the Coulomb explosion imaging technique. Investigating both major triple coincidence channels, we have observed the evolution of the hydrogen migration process for the isomerization to the vinylidene configuration. However, under our experimental conditions, no backwards isomerization to acetylene was observed. Despite this discrepancy, the isomerization time of the acetylene ion of 54 ± 4 fs, which we have clearly determined via the H+ + H+ + CC+ channel, is in excellent agreement with previous experimental studies21,30,31 and theoretical predictions.29 The maximum in isomerization yield is explained within the structural evolution of the excited dication, namely the surpassing of the energetically higher lying transition states t-TS1′ and t-TS1′′ to the vinylidene configuration. The unprecedented temporal resolution in our experiment allowed us to identify vibrational wave-packet motions along the CH- and CC-bonds with periods of 11.5 fs ± 1.7 fs and 20.4 fs ± 1.5 fs, respectively.Acknowledgements
We are grateful to F. Krausz for his support and fruitful discussions. We are thankful for support by the Max Planck Society and by the DFG via LMUexcellent and via the Cluster of Excellence: Munich Center for Advanced Photonics (MAP). We are also grateful for support from the King-Saud University in the framework of the MPQ-KSU-LMU collaboration.References
- P. Jungner and L. Halonen, J. Chem. Phys., 1997, 55, 1680–1682 CrossRef.
- R. Thissen, J. Delwiche, J. M. Robbe, D. Duflot, J. P. Flament and J. H. D. Eland, J. Chem. Phys., 1993, 99, 6590 CrossRef CAS.
- N. Ochi and S. Tsuchiya, Chem. Phys., 1991, 152, 319–336 CrossRef CAS.
- W. F. Manders and J. M. Bellama, Polymer, 1985, 23, 351–357 CAS.
- C. Cornaggia, M. Schmidt and D. Normand, Phys. Rev. A, 1995, 51, 1431–1437 CrossRef CAS.
- X. Xie, S. Roither, M. Schöffler, E. Lötstedt, D. Kartashov, L. Zhang, G. G. Paulus, A. Iwasaki, A. Baltuška, K. Yamanouchi and M. Kitzler, Phys. Rev. X, 2014, 4, 1–10 Search PubMed.
- A. S. Alnaser, M. Kübel, R. Siemering, B. Bergues, N. G. Kling, K. J. Betsch, Y. Deng, J. Schmidt, Z. A. Alahmed, A. M. Azzeer, J. Ullrich, I. Ben-Itzhak, R. Moshammer, U. Kleineberg, F. Krausz, R. de Vivie-Riedle and M. F. Kling, Nat. Commun., 2014, 5, 3800 CAS.
- M. Kübel, R. Siemering, C. Burger, N. G. Kling, H. Li, A. S. Alnaser, B. Bergues, S. Zherebtsov, A. M. Azzeer, I. Ben-Itzhak, R. Moshammer, R. de Vivie-Riedle and M. F. Kling, 2015, arxiv, 1508.04018.
- D. Duflot, J.-M. Robbe and J.-P. Flament, J. Chem. Phys., 1995, 102, 355 CrossRef CAS.
- K. M. Ervin, J. Ho and W. C. Lineberger, J. Chem. Phys., 1989, 91, 5974 CrossRef CAS.
- M. P. Jacobson and R. W. Field, J. Phys. Chem. A, 2000, 104, 3073–3086 CrossRef CAS.
- A. Hishikawa, A. Matsuda, M. Fushitani and E. J. Takahashi, Phys. Rev. Lett., 2007, 99, 258302 CrossRef PubMed.
- A. Hishikawa, A. Matsuda, E. J. Takahashi and M. Fushitani, J. Chem. Phys., 2008, 128, 084302 CrossRef PubMed.
- H. Ibrahim, B. Wales, S. Beaulieu, B. E. Schmidt, N. Thiré, E. P. Fowe, É. Bisson, C. T. Hebeisen, V. Wanie, M. Giguére, J.-C. Kieffer, M. Spanner, A. D. Bandrauk, J. Sanderson, M. S. Schuurman and F. Légaré, Nat. Commun., 2014, 5, 4422 CAS.
- A. Matsuda, M. Fushitani, E. J. Takahashi and A. Hishikawa, Springer Proc. Phys., 2012, 125, 317–322 CAS.
- A. S. Alnaser, I. Litvinyuk, T. Osipov, B. Ulrich, A. Landers, E. Wells, C. M. Maharjan, P. Ranitovic, I. Bochareva, D. Ray and C. L. Cocke, J. Phys. B: At., Mol. Opt. Phys., 2006, 39, 485–492 CrossRef.
- V. Pervak, I. Ahmad, M. K. Trubetskov, a. V. Tikhonravov and F. Krausz, Opt. Express, 2009, 17, 7943–7951 CrossRef CAS PubMed.
- D. J. Kane and R. Trebino, IEEE J. Quantum Electron., 1993, 29, 571–579 CrossRef.
- M. Schultze, A. Wirth, I. Grguras, M. Uiberacker, T. Uphues, A. Verhoef, J. Gagnon, M. Hofstetter, U. Kleineberg, E. Goulielmakis and F. Krausz, J. Electron Spectrosc. Relat. Phenom., 2011, 184, 68–77 CrossRef CAS.
- M. Kübel, K. J. Betsch, N. G. Johnson, U. Kleineberg, R. Moshammer, J. Ullrich, G. G. Paulus, M. F. Kling and B. Bergues, New J. Phys., 2012, 14, 093027 CrossRef.
- Y. H. Jiang, A. Rudenko, O. Herrwerth, L. Foucar, M. Kurka, K. U. Kühnel, M. Lezius, M. F. Kling, J. Van Tilborg, A. Belkacem, K. Ueda, S. Düsterer, R. Treusch, C. D. Schröter, R. Moshammer and J. Ullrich, Phys. Rev. Lett., 2010, 105, 263002 CrossRef CAS PubMed.
- H.-J. Werner, P. J. Knowles, G. Knizia, F. R. Manby, M. Schütz, P. Celani, W. Györffy, D. Kats, T. Korona, R. Lindh, A. Mitrushenkov, G. Rauhut, K. R. Shamasundar, T. B. Adler, R. D. Amos, A. Bernhardsson, A. Berning, D. L. Cooper, M. J. O. Deegan, A. J. Dobbyn, F. Eckert, E. Goll, C. Hampel, A. Hesselmann, G. Hetzer, T. Hrenar, G. Jansen, C. Köppl, Y. Liu, A. W. Lloyd, R. A. Mata, A. J. May, S. J. McNicholas, W. Meyer, M. E. Mura, A. Nicklass, D. P. O'Neill, P. Palmieri, D. Peng, K. Pflüger, R. Pitzer, M. Reiher, T. Shiozaki, H. Stoll, A. J. Stone, R. Tarroni, T. Thorsteinsson and M. Wang, MOLPRO, Version 2006.1, a Package of Ab Initio Programs, 2006 Search PubMed.
- H. Stapelfeldt, E. Constant, H. Sakai and P. Corkum, Phys. Rev. A, 1998, 58, 426–433 CrossRef CAS.
- I. A. Bocharova, A. S. Alnaser, U. Thumm, T. Niederhausen, D. Ray, C. L. Cocke and I. V. Litvinyuk, Phys. Rev. A: At., Mol., Opt. Phys., 2011, 83, 1–17 CrossRef.
- T. Ergler, A. Rudenko, B. Feuerstein, K. Zrost, C. D. Schröter, R. Moshammer and J. Ullrich, Phys. Rev. Lett., 2005, 95, 14–17 CrossRef PubMed.
- M. Magrakvelidze, O. Herrwerth, Y. H. Jiang, A. Rudenko, M. Kurka, L. Foucar, K. U. Kühnel, M. Kübel, N. G. Johnson, C. D. Schröter, S. Düsterer, R. Treusch, M. Lezius, I. Ben-Itzhak, R. Moshammer, J. Ullrich, M. F. Kling and U. Thumm, Phys. Rev. A: At., Mol., Opt. Phys., 2012, 86, 1–11 Search PubMed.
- B. Fischer, M. Kremer, T. Pfeifer, B. Feuerstein, V. Sharma, U. Thumm, C. D. Schröter, R. Moshammer and J. Ullrich, Phys. Rev. Lett., 2010, 105, 1–4 Search PubMed.
- Y. H. Jiang, A. Senftleben, M. Kurka, A. Rudenko, L. Foucar, O. Herrwerth, M. F. Kling, M. Lezius, J. V. Tilborg, A. Belkacem, K. Ueda, D. Rolles, R. Treusch, Y. Z. Zhang, Y. F. Liu, C. D. Schröter, J. Ullrich and R. Moshammer, J. Phys. B: At., Mol. Opt. Phys., 2013, 46, 164027 CrossRef.
- T. S. Zyubina, Y. A. Dyakov, S. H. Lin, A. D. Bandrauk and A. M. Mebel, J. Chem. Phys., 2005, 123, 134320 CrossRef CAS PubMed.
- Y. H. Jiang, A. Senftleben, A. Rudenko, M. E. Madjet, O. Vendrell, M. Kurka and K. Schnorr, 2010, arxiv, 1402.4874.
- T. Osipov, C. L. Cocke, M. H. Prior, A. Landers, T. Weber, O. Jagutzki, L. Schmidt, H. Schmidt-Böcking and R. Dörner, Phys. Rev. Lett., 2003, 90, 233002 CrossRef CAS PubMed.
| This journal is © The Royal Society of Chemistry 2016 |

