 Open Access Article
Creative Commons Attribution 3.0 Unported Licence
Modelling metal centres, acid sites and reaction mechanisms in microporous catalysts
Alexander J.
O'Malley
*ac,
A. J.
Logsdail
ab,
A. A.
Sokol
 a and
C. R. A.
Catlow
*abc
aDepartment of Chemistry, University College London, 20 Gordon St., London WC1 HOAJ, UK
bCardiff Catalysis Institute, School of Chemistry, Cardiff University, CF10 3AT, UK
cUK Catalysis Hub, Research Complex at Harwell, Science and Technology Facilities Council Rutherford Appleton Laboratory, Harwell Science and Innovation Campus, Oxon OX11 0QX, UK
First published on 3rd February 2016
Abstract
We discuss the role of QM/MM (embedded cluster) computational techniques in catalytic science, in particular their application to microporous catalysis. We describe the methodologies employed and illustrate their utility by briefly summarising work on metal centres in zeolites. We then report a detailed investigation into the behaviour of methanol at acidic sites in zeolites H-ZSM-5 and H-Y in the context of the methanol-to-hydrocarbons/olefins process. Studying key initial steps of the reaction (the adsorption and subsequent methoxylation), we probe the effect of framework topology and Brønsted acid site location on the energetics of these initial processes. We find that although methoxylation is endothermic with respect to the adsorbed system (by 17–56 kJ mol−1 depending on the location), there are intriguing correlations between the adsorption/reaction energies and the geometries of the adsorbed species, of particular significance being the coordination of methyl hydrogens. These observations emphasise the importance of adsorbate coordination with the framework in zeolite catalysed conversions, and how this may vary with framework topology and site location, particularly suited to investigation by QM/MM techniques.
I. Introduction
Computational methods are now very widely used in catalytic science and are increasingly powerful in obtaining an understanding of catalysis at the molecular level, where they yield models for both the structure and mechanism that assist and complement the interpretation of experimental data. The range and scope of the field is illustrated by the recent review of their applications in zeolite catalytic science given in ref. 1.The majority of contemporary computational studies in catalysis use electronic structure methods, especially Density Functional Theory (DFT) which is very widely applied, employing methods based on periodic boundary conditions (PBCs). Such methods have enjoyed considerable success and have indeed become increasingly predictive. An alternative approach is to use “QM/MM” or embedded cluster methods, which have been extensively used in computational chemistry and biomolecular sciences and in modelling localised states in solids. Such methods describe a finite region (which in the case of catalysis includes the active site, the reacting species and surrounding atoms) by a quantum mechanical method, while describing more distant regions of the solid by a more approximate method, often based on interatomic potentials. They have a number of advantages which will be discussed in greater detail in the following section; but it can be argued that they are inherently more appropriate for modelling a localised state, such as an active site on a surface or in an enzyme, as they focus the computational effort on the region containing the active site rather than the whole molecule or solid.
This paper will present recent applications of QM/MM techniques to the important and topical problem of catalytic methanol conversion in ZSM-5 and where we obtain new information on mechanistic aspects inspired by recent observations from neutron scattering studies.
In the next section we describe in greater detail the basis of the methodologies employed and illustrate briefly their application by reference to earlier studies of metal centres in zeolites. The subsequent section presents our study of methanol/ZSM-5 which demonstrates well the power of the techniques and yields new insight into the interaction of methanol with acidic sites in zeolites.
II. QM/MM techniques
1. Methodology
In our work, we have employed a hybrid QM/MM model of zeolites developed and implemented by Paul Sherwood and colleagues2–6 in the computational quantum-chemical environment software ChemShell7–10 as illustrated in Fig. 1.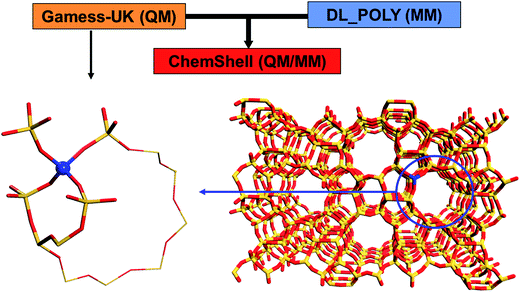 | ||
| Fig. 1 ChemShell hybrid QM/MM embedded cluster diagram. A QM region incorporates a metal centre serving as an active catalytic site. | ||
The model draws on the strengths of simple molecular cluster approaches that terminate a cluster carved out of the material with hydrogen, but also accounts for steric constraints and the elastic response of the framework. The cluster is treated with an appropriate level QM method, which is chosen as a compromise between the required accuracy and available compute resources. The ChemShell zeolite model thus has much in common with alternative subtractive mechanical embedding approaches by Sauer11–13 (implemented in QM-POT) and Morokuma14 (ONIOM). The ChemShell methodology, however, goes beyond such schemes and provides an accurate description of the electrostatic interactions between the QM region and the framework, including polarisation and embedding effects. More recently, similar approaches (although more focused on a careful termination of the QM region with specially calibrated link atoms) have been employed, for example, by Nasluzov et al.15,16 (cov-EPE) and Sushko et al.17,18 (GUESS). The native ChemShell zeolite model briefly described in this section is complemented in ChemShell with support for both the QM-POT, cov-EPE and GUESS methods. The flexible, modular approach adopted in ChemShell extends these methodologies to other classes of material, from metal oxides to enzymes. As argued above, these schemes serve as a computationally cheaper and at the same time chemically more accurate alternative to popular DFT PBC approaches.
To describe the long-range polarisation effects in these materials, the ChemShell model employs the Hill–Sauer molecular mechanical force-field19,20 with rigid ions described by modified constant point charges qSi = 1.2e and qO = −0.6e, and atoms assumed to bind to each other via polar covalent bonds. These charges have been fitted to reproduce the electrostatic field in the pores of the zeolitic framework materials described using PBCs. When we define a QM cluster embedded in a siliceous system, we have to cut through Si–O bonds that connect atoms, one in the QM and the other in the MM regions. As under-coordinated QM atoms on the QM region boundary are terminated with hydrogens, an artificial strain on the system is introduced due to spurious interactions between the hydrogen and the nearest neighbours in the MM region. To remedy this artefact, a charge on the corresponding MM atoms is shifted outwards, further onto the next nearest neighbours, whereas the dipole created by such a shift is compensated locally by a pair of point charges placed along the corresponding bonds. Further information on the method can be found in the original publications, and relevant model construction details are given below.
Next, we provide a short outline of our earlier work on metal centres in zeolites, which illustrate the power of our approach and its potential in the elucidation of the structure and properties of catalytically active sites in zeolites.
2. Applications to metal centre in zeolites
Incorporation of metal sites in zeolitic frameworks has been the subject of numerous investigations. In particular, Ti doped silicalite-1 (TS-1),21 a siliceous counterpart of ZSM-5, has been of great interest, since it is used with aqueous H2O2 as the primary oxidant in a large number of important reactions such as the epoxidation of linear olefins, oxidation of linear alkenes to alcohols and ketones, oxidation of alcohols, hydroxylation of aromatics, oxidation of amines, and oxidation of sulphur compounds and ethers.22In our work,23–25 we have proposed a number of structural models for a Ti species that would result from the framework hydrolysis and site inversion that can take place during the synthesis and post-synthetic treatment and/or, depending on the catalytic process, occur as a part of the catalytic transformation. The models of interest are shown in Fig. 2.
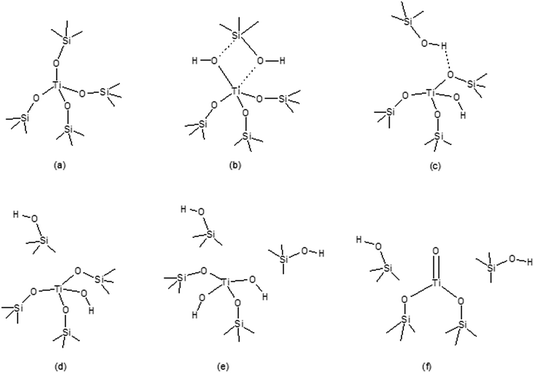 | ||
| Fig. 2 The six models used to represent the active Ti sites in TS-1: (a) tetrapodal, (b) 2MR, (c) tripodal (1I), (d) tripodal (2I), (e) bipodal, and (f) titanyl. | ||
The geometrical parameters of the tripodal sites obtained with ChemShell calculations proved to be in excellent agreement with experimental EXAFS data,26 and therefore could be usefully employed to rationalise the difference in the observed spectroscopic signature of metal centres in differently treated samples, as summarised in Table 1.
| (b) | ||||||
|---|---|---|---|---|---|---|
| Ti–O distance [Å] | Ti–Si distance [Å] | Ti–O–Si angle [°] | ||||
| Tripodal (2I) | Expt.a NH4Ac treated | Tripodal (2I) | Expt.a NH4Ac treated | Tripodal (2I) | Expt.a NH4Ac treated | |
| a Ref. 26. b Refers to the Ti–OH bond. | ||||||
| Ti | 1.78 | 1.81 ± 0.02 | 3.16 | 3.23 ± 0.02 | 137 | 142 ± 5 |
| 1.79 | 3.16 | 3.23 ± 0.02 | 137 | 142 ± 5 | ||
| 1.80 | 3.34 | 3.37 ± 0.02 | 157 | 161 ± 5 | ||
| 1.75b | ||||||
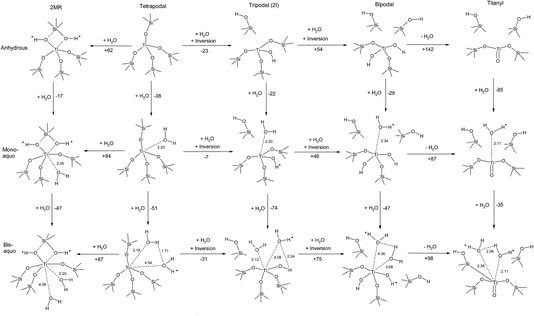
Our analysis of site transformation in the presence of water, illustrated in Fig. 3,27 allowed us to draw the crucial conclusion that the catalytically active sites in TS-1 are hydrated tripodal rather than tetrapodal, which is strikingly similar to Ti doped mesoporous materials that had been previously explored using simple cluster models.28
Further, we consider the site reactivity towards H2O2 in anhydrous and hydrous conditions according to the reaction pathways drawn in Fig. 4 and 5.29
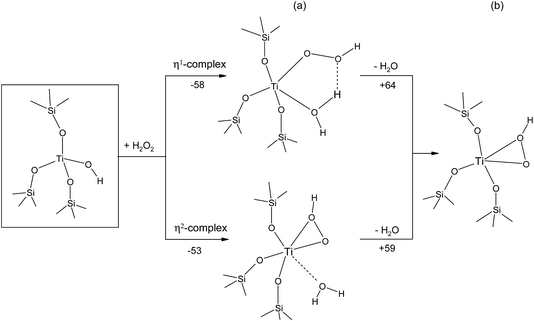 | ||
| Fig. 4 Reaction pathways for the Ti–η1(OOH) and Ti–η2(OOH) formation (a) with and (b) without one water. Energies in kJ mol−1. | ||
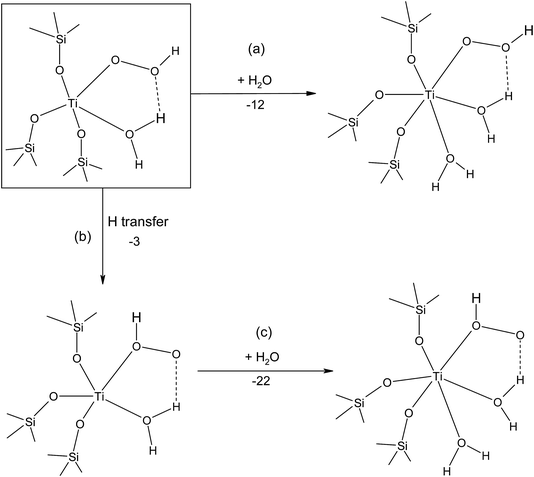 | ||
| Fig. 5 Reaction pathways for the formation of (a) six-coordinated Ti–η1(OOH), (b) five-coordinated Ti–η1(OOH) and (c) six-coordinated Ti–η1(O(H)OH) species. Energies in kJ mol−1. | ||
Our calculations confirmed the close competition between the η1 and η2 complexes as candidates for the oxygen donating species in TS-1. Curiously, a much higher energy (by ca. 400–450 kJ mol−1) superoxide radical species has also been reported (from EPR studies) to emerge as a result of interaction of aqueous H2O2 and non-aqueous urea H2O2.30 Our calculations unambiguously identified the superoxide supported on tripodal Ti as the magnetically active centre with the spectroscopic signature in close agreement with the experiment as shown in Table 2.
From this short outline, we conclude that the hybrid QM/MM methodology implemented in ChemShell provides us with a reliable tool to investigate both the structure and physical and chemical properties of active sites in zeolites. In the next section we employ ChemShell in a study of methoxylation of two zeolites with very different behaviour.
III. Methanol-active site interactions in zeolites
The zeolite catalysed conversion of methanol to hydrocarbons (MTH) has been researched significantly since its initial discovery by Chang and Silvestri,31 with the first commercialization of the MTH process in New Zealand in 1985.32 Demand for light olefins has also lead to extensive research into the use of zeolitic catalysts for converting methanol to olefins (MTO).33An early step of interest in the reaction mechanism is the formation of framework methoxy species after initial physisorption of methanol through H-bonding to the zeolite Brønsted acid site.34–36 However, studying such species experimentally is difficult, as secondary reactions dominate rapidly at higher temperatures.37 Recent studies using neutron scattering38 have observed the total conversion of methanol to framework methoxy at room temperature in commercial samples of H-ZSM-5 (in contrast to previous experiments discussed in ref. 38, which suggest that elevated temperatures are necessary), which is, however, not observed in commercial samples of H-Y with the same Si/Al ratio. This difference was attributed to the necessary dealumination procedure for high silica H-Y synthesis (creating defects which decrease the activity). However, detailed theoretical studies into the effect of framework topology on methanol behaviour in zeolite catalysts are necessary for improved understanding and further catalyst design. A short discussion of theoretical studies of methanol behaviour in zeolite catalysts will now follow.
Though the MTG/MTO process has received a significant amount of attention from a theoretical perspective,39,40 the aforementioned earlier steps are not understood in detail. Ab initio studies of methanol adsorption began with small aluminosilicalite clusters.41,42 Numerous studies using three tetrahedral site clusters have concluded that the hydrogen bonding of the methanol oxygen with the Brønsted acid hydroxyl is exothermic, generally calculating adsorption energies of between 50 and 100 kJ mol−1.35,36,43–45 It has also been found that there is an energetic difference between ‘side-on’ and ‘end-on’ adsorption, with the end-on geometry (where the methyl group protrudes almost perpendicularly from the aluminosilicate cluster) calculated to be more favourable, and methoxylation taking place via the rapid equilibration between the end-on and side-on geometry.43,46 All studies into the methoxylation process using clusters conclude a barrier to methoxylation with values of ∼180–225 kJ mol−1.35,36,43,45,46 Methoxylation and adsorption has also been studied in periodic zeolite structures, with static calculations showing endothermic methoxylation in chabazite (with a barrier of 56 kJ mol−1),47 and DFT-MD giving an adsorption energy of −94 kJ mol−1.48 Andzelm and Govind49 studied the methoxylation process in a periodic ferrierite structure, finding a methoxylation barrier of 226 kJ mol−1. However, it was found that when a second methanol molecule was added to the system, the barrier to methoxylation was then reduced by 42 kJ mol−1 due to the formation of hydrogen bonding networks spanning the width of the channel, which significantly stabilise the methoxylation transition states.
We note that the use of a discrete cluster model is less accurate than the use of a periodic zeolite structure, due to the lack of any long-range electrostatic potential influencing the system energetics. However, as noted earlier, in addition to being computationally expensive in calculations involving large unit cells, the use of periodic boundary conditions can bring problems when calculating reaction barriers and adsorption energetics, such as incomplete relaxation of the system or the influence of the interaction between sorbate mirror images. This problem can be especially significant when comparing the effect of the framework structure on sorbate behaviour. A large zeolite unit cell would minimise the effect of these sorbate–sorbate interactions on the methoxylation process compared to, say, chabazite where they may become significant. These complications can be bypassed using the quantum mechanical/molecular mechanical (QM/MM) embedded cluster technique9,50 outlined in the previous section, where large framework structures may be modelled relatively cheaply, providing an accurate electrostatic potential that will affect the behaviour and reactivity at an active site.
We present a comparison of the deprotonation, methanol adsorption, and methoxylation energies in H-ZSM-5 and H-Y zeolite frameworks, in an attempt to investigate the effect of framework topology and active site location on reactive sorbate behaviour. The deprotonation energy is first investigated as it is a major factor controlling the Brønsted acidity of the differing frameworks; our calculations include a comparison of three different sites in the ZSM-5 structure. The adsorption energy of methanol at these sites is then compared to quantify the differences in interaction strength between methanol and the differing acidic hydroxyl sites, after which the methoxylation energy is then calculated to quantify the effect of these differing environments on the reaction.
1. Methodology
We first discuss the construction of the embedded cluster models for the H-Y and H-ZSM-5. We begin with the purely siliceous spherical structure generated from the periodic experimental unit cell structure of silicalite51 and siliceous faujasite.52 The use of the experimental unit cell is assumed to have minimal effects on the geometric and electronic structure. Each spherical cluster centres on a Si T-site.Only one cluster is generated for the H-Y structure as the tetrahedral sites are equivalent, which, however, is not the case for H-ZSM-5. Therefore, three embedded clusters are generated based on three sites in the ZSM-5 structure:53 a T-site at the straight channel (M7-T1), the sinusoidal channel (Z6-T4) and the channel intersections (I2-T12). The clusters, including their locations in the MFI structure are shown in Fig. 6.54
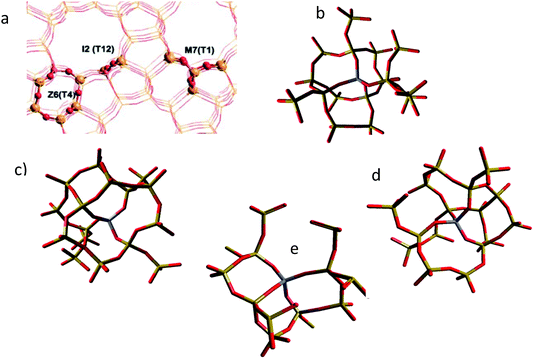 | ||
| Fig. 6 (a) The locations of the I2, Z6 and M7 clusters in the MFI framework (reproduced from ref. 54 with permission from the PCCP Owner Societies), and the optimised QM clusters for the (b) I2, (c) M7, (d) Z6 sections of the MFI framework, along with the optimised QM cluster in the zeolite Y calculations (e). The central T-site is coloured purple. | ||
The QM region is expanded from the central atom to include the fifth neighbour, i.e. the third oxygen atom away from the T-site as shown in Fig. 6. The cluster is then terminated with hydrogen atoms. We also include two concentric regions of molecular mechanics (MM) atoms spherically around this QM cluster (Fig. 7). The MM atoms in the first concentric region are allowed to relax during the energy calculation; this region reaches a radius of 10.58 Å (20 bohr) from the central atom. Beyond this region, the framework atoms in the next concentric region are fixed, reaching a radius of 21.17 Å (40 bohr) from the central T-site. The total number of atoms in each cluster was 1653 for H-Y, 2165 for H-ZSM-5 (I2), 2180 for H-ZSM-5 (M7) and 2155 for H-ZSM-5 (Z6). Due to the termination of the incomplete bonds in the QM cluster by hydrogen atoms upon embedding into the MM region, a bond-dipole correction must, as noted above, be added to the boundaries of the MM region.5
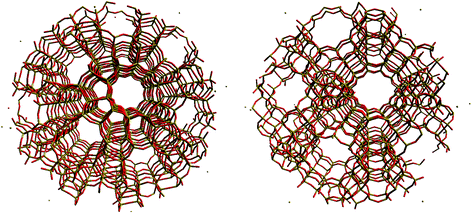 | ||
| Fig. 7 Spherical embedded cluster models of the I2-T12 centred H-ZSM-5 system (left) and the zeolite Y system (right). | ||
The MM interactions are represented using the forcefield of Hill and Sauer,19,20 and the QM atoms are treated using the Ahlrichs and Taylor TZVP Gaussian basis sets.55 Three exchange–correlation functionals are used in our calculations: the GGA functional of Perdew and Wang (PW91),56 and the first and second generation hybrid functionals of Becke, Lee, Yang and Parr (B3LYP)57–60 and Wilson, Bradley and Tozer (B97-2) trained by the reproduction of accurate thermodynamic properties of atoms and small molecules.61
The calculation of the energy and gradients of the QM region used the Gamess-UK package,62 and the calculation of the energy and gradients of the MM region employed the DL_POLY package,63 with the QM and MM calculations coupled in the ChemShell environment.53 Electronic minimisation was deemed complete for the QM system when the energy variation was below a threshold of 2.72 × 10⁻⁶ eV was achieved (1 × 10⁻⁷ Ha). The geometries were optimised using the Limited-Memory Broyden–Fletcher–Goldfarb–Shanno (L-BFGS)64–67 algorithm with a convergence threshold of 0.015 eV Å−1.
2. Results and discussion
| Edp = EzeoH − Ezeo−. | (1) |
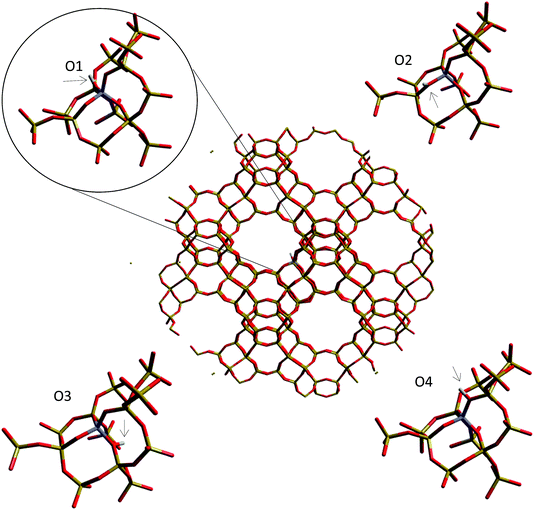 | ||
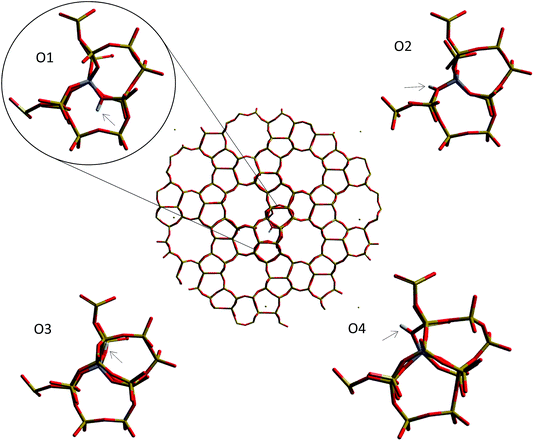
| Fig. 8 Oxygen sites from which the deprotonation energy is calculated around the aluminium substitution in the H-Y cluster. | ||
 | ||
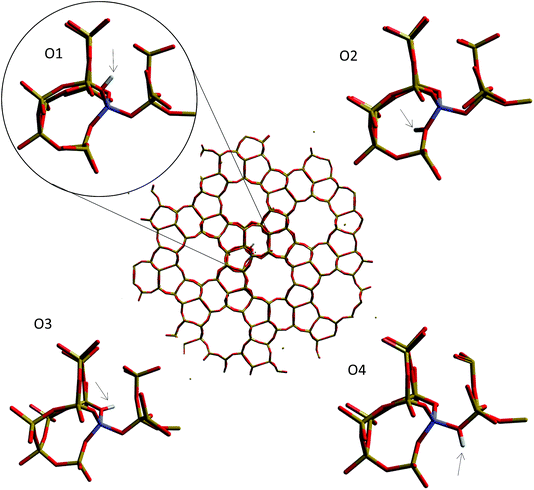
| Fig. 9 Oxygen sites around the aluminium substitution in the H-ZSM-5 (I2-T12) cluster for which the deprotonation energy is calculated. | ||
 | ||
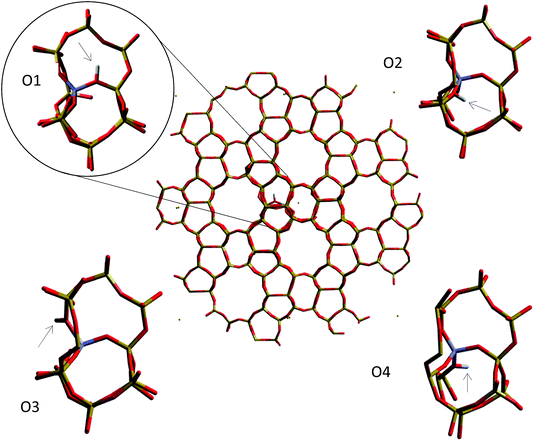
| Fig. 10 Oxygen sites around the aluminium substitution in the H-ZSM-5 (M7-T1) cluster for which the deprotonation energy is calculated. | ||
 | ||
| Fig. 11 Oxygen sites around the aluminium substitution in the H-ZSM-5 (Z6-T4) cluster for which the deprotonation energy is calculated. | ||
| E dp kJ mol−1 | ||||
|---|---|---|---|---|
| Cluster | O1 | O2 | O3 | O4 |
| HY | 1013.4 | 1041.0 | 1031.8 | 1023.0 |
| H-ZSM-5 (I2) | 1099.2 | 1106.3 | 1093.4 | 1122.0 |
| H-ZSM-5 (M7) | 1123.6 | 1114.7 | 1103.6 | 1109.5 |
| H-ZSM-5 (Z6) | 1059.5 | 1020.9 | 1042.9 | 1061.0 |
Using the PW91 functional, the most acidic oxygen sites are O1 for H-Y, O3 for H-ZSM-5 (I2), O3 for H-ZSM-5 (M7) and O2 for H-ZSM-5 (Z6). The difference between the lowest and highest deprotonation energies, which are respectively H-Y and H-ZSM-5 (M6), is 90.2 kJ mol−1. H-Y has the lowest deprotonation energy of the series, followed by ZSM-5 (Z6) located in the sinusoidal channel, ZSM-5 (I2) in the intersections, and the T-site with the highest deprotonation energy is in the straight channel (M7).
We now study the deprotonation energies of the most acidic sites in each structure using the B3LYP and B97-2 hybrid exchange–correlation functionals, as listed in Table 4. The deprotonation energies calculated using the B3LYP functional were higher than when using the PW91 functional, and higher still using the B97-2 functional, which can be attributed to the superior representation of the localised electrons in the zeolite due to the exact exchange interaction from Hartree–Fock methods incorporated into the hybrid functionals. However, the ranking of the deprotonation energy is maintained as H-Y < H-ZSM-5 (Z6) < H-ZSM-5 (I2) < H-ZSM-5 (M7) for all functionals. The deprotonation energy of 1093.4 kJ mol-1 calculated for ZSM-5 (I2) is 122 kJ mol−1 lower than obtained by ab initio molecular dynamics for the MFI structure,70 using the same PW91 functional. Possible reasons for this difference could be the aforementioned sorbate–sorbate interactions, the more complete representation of polarisation afforded using the QM/MM method, or the charge compensation parameters needed for periodic DFT calculations. We also note that ref. 70 used a different intersectional T-site (T7) from ours (T12). On the whole our results correlate well with the data from the other computational studies in the literature.16,72,73
| E dp | |||
|---|---|---|---|
| Cluster | PW91 | B3LYP | B97-2 |
| HY | 1013.4 | 1065.9 | 1081.3 |
| H-ZSM-5 (I2) | 1093.4 | 1100.4 | 1114.1 |
| H-ZSM-5 (M7) | 1103.6 | 1155.9 | 1166.1 |
| H-ZSM-5 (Z6) | 1020.9 | 1084.7 | 1101.9 |
| Eads = (EMeOH+ZeoH − EBSSE) − (EMeOH + EZeoH), | (2) |
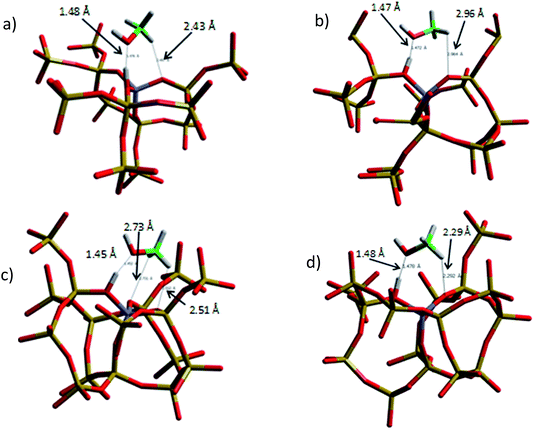 | ||
| Fig. 12 Optimised adsorbed geometry of methanol in (a) H-Y, (b) H-ZSM-5 (I2), (c) H-ZSM-5 (M7), and (d) H-ZSM-5 (Z6). | ||
We have studied the ‘side-on’ adsorption in all zeolite systems. Though we note in previous studies that ‘end-on’ adsorption is preferred,43,46 the side-on adsorption is more conducive to methoxylation, as is the emphasis of this study, and the barriers to this switching between the geometries are very small and may be overcome under experimental conditions. From Fig. 12 it is observed that the H-bond length between the hydroxyl site and the methanol hydroxyl is 1.476 Å for the H-Y cluster and 1.452–1.478 Å for the H-ZSM-5 clusters, with the shortest H-bond being in the M7-T1 cluster despite having the highest deprotonation energy. However, we note that the range of bond distances of 0.026 Å is quite small and so a correlation with deprotonation energies is not necessarily meaningful.
We should note that the BSSE values were calculated with the B3LYP functional only. As an approximation, we have then taken the percentage error (5.5%) that these values contribute to each system and applied it to the adsorption energy calculations using the PW91 and B97-2 functionals. The calculated adsorption energies are listed in Table 5 after subtraction of this percentage error.
| Cluster | PW91 | B3LYP | B97-2 |
|---|---|---|---|
| HY | −180.2 | −179.6 | −180.4 |
| H-ZSM-5 (I2) | −186.8 | −177.5 | −168.9 |
| H-ZSM-5 (M7) | −215.1 | −194.8 | −206.9 |
| H-ZSM-5 (Z6) | −147.24 | −136.6 | −136.7 |
For all functionals, the order of methanol adsorption energy is H-ZSM-5 (M7) < H-Y < H-ZSM-5 (I2) < H-ZSM-5 (Z6). We note that the difference in adsorption between the most favourable site, H-ZSM-5 (M7), and the least favourable site, H-ZSM-5 (Z6), is between 60 and 70 kJ mol−1, depending on the functional used. The methanol in the H-ZSM-5 (M7) system is H-bonded to two framework oxygens by two C–H hydrogens (depicted in Fig. 12c), suggesting that this geometry is more favourable than a short, single C–H⋯O bond, as is demonstrated by the less favourable adsorption energy in the H-ZSM-5 (Z6) system. It may be significant that the most favourable adsorption process also occurs at the site with the highest deprotonation energy, but we also see that the site with the lowest deprotonation energy (H-Y) has the second lowest adsorption energy. The calculated adsorption energy for methanol in ZSM-5 (M7) appears anomalous when considering the overall correlation between deprotonation and methanol adsorption energies for FAU and MFI, however it is perhaps more reasonable to consider that there should not be a correlation at all, and in fact the adsorption energy is dominated by the H-bonding capability of the methyl group of the methanol. We note that previous calculations of Svelle et al. reported a weaker adsorption for methanol at the I2-T12 site than we present here: Eads was calculated as −86 and −114 kJmol-1 when using a periodic model with the PBE and PBE-D exchange-correlation functionals, respectively.75 Preliminary comparative calculations indicate that the electrostatic embedding environment makes a stronger contribution to our adsorption energy, but the significant contrast between our model and that of Svelle et al. necessitates further investigation before any certain conclusions can be drawn.
| Emethox = EZeoMe(aq) − (EMeOH + EZeoH), | (3) |
| System | E methox | E ads − Emethox |
|---|---|---|
| Me-Y + H2O | −162.0 | +17.6 |
| Me-ZSM-5 (I2) + H2O | −150.4 | +27.1 |
| Me-ZSM-5 (M7) + H2O | −138.6 | +56.2 |
| Me-ZSM-5 (Z6) + H2O | −118.0 | +18.6 |
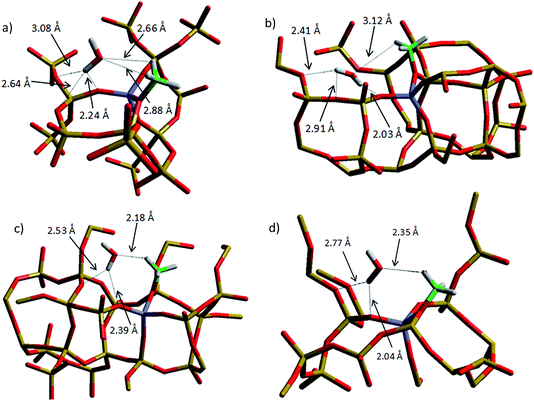 | ||
| Fig. 13 Optimised geometries of the methoxylated structures of (a) HY (b) H-ZSM-5 (I2), (c) H-ZSM-5 (M7), and (d) H-ZSM-5 (Z6). | ||
Firstly, we note that all the methoxylation energies are exothermic overall but are endothermic with regard to the adsorbed methanol molecule, as observed in previous cluster simulations35 and in the periodic chabazite structure.42 We observe that the order of the methoxylation energy is H-Y < H-ZSM-5 (I2) < H-ZSM-5 (M7) < H-ZSM5-I2 (Z6), in agreement with deprotonation energies but in contrast to the order of methanol adsorption energies shown in the previous section. This suggests that the tendency of methoxylation is not related directly to the adsorption energy, at least when only one methanol molecule is present in the immediate environment.
Finally, we turn our attention to the geometries of the methoxylated system. The most exothermic methoxylation takes place in H-Y, which is also the more coordinated system: the water molecule is coordinated to three framework oxygen sites. Threefold coordination is also the case for the ZSM-5 (I2) system, which has the second most exothermic methoxylation energy, but for H-Y the water molecule is also coordinated to two of the methyl hydrogens. The H-bonds associated with the H-Y system are not the shortest of all the configurations: the shortest is 2.24 Å, compared to 2.04 Å in the ZSM-5 (Z6) system. However, the longer H-bonds in H-Y are compensated by their increased quantity, thus highlighting the importance of highly coordinated structures in stabilising the system when considering the interaction of sorbates such as methanol with the active sites of acidic zeolite catalysts.
Using the QM/MM methodology we have, therefore, obtained new insights into the interaction, and reaction, of methanol with zeolite acidic sites and discussed how this may change with framework structure and aluminium location. Future work will use the embedded cluster models to investigate the barriers of methoxylation in zeolites using transition state searches. The effect of including multiple methanol molecules will also be investigated as the formation of H-bonded networks reduces the total methoxylation barrier for the FER framework,49 thus further emphasising the importance of highly coordinated systems in controlling the barrier of such reactive processes.
IV. Summary and conclusions
QM/MM methods clearly have a major role to play in the study of catalytic systems. Earlier work demonstrated their efficacy in modelling active sites in zeolites. Here, we investigated the energetics of deprotonation, methanol adsorption and methoxylation in two acidic zeolite catalysts. Embedded cluster systems have been used to model zeolites H-Y and H-ZSM-5, with acidic sites centred in the straight channel, sinusoidal channel and intersection region of the latter system. The hierarchy of deprotonation energies was calculated as H-Y < H-ZSM-5 (Z6) < H-ZSM-5 (I2) < H-ZSM-5 (M7). The side-on adsorption energy of methanol in each structure was also calculated, giving a trend of H-ZSM-5 (M7) < H-Y < H-ZSM-5 (I2) < H-ZSM-5 (Z6). The most favourable adsorption site, which was H-ZSM-5 (M7), exhibited an adsorbed geometry where two methyl hydrogens were able to hydrogen bond to framework oxygen atoms, suggesting that the H-bonding behaviour of the methyl group may be dominant in controlling the adsorption energy. The methoxylation energy was calculated, giving a trend of H-Y < H-ZSM-5 (I2) < H-ZSM 5 (M7) < H-ZSM5-I2 (Z6). The ordering of our results suggests the total exothermicity of methoxylation is not dependent on the adsorption energy of methanol. However, the effect of increased framework coordination, including H-bonding of methyl groups, was emphasised as the most coordinated system gave the lowest energy configuration, similar to our observations for methanol adsorption.The present paper shows the role of the QM/MM modelling techniques in zeolite catalysis, as well as the limitations in using the deprotonation energy as a measure of catalytic reactivity for a material. We believe that QM/MM modelling in catalytic science can, however, be made much broader.
Acknowledgements
We are indebted to our early collaborator Judy To for her work on metal doped zeolites, reviewed in this paper, and ChemShell developers Paul Sherwood and Tom Keal for support with ChemShell calculations. Via our membership of the UK's HEC Materials Chemistry Consortium, which is funded by the EPSRC (EP/L000202), this work used the ARCHER UK National Supercomputing Service (http://www.archer.ac.uk). The authors acknowledge further the use of the UCL Legion High Performance Computing Facility (Legion@UCL), and associated support services, in the completion of this work. The authors would like to acknowledge the Engineering and Physical Sciences Research Council, Grant No. EP/K014668/1 and Grant No. EP/G036675/1 for financial support under their Centres for Doctoral Training scheme, the STFC and the ISIS Pulsed Neutron and Muon Source for funding and sponsorship. AJL is grateful to the Ramsay Memorial Fund and UCL Chemistry for research fellowship funding. UK Catalysis Hub is kindly thanked for resources and support provided via our membership of the UK Catalysis Hub Consortium and funded by the EPSRC (grants EP/K014706/1, EP/K014668/1, EP/K014854/1 EP/K014714/1 and EP/M013219/1).References
- V. Van Speybroeck, K. Hemelsoet, L. Joos, M. Waroquier, R. G. Bell and C. R. A. Catlow, Chem. Soc. Rev., 2015, 44, 7044–7111 RSC.
- S. P. Greatbanks, P. Sherwood and I. H. Hillier, J. Phys. Chem., 1994, 98, 8134–8139 CrossRef CAS.
- S. P. Greatbanks, P. Sherwood, I. H. Hillier, R. J. Hall, N. A. Burton and I. R. Gould, Chem. Phys. Lett., 1995, 234, 367–372 CrossRef CAS.
- S. P. Greatbanks, I. H. Hillier, N. A. Burton and P. Sherwood, J. Chem. Phys., 1996, 105, 3770–3776 CrossRef CAS.
- P. Sherwood, A. H. de Vries, S. J. Collins, S. P. Greatbanks, N. A. Burton, M. A. Vincent and I. H. Hillier, Faraday Discuss., 1997, 106, 79–92 RSC.
- S. P. Greatbanks, I. H. Hillier and P. Sherwood, J. Comput. Chem., 1997, 18, 562–568 CrossRef CAS.
- P. Sherwood, A. H. de Vries, M. F. Guest, G. Schreckenbach, C. R. A. Catlow, S. A. French, A. A. Sokol, S. T. Bromley, W. Thiel, A. J. Turner, S. Billeter, F. Terstegen, S. Thiel, J. Kendrick, S. C. Rogers, J. Casci, M. Watson, F. King, E. Karlsen, M. Sjøvoll, A. Fahmi, A. Schäfer and C. Lennartz, J. Mol. Struct.: THEOCHEM, 2003, 632, 1–28 CrossRef CAS.
- S. Metz, J. Kaestner, A. A. Sokol, T. W. Keal and P. Sherwood, Wiley Interdiscip. Rev.: Comput. Mol. Sci., 2014, 4, 101–110 CrossRef CAS.
- A. A. Sokol, S. T. Bromley, S. A. French, C. R. A. Catlow and P. Sherwood, Int. J. Quantum Chem., 2004, 99, 695–712 CrossRef CAS.
- D. Berger, A. J. Logsdail, H. Oberhofer, M. R. Farrow, C. R. A. Catlow, P. Sherwood, A. A. Sokol, V. Blum and K. Reuter, J. Chem. Phys., 2014, 141, 024105 CrossRef PubMed.
- M. Sierka and a. Joachim Sauer, Faraday Discuss., 1997, 106, 41–62 RSC.
- U. Eichler, M. Brandle and J. Sauer, J. Phys. Chem. B, 1997, 101, 10035–10050 CrossRef CAS.
- J. Sauer, U. Eichler, U. Meier, A. Schafer, M. von Arnim and R. Ahlrichs, Chem. Phys. Lett., 1999, 308, 147–154 CrossRef CAS.
- L. W. Chung, W. M. C. Sameera, R. Ramozzi, A. J. Page, M. Hatanaka, G. P. Petrova, T. V. Harris, X. Li, Z. F. Ke, F. Y. Liu, H. B. Li, L. N. Ding and K. Morokuma, Chem. Rev., 2015, 115, 5678–5796 CrossRef CAS PubMed.
- V. A. Nasluzov, E. A. Ivanova, A. M. Shor, G. N. Vayssilov, U. Birkenheuer and N. Rösch, J. Phys. Chem. B, 2003, 107, 2228 CrossRef CAS.
- E. A. Ivanova Shor, A. M. Shor, V. A. Nasluzov, G. N. Vayssilov and N. Rösch, J. Chem. Theory Comput., 2005, 1, 459–471 CrossRef PubMed.
- A. S. Mysovsky, P. V. Sushko, S. Mukhopadhyay, A. H. Edwards and A. L. Shluger, Phys. Rev. B: Condens. Matter Mater. Phys., 2004, 69, 10 CrossRef.
- A. H. Edwards, P. V. Sushko, A. L. Shluger and V. B. Sulimov, IEEE Trans. Nucl. Sci., 2002, 49, 1383–1388 CrossRef CAS.
- J. R. Hill and J. Sauer, J. Phys. Chem., 1994, 98, 1238–1244 CrossRef CAS.
- J. R. Hill and J. Sauer, J. Phys. Chem., 1995, 99, 9536–9550 CrossRef CAS.
- M. Taramasso, G. Perego and B. Notari, US Pat., 4410501, 1983.
- S. Bordiga, A. Damin, G. Berlier, F. Bonino, G. Ricchiardi, A. Zecchina and C. Lamberti, Int. J. Mol. Sci., 2001, 2, 167 CrossRef CAS.
- S. A. French, A. A. Sokol, J. To, C. R. A. Catlow, N. S. Phala, G. Klatt and E. van Steen, Catal. Today, 2004, 93–5, 535–540 CrossRef.
- J. To, P. Sherwood, A. A. Sokol, I. J. Bush, C. R. A. Catlow, H. J. J. van Dam, S. A. French and M. F. Guest, J. Mater. Chem., 2006, 16, 1919–1926 RSC.
- J. To, A. A. Sokol, S. A. French, C. R. A. Catlow, P. Sherwood and H. J. J. van Dam, Angew. Chem., Int. Ed., 2006, 45, 1633–1638 CrossRef CAS PubMed.
- D. Gleeson, G. Sankar, C. R. A. Catlow, J. M. Thomas, G. Spano, S. Bordiga, A. Zecchina and C. Lamberti, Phys. Chem. Chem. Phys., 2000, 2, 4812–4817 RSC.
- J. To, A. A. Sokol, S. A. French and C. R. A. Catlow, J. Phys. Chem. C, 2007, 111, 14720–14731 CAS.
- C. M. Barker, D. Gleeson, N. Kaltsoyannis, C. R. A. Catlow, G. Sankar and J. M. Thomas, Phys. Chem. Chem. Phys., 2002, 4, 1228–1240 RSC.
- J. To, A. A. Sokol, S. A. French and C. R. A. Catlow, J. Phys. Chem. C, 2008, 112, 7173–7185 CAS.
- V. N. Shetti, P. Manikandan, D. Srinivas and P. Ratnasamy, J. Catal., 2003, 216, 461–467 CrossRef CAS.
- C. D. Chang and A. J. Silvestri, J. Catal., 1977, 47, 249–259 CrossRef CAS.
- C. Maiden, Stud. Surf. Sci. Catal., 1988, 36, 1–16 CrossRef CAS.
- U. Olsbye, S. Svelle, M. Bjørgen, P. Beato, T. V. Janssens, F. Joensen, S. Bordiga and K. P. Lillerud, Angew. Chem., Int. Ed., 2012, 51, 5810–5831 CrossRef CAS PubMed.
- R. Shah, J. D. Gale and M. C. Payne, J. Phys. Chem., 1996, 100, 11688–11697 CrossRef CAS.
- S. R. Blaszkowski and R. A. van Santen, J. Phys. Chem. B, 1997, 101, 2292–2305 CrossRef CAS.
- P. E. Sinclair and C. R. A. Catlow, J. Chem. Soc., Faraday Trans., 1997, 93, 333–345 RSC.
- Z.-M. Cui, Q. Liu, S.-W. Bain, Z. Ma and W.-G. Song, J. Phys. Chem. C, 2008, 112, 2685–2688 CAS.
- A. J. O'Malley, S. F. Parker, A. Chutia, M. R. Farrow, I. P. Silverwood, V. García-Sakai and C. R. A. Catlow, Chem. Commun., 2016, 52, 2897–2900 RSC.
- D. Lesthaeghe, V. Van Speybroeck, G. B. Marin and M. Waroquier, Ind. Eng. Chem. Res., 2007, 46, 8832–8838 CrossRef CAS.
- K. Hemelsoet, J. Van der Mynsbrugge, K. De Wispelaere, M. Waroquier and V. Van Speybroeck, ChemPhysChem, 2013, 14, 1526–1545 CrossRef CAS PubMed.
- R. Vetrivel, C. Catlow and E. Colbourn, J. Phys. Chem., 1989, 93, 4594–4598 CrossRef CAS.
- J. Gale, C. Catlow and J. Carruthers, Chem. Phys. Lett., 1993, 216, 155–161 CrossRef CAS.
- C. Zicovich-Wilson, P. Viruela and A. Corma, J. Phys. Chem., 1995, 99, 13224–13231 CrossRef CAS.
- P. Sinclair and C. Catlow, J. Chem. Soc., Faraday Trans., 1996, 92, 2099–2105 RSC.
- S. R. Blaszkowski and R. A. van Santen, J. Am. Chem. Soc., 1996, 118, 5152–5153 CrossRef CAS.
- S. Blaszkowski and R. Van Santen, J. Phys. Chem., 1995, 99, 11728–11738 CrossRef CAS.
- J. Gale, R. Shah, M. Payne, I. Stich and K. Terakura, Catal. Today, 1999, 50, 525–532 CrossRef CAS.
- F. Haase, J. Sauer and J. Hutter, Chem. Phys. Lett., 1997, 266, 397–402 CrossRef CAS.
- J. Andzelm, N. Govind, G. Fitzgerald and A. Maiti, Int. J. Quantum Chem., 2003, 91, 467–473 CrossRef CAS.
- D. Berger, A. J. Logsdail, H. Oberhofer, M. R. Farrow, C. R. A. Catlow, P. Sherwood, A. A. Sokol, V. Blum and K. Reuter, J. Chem. Phys., 2014, 141, 024105 CrossRef PubMed.
- G. Artioli, C. Lamberti and G. Marra, Acta Crystallogr., Sect. B: Struct. Sci., 2000, 56, 2–10 Search PubMed.
- J. Hriljac, M. Eddy, A. Cheetham, J. Donohue and G. Ray, J. Solid State Chem., 1993, 106, 66–72 CrossRef CAS.
- P. Sherwood, A. H. de Vries, M. F. Guest, G. Schreckenbach, C. R. A. Catlow, S. A. French, A. A. Sokol, S. T. Bromley, W. Thiel and A. J. Turner, J. Mol. Struct.: THEOCHEM, 2003, 632, 1–28 CrossRef CAS.
- D. Nachtigallova, P. Nachtigall and O. Bludský, Phys. Chem. Chem. Phys., 2004, 6, 5580–5587 RSC.
- R. Ahlrichs and P. Taylor, J. Chim. Phys. Phys.–Chim. Biol., 1981, 78, 315–324 CAS.
- J. P. Perdew and Y. Wang, Phys. Rev. B: Condens. Matter Mater. Phys., 1992, 45, 13244 CrossRef.
- A. D. Becke, J. Chem. Phys., 1993, 98, 5648–5652 CrossRef CAS.
- C. Lee, W. Yang and R. G. Parr, Phys. Rev. B: Condens. Matter Mater. Phys., 1988, 37, 785 CrossRef CAS.
- S. Vosko, L. Wilk and M. Nusair, Can. J. Phys., 1980, 58, 1200–1211 CrossRef CAS.
- P. Stephens, F. Devlin, C. Chabalowski and M. J. Frisch, J. Phys. Chem., 1994, 98, 11623–11627 CrossRef CAS.
- P. J. Wilson, T. J. Bradley and D. J. Tozer, J. Chem. Phys., 2001, 115, 9233–9242 CrossRef CAS.
- M. F. Guest, I. J. Bush, H. J. Van Dam, P. Sherwood, J. M. Thomas, J. H. Van Lenthe, R. W. Havenith and J. Kendrick, Mol. Phys., 2005, 103, 719–747 CrossRef CAS.
- W. Smith, C. Yong and P. Rodger, Mol. Simul., 2002, 28, 385–471 CrossRef CAS.
- C. Broyden, Math. Comput., 1970, 24, 365–382 CrossRef.
- R. Fletcher, Comput. J., 1970, 13, 317–322 CrossRef.
- D. Goldfarb, Math. Comput., 1970, 24, 23–26 CrossRef.
- D. F. Shanno, Math. Comput., 1970, 24, 647–656 CrossRef.
- W. Mortier, J. Sauer, J. Lercher and H. Noller, J. Phys. Chem., 1984, 88, 905–912 CrossRef CAS.
- J. Sauer, J. Mol. Catal., 1989, 54, 312–323 CrossRef CAS.
- F. Haase and J. Sauer, Microporous Mesoporous Mater., 2000, 35, 379–385 CrossRef.
- W. Jost, J. Chem. Phys., 1933, 1, 466–475 CrossRef CAS.
- M. Sierka, U. Eichler, J. Datka and J. Sauer, J. Phys. Chem. B, 1998, 102, 6397–6404 CrossRef CAS.
- A. J. Jones and E. Iglesia, ACS Catal., 2015, 5, 5741–5755 CrossRef CAS.
- S. F. Boys and F. d. Bernardi, Mol. Phys., 1970, 19, 553–566 CrossRef CAS.
- S. Svelle, C. Tuma, X. Rozanska, T. Kerber and J. Sauer, J. Am. Chem. Soc., 2008, 131, 816 CrossRef PubMed.
| This journal is © The Royal Society of Chemistry 2016 |

