 Open Access Article
Creative Commons Attribution 3.0 Unported Licence
Photo-spectroscopy of mixtures of catalyst particles reveals their age and type†
M. M.
Kerssens
a,
A.
Wilbers
b,
J.
Kramer
b,
P.
de Peinder
c,
G.
Mesu
d,
B. J.
Nelissen
e,
E. T. C.
Vogt
ae and
B. M.
Weckhuysen
*a
aInorganic Chemistry and Catalysis, Debye Institute for Nanomaterials Science, Utrecht University, Universiteitslaan 99, 3584 CG Utrecht, The Netherlands. E-mail: b.m.weckhuysen@uu.nl
bDSM Resolve, Urmonderbaan 22, Geleen, The Netherlands
cVibspec, Haaftenlaan 28, 4006 XL Tiel, The Netherlands
dAlbemarle Corporation, 13000 Bay Park Road, Pasadena, TX 77507, USA
eAlbemarle Catalysts Company BV, Nieuwendammerkade 1-3, 1022 AB Amsterdam, The Netherlands
First published on 21st April 2016
Abstract
Within a fluid catalytic cracking (FCC) unit, a mixture of catalyst particles that consist of either zeolite Y (FCC-Y) or ZSM-5 (FCC-ZSM-5) is used in order to boost the propylene yield when processing crude oil fractions. Mixtures of differently aged FCC-Y and FCC-ZSM-5 particles circulating in the FCC unit, the so-called equilibrium catalyst (Ecat), are routinely studied to monitor the overall efficiency of the FCC process. In this study, the age of individual catalyst particles is evaluated based upon photographs after selective staining with substituted styrene molecules. The observed color changes are linked to physical properties, such as the micropore volume and catalytic cracking activity data. Furthermore, it has been possible to determine the relative amount of FCC-Y and FCC-ZSM-5 in an artificial series of physical mixtures as well as in an Ecat sample with unknown composition. As a result, a new practical tool is introduced in the field of zeolite catalysis to evaluate FCC catalyst performances on the basis of photo-spectroscopic measurements with an off-the-shelf digital single lens reflex (DSLR) photo-camera with a macro lens. The results also demonstrate that there is an interesting time and cost trade-off between single catalyst particle studies, as performed with e.g. UV-vis, synchrotron-based IR and fluorescence micro-spectroscopy, and many catalyst particle photo-spectroscopy studies, making use of a relatively simple DSLR photo-camera. The latter approach offers clear prospects for the quality control of e.g. FCC catalyst manufacturing plants.
Introduction
Fluid catalytic cracking (FCC) is a major chemical process used in the oil refining industry to convert crude oil fractions into smaller, more useful molecules such as gasoline and propylene.1,2 FCC catalysts are multi-component hierarchically structured particles of about 50–150 μm containing a complex mixture of clay, silica, alumina, and zeolite. The choice of the zeolite material depends on the application in mind, although zeolite Y (FCC-Y) and ZSM-5 (FCC-ZSM-5) are the main workhorses in FCC catalysis. The addition of FCC-ZSM-5 to the catalyst inventory of an FCC process is known to enhance the propylene yield.In a real-life crude oil refinery plant, FCC catalyst particles are poisoned by metals, such as nickel, iron and vanadium, from the crude oil feedstock as well as by coke formation, which both affect their short- and long-term activity.3–6 The coke on the catalyst particles is removed in a regenerator unit before the catalyst is returned to the riser reactor. This cycle between the riser reactor and regenerator unit is repeated continuously. Part of the catalyst inventory in an FCC unit is replaced by fresh catalyst material on a daily basis. As a result, the so-called equilibrium catalyst (Ecat) has a range of ages and activities. Since with an increasing amount of FCC-ZSM-5 the propylene yield plateaus, there is less FCC-ZSM-5 than FCC-Y in Ecat mixtures when using a ZSM-5 additive.7
Several studies showed that the deactivation of FCC-Y and FCC-ZSM-5 differs.5,8 For example, dealumination resulting from steam treatment in the regenerator unit will mainly cause a decrease in the number of acid sites in zeolite ZSM-5, while it will also have an effect on the acid strength in zeolite Y.8 Laboratory deactivation methods, such as steam (ST), two step cyclic (CD), and Mitchell-steam (MI) deactivation, are commonly used to simulate the influence of hydrothermal conditions, coke formation and/or metal poisoning, although none of those laboratory deactivation methods yield the same results as a genuine Ecat material.
For example, it was found that after applying a selective staining reaction with a Brønsted acid selective probe, the fluorescence intensity of the different laboratory deactivated samples shows sensitivity towards the specific deactivation method applied. More specifically, the following fluorescence intensity decrease was noted for two series of laboratory deactivated FCC catalyst particles (FCC1 and FCC2): fresh > ST > CD > MI.9,10 An Ecat sample was found to display Brønsted acidity in between those of the CD and MI catalyst samples.
In a similar manner, synchrotron-based IR microscopy in combination with pyridine as a probe molecule for assessing Brønsted and Lewis acidity could be used to determine the degree of FCC catalyst deactivation at the single catalyst particle level, leading to the following decreasing order in acidity: fresh > ST > CD > MI.11 Also, an Ecat sample was found to display an overall acidity in between those of the CD and MI catalyst samples.
The ability to distinguish FCC-Y from FCC-ZSM-5 within Ecat samples would be interesting to combine with a separation technique as this would allow studying them independently and the obtained knowledge could allow more deliberate designs of FCC catalyst particles. In order to achieve this ambitious goal, first a simple identification should be possible for a single particle, preferably based upon a simple characterization tool. It has been shown that zeolite ZSM-5 crystals can be mapped in great detail by making use of the optical absorption of polarized light.12 Recently, our group used the anisotropy of zeolite ZSM-5 crystals to determine the dispersion, aggregate size and amount of ZSM-5 within a single FCC particle.13
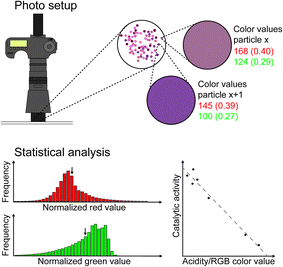
Inspired by the work of Schwaebel et al.,14 we have developed in this work a versatile photo-spectroscopy method to determine both the age and type of an individual FCC catalyst particle simply on the basis of its colour after applying a selective staining procedure. To determine the specific colour of a large number of FCC catalyst particles we have used an off-the-shelf digital single lens reflex (DSLR) photo-camera with a macro lens. An outline of the approach taken is given in Fig. 1. In the work described, the amount of FCC-ZSM-5 in mixtures differing in structure (FCC-Y vs. FCC-ZSM-5) as well as in an Ecat sample is quantified based upon the photographs taken after staining a mixture of FCC catalyst particles. Furthermore, the differences in Brønsted acid strength in Ecat–Y samples, obtained by different methods of aging, are evaluated by colour changes after catalyst staining, and related to catalytic cracking data as well as to physicochemical properties, such as the micropore volume. As a result, a simple but powerful analytical method emerges, which can be used to evaluate catalytic performances based on specific colour changes.
Results and discussion
In this work, we discuss the versatility of photo-spectroscopy for catalyst characterization studies by taking FCC catalyst particles as a showcase system. As modern off-the-shelf digital reflex photo-cameras are equipped with very sensitive CCD detectors, it is possible to determine very accurately the colour of the FCC catalyst particles after selective staining with a probe molecule. The advantage of this approach is that a large number of FCC catalyst particles (∼104) can be analysed in “one photographic shot”, as compared to previous characterization studies in which only a handful of FCC catalyst particles (<10) could be analysed with various micro-spectroscopic techniques, including UV-vis, synchrotron-based IR, and (confocal) fluorescence microscopy.9–11 The principles of the photo-spectroscopy method will now be illustrated for two examples: one focusing on the determination of the age of the FCC catalyst particles, while the second example demonstrates the potential to discriminate between FCC catalyst particles containing either zeolite Y or ZSM-5.Determining the age of catalyst particles
In the first series of experiments we have focused on a set of 11 distinct FCC catalyst samples. More specifically, we have made use of FCC density separated equilibrium catalysts (Ecat, 3 samples in total), and two sets of laboratory deactivated FCC-Y (8 samples in total). For the latter FCC catalyst samples we use the sample codes FCC1 and FCC2, which is identical to that of Buurmans et al.9 It is important to remark that these 11 FCC catalyst materials have been described in detail in previous publications from our research group, including their physico-chemical and catalytic characterization.9–11,15Due to severe deactivation after the laboratory deactivation procedures (i.e., ST, CD and MI), the colour change resulting from a 4-fluorostyrene probe reaction is limited and differences between the FCC-Y cannot be observed. Therefore, the FCC catalyst samples were stained with 4-methoxystyrene instead, which is known to react with all Brønsted acid sites of the zeolite material, as opposed to 4-fluorostyrene, which only reacts with the strongest Brønsted acid sites of a zeolite material.12
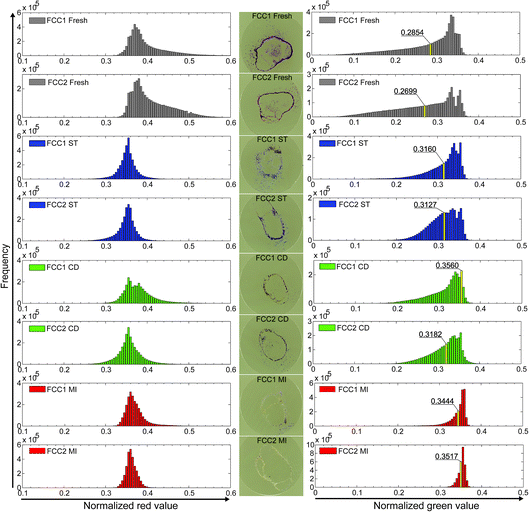
As shown in Fig. 2, distinct colour differences were observed for the FCC1 and FCC2 samples across the different deactivation techniques, indicating that the Brønsted acid sites, although strong enough to catalyze the selective 4-methoxystyrene oligomerization reaction, do not have sufficient strength to catalyze the 4-fluorostyrene reaction. This is in agreement with previous studies.10 It is often thought that the observed colour changes are due to accessibility differences, but a Nile-blue staining study performed by Buurmans et al.9 showed that the accessibility of FCC particles towards larger fluorescent molecules does not change significantly upon deactivation, and colour differences are thus not solely due to accessibility differences.
As illustrated in Fig. 2, the fresh FCC samples show the most severe colour change towards purple/pink. ST, CD, and MI samples still colour pink and purple upon reaction, but a gradient can be seen over the samples in the order: ST > CD > MI. The more pronounced the colour change observed, the higher the acidity of the FCC particle.
For quantitative analysis, the relative values in the RGB channels (RGB stands for the intensities of Red, Green and Blue which, combined in different intensities, result in the observed colour) were calculated from the photographs taken (Fig. 2) for an average of 3.16 × 10⁶ foreground pixels (i.e., pixels part of an FCC particle) per sample (Table S3†). This roughly translates to ∼23![[thin space (1/6-em)]](https://www.rsc.org/images/entities/char_2009.gif) 000 catalyst particles as opposed to the six catalyst particles studied by Buurmans et al.9 The average red values are fairly similar for the ST, CD, and MI samples, while the values found for the fresh catalyst samples are higher and show a broader distribution. The average green values also show the highest distribution for the fresh catalyst samples. Average green values for series FCC1 and FCC2 show a fresh < ST ≈ CD < MI trend and obvious differences can be observed (Fig. 2). The tail at lower values disappears across the samples, with the tail being the longest for the fresh and the shortest for the MI samples. The highest frequency in the green distribution of the fresh catalyst samples is ∼0.34 and for the MI samples ∼0.36, and across the catalyst samples the relative intensities of these bands seem to change.
000 catalyst particles as opposed to the six catalyst particles studied by Buurmans et al.9 The average red values are fairly similar for the ST, CD, and MI samples, while the values found for the fresh catalyst samples are higher and show a broader distribution. The average green values also show the highest distribution for the fresh catalyst samples. Average green values for series FCC1 and FCC2 show a fresh < ST ≈ CD < MI trend and obvious differences can be observed (Fig. 2). The tail at lower values disappears across the samples, with the tail being the longest for the fresh and the shortest for the MI samples. The highest frequency in the green distribution of the fresh catalyst samples is ∼0.34 and for the MI samples ∼0.36, and across the catalyst samples the relative intensities of these bands seem to change.
When plotting the average green value versus bulk properties (i.e., catalytic cracking activity and micropore volume)9 the same inverse proportional trend is found, as illustrated in Fig. 3. As the average green value is inversely proportional to the activity and bulk properties related to activity, it can be used to estimate the activity. The same experiments were performed on beginning of life (BOL), middle of life (MOL) and end of life (EOL) density separated Ecat samples (Fig. 3 and Table S3†). The catalytic activity and micropore volume of the density separated Ecats are between MI and CD, as are the average normalized green values.
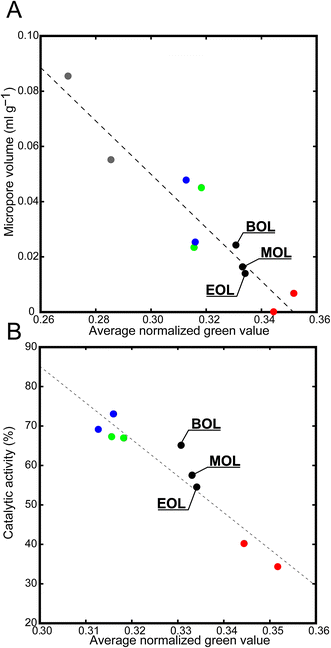 | ||
| Fig. 3 Plots illustrating the average normalized green values versus bulk properties for FCC catalyst particles. (A) Micropore volumes obtained from nitrogen physisorption measurements; (B) activity data obtained for a catalyst-to-oil ratio of 3 when performing a catalytic cracking test. The color coding is as follows: fresh in gray, steamed in blue, cyclic deactivated in green, Mitchell impregnated in red, and density separated Ecat in black. Numerical data for these plots can be found in the ESI† of this article. | ||
It is evident that the experiments presented in this study take much less time than the confocal fluorescence microscopy measurements conducted at the single catalyst particle level. Furthermore, the statistics are more robust as a much larger amount of catalyst particles is analyzed. Previous confocal fluorescence microscopy studies were based upon the analysis of six particles or 150 domains per sample,9 in contrast to the thousands of FCC catalyst particles which can be captured in one single photograph with the method used in this work.
Determining the type of zeolite in a particle
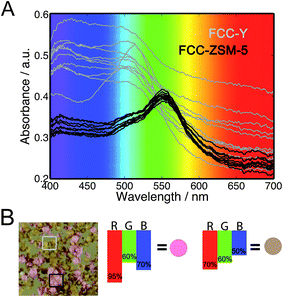
In the second series of experiments, both FCC-ZSM-5 and FCC-Y have been analyzed in mixtures using 4-fluorostyrene as a selective staining probe. Upon reaction, colour differences appear between FCC-ZSM-5 (pink) and FCC-Y (orange), which results from the zeolite type and is caused by the different reaction products that are formed. The result is shown in Fig. 4. For example, FCC-Y will produce an absorption band at around 520 nm due to the formation of mainly cyclic dimers, while FCC-ZSM-5 will give rise to several absorption bands due to the formation of linear conjugated dimers and higher oligomers. In Fig. 4, sample FCC-ZSM-5 transmits ∼70% of the blue light, and 60% and 95% of the green and red light, respectively. This results in an overall pink colour (panel B). Instead, sample FCC-Y transmits ∼50% of the blue, 60% of the green, and 70% of the red light, resulting in an orange/brown colour.As the colour is related to the type of zeolite, the colours can be used to estimate the amount of FCC-ZSM-5 and FCC-Y particles by quantifying the amount of particles with a specific colour. This can be accomplished with a micro-spectroscopy set-up, as shown in previous work,9,10 but also – as done in this study – with a digital single lens reflex (DSLR) photo-camera with a macro lens. For this purpose, one can make use of the amount of catalyst particles (Table S4, Fig. S1 and S2†) and the area of the catalyst particles (Table S5†). The findings were then plotted vs. the wt% of the constructed samples (Fig. 5 and S4†). The equation of the calibration lines can be used to translate the values found for the observed amount of FCC-ZSM-5 to a weight percentage, which was used for an Ecat with unknown composition (Table S7, Fig. S3†).
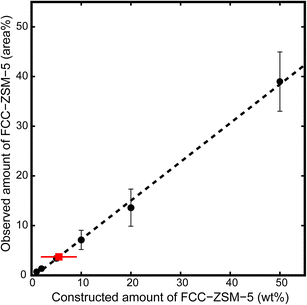 | ||
| Fig. 5 Graphical representation of the observed amount of FCC-ZSM-5 versus the constructed amount for all data based upon the area of FCC catalyst particles (closed circles, y = 0.7804x − 0.5919). The Ecat sample is displayed with a red square. Numerical data can be found in the ESI† of this article. | ||
It is thought that the area method (the amount of pixels depicting a certain type of catalyst) is more robust than the number of particles because it is less sensitive to agglomerated catalyst particles. The R-squared value of the area calibration line is higher than that of the number of catalyst particles calibration line and the spread in the wt% values of samples taken from the same Ecat is smaller (lower standard deviation), also indicating that using the area is a more robust method. Based upon the area of the catalyst particles, values for the fraction of the FCC-ZSM-5 sample were found between 0.6 and 9.8%, which translated to 1.6 and 13.3 wt% (Table S7†). An average of 5.5 wt% was found for the method based upon area. The observed amount of the FCC-ZSM-5 sample is consistently lower than the constructed amount when using the area method, which is thought to be (partly) caused by the slight difference in particle size between FCC-Y and FCC-ZSM-5. A method based upon the volume instead of area should improve the agreement of the observed and constructed wt% as the weight of a particle is (assuming equal density over the sphere) directly proportional to the linear volume of the sphere and not to the cross sectional area.
On average, slightly over 25![[thin space (1/6-em)]](https://www.rsc.org/images/entities/char_2009.gif) 000 catalyst particles were analyzed from only 8 photographic images, which is an interesting trade-off between single catalyst particle and bulk characterization studies. An off-the-shelf DSLR camera with a macro lens as used in this study is an inexpensive investment compared to, for example, a confocal fluorescence microscope setup with multi-laser excitation, as employed in the work of Sprung and Weckhuysen. Furthermore, the data are acquired quicker and more efficient, giving way to measurements on manufacturing sites for quality control purposes.
000 catalyst particles were analyzed from only 8 photographic images, which is an interesting trade-off between single catalyst particle and bulk characterization studies. An off-the-shelf DSLR camera with a macro lens as used in this study is an inexpensive investment compared to, for example, a confocal fluorescence microscope setup with multi-laser excitation, as employed in the work of Sprung and Weckhuysen. Furthermore, the data are acquired quicker and more efficient, giving way to measurements on manufacturing sites for quality control purposes.
Experimental
Equilibrium catalysts (Ecat), density separated Ecats, laboratory deactivated FCC-Y (FCC1 and FCC2, see ESI, Section 1†) and fresh FCC-Y and FCC-ZSM-5 were provided by Albemarle Catalysts. FCC-Y was heated to 600 °C in 3 h and then calcined for 5 h. FCC-ZSM-5 and the set of Ecats were used as received.Photographs of the samples were taken with an EOS 6D camera body (Canon) equipped with an EF 100 mm IS USM macro lens (Canon) and EF 25II lens extension tube (Canon). A Copylizer eVision exe.cutive HF camera stand with lighting unit RB 4.36 HF (both Kaiser Fototechnik) was used to illuminate the sample under 45° angles and secure the camera at the desired distance to the sample.
Mixtures of 1, 2, 5, 10, 20 and 50 wt% FCC-ZSM-5 in a FCC-Y sample were prepared and finely sprinkled upon a borosilicate microscope window heated to 30 °C, after which 10 μl of 4-fluorostyrene (99%, Sigma Aldrich) was added to impregnate the sample. After evaporation the sample was rinsed twice with mesitylene (97%, Sigma) to remove the remaining probe molecules from the outer surface. The temperature was then increased to 180 °C (50 °C min−1), after which a color change (pink for FCC-ZSM-5 and orange for FCC-Y) was observed and a photograph was taken for further analysis. This procedure was performed 8 times for all samples under study (Fig. S1†).
For the laboratory deactivated samples measurements were performed by adding 4-methoxystyrene (97% Sigma Aldrich) directly at 180 °C, without the washing steps, as this would save a significant amount of time in future applications. Here, again, the procedure was performed 8 times for all samples under study. It is important to state that the photographs taken with the additional washing steps and temperature ramp showed a similar trend in color. Photographs were color calibrated using the SpyderCheckr tool and loaded into Photoshop where the images were cropped and the background and rim were removed. Images were then loaded into Matlab and the RGB values for each pixel in the foreground were normalized: R_norm = R/(R + G + B), G_norm = G/(R + G + B) and B_norm = B/(R + G + B). As the sum of the normalized values equals 1 for each pixel, any combination of the two values is sufficient to describe the color, and only R and G are displayed.14
Conclusions
4-Fluorostyrene was used as a selective probe molecule for the quantification of the number of FCC-Y and FCC-ZSM-5 catalyst particles in mixtures based upon their respective colors. An off-the-shelf DSLR camera with a macro lens was used, which yields clear prospects for automation. Calibration lines were constructed, based upon the number and area of the FCC catalyst particles, and used to calculate the amount of FCC-ZSM-5 in an equilibrium FCC catalyst. The area method is believed to be more robust and gave a value of 5.5 wt% FCC-ZSM-5 for the Ecat catalyst material under study.For the analysis of the acid strength, and related age, of a series of FCC-Y catalyst particles, 4-methoxystyrene has been used as a selective probe molecule. It was found that the normalized green value, as obtained from the photo-spectroscopy data, is inversely proportional to the catalytic activity and micropore volume of the series of FCC catalysts under study. This correlation demonstrates that the age of FCC catalyst particles can be simply determined on the basis of their colour.
Both showcase examples demonstrate that photo-spectroscopy is an interesting trade-off method between single catalyst particle and bulk characterization studies as measurements are relatively fast and a large amount of catalyst particles are captured in a single photograph.
Acknowledgements
This work was supported by the Dutch National Science Foundation (NWO-TASC project 053.23.101), while the FCC samples were provided by Albemarle Catalysts. Dr F. Meirer (Utrecht University) is acknowledged for his help with the artwork in Fig. 4.Notes and references
- (a) W. Vermeiren and J. P. Gilson, Top. Catal., 2009, 52, 1131 CrossRef CAS; (b) A. Corma, Chem. Rev., 1995, 95, 559 CrossRef CAS; (c) Zeolites and Catalysis: Synthesis, Reactions, and Applications, ed. J. Cejka, A. Corma and S. Zones, Wiley, Weinheim, 2010 Search PubMed; (d) Handbook of Heterogeneous Catalysis, ed. G. Ertl, H. Knozinger, F. Schuth and J. Weitkamp, 2nd edn, Wiley-VCH, 2008 Search PubMed.
- (a) E. T. C. Vogt and B. M. Weckhuysen, Chem. Soc. Rev., 2015, 44, 7342 RSC; (b) E. T. C. Vogt, G. T. Whiting, A. Dutta Chowdhury and B. M. Weckhuysen, Adv. Catal., 2015, 58, 143 Search PubMed.
- (a) J. Ruiz-Martínez, A. M. Beale, U. Deka, M. G. O'Brien, P. D. Quinn, J. F. W. Mosselmans and B. M. Weckhuysen, Angew. Chem., Int. Ed., 2013, 52, 5983 CrossRef PubMed; (b) S. Kalirai, U. Boesenberg, G. Falkenberg, F. Meirer and B. M. Weckhuysen, ChemCatChem, 2015, 7, 3674 CrossRef CAS PubMed; (c) F. Meirer, S. Kalirai, J. N. Weker, Y. Liu, J. C. Andrews and B. M. Weckhuysen, Chem. Commun., 2015, 51, 8097 RSC; (d) F. Meirer, D. T. Morris, S. Kalirai, Y. J. Liu, J. C. Andrews and B. M. Weckhuysen, J. Am. Chem. Soc., 2015, 137, 102 CrossRef CAS PubMed.
- S. Haitao, D. Zhijian, Z. Yuxia and T. Huiping, Catal. Commun., 2011, 16, 70 CrossRef.
- J. Ruiz-Martínez, I. L. C. Buurmans, W. V. Knowles, D. van der Beek, J. A. Bergwerff, E. T. C. Vogt and B. M. Weckhuysen, Appl. Catal., A, 2012, 419–420, 84 CrossRef.
- H. S. Cerqueira, G. Caeiro, L. Costa and F. Ramôa Ribeiro, J. Mol. Catal. A: Chem., 2008, 1–2, 292 Search PubMed.
- T. Amano, J. Wilcox, C. Pouwels and T. Matsuura, Petrol. Tech. Q., 2012, 17, 17–27 Search PubMed.
- E. Rautiainen, R. Pimenta, M. Ludvig and C. Pouwels, Catal. Today, 2009, 140, 179 CrossRef CAS.
- I. L. C. Buurmans, J. Ruiz-Martínez, W. V. Knowles, D. van der Beek, J. A. Bergwerff, E. T. C. Vogt and B. M. Weckhuysen, Nat. Chem., 2011, 3, 862 CrossRef CAS PubMed.
- I. L. C. Buurmans, J. Ruiz-Martínez, S. L. van Leeuwen, D. van der Beek, J. A. Bergwerff, W. V. Knowles, E. T. C. Vogt and B. M. Weckhuysen, Chem.–Eur. J., 2012, 18, 1094 CrossRef CAS PubMed.
- I. L. C. Buurmans, F. Soulimani, J. Ruiz-Martinez, H. E. Van der Bij and B. M. Weckhuysen, Microporous Mesoporous Mater., 2013, 166, 86 CrossRef CAS.
- (a) M. H. F. Kox, E. Stavitski and B. M. Weckhuysen, Angew. Chem., Int. Ed., 2007, 46, 3652 CrossRef PubMed; (b) E. Stavitski, M. H. F. Kox and B. M. Weckhuysen, Chem.–Eur. J., 2007, 13, 7057 CrossRef CAS PubMed; (c) M. H. F. Kox, E. Stavitski, J. C. Groen, J. Pérez-Ramírez, F. Kapteijn and B. M. Weckhuysen, Chem.–Eur. J., 2008, 14, 1718 CrossRef CAS PubMed.
- C. Sprung and B. M. Weckhuysen, Chem.–Eur. J., 2014, 20, 3667 CrossRef CAS PubMed.
- T. Schwaebel, S. Menning and U. H. F. Bunz, Chem. Sci., 2014, 5, 1422 RSC.
- F. Meirer, S. Kalirai, D. Morris, S. Soparawalla, Y. Liu, G. Mesu, J. C. Andrews and B. M. Weckhuysen, Sci. Adv., 2015, 1, e1400199 Search PubMed.
Footnote |
| † Electronic supplementary information (ESI) available: FCC laboratory deactivation methods, N2 physisorption measurements, catalytic activity testing and photo-spectroscopy data analysis. See DOI: 10.1039/c5fd00210a |
| This journal is © The Royal Society of Chemistry 2016 |

