A new dipstick colorimetric sensor for detection of arsenate in drinking water
Joyati
Das
and
Priyabrata
Sarkar
*
Biosensor Laboratory, Department of Polymer Science and Technology, University of Calcutta, 92, A.P.C. Road, Kolkata 700009, W. B., India. E-mail: sarkarpriya@gmail.com; Fax: +913323519755; Tel: +913323508386
First published on 22nd April 2016
Abstract
The present work reports on a polymer hydrogel-based cost effective colorimetric dipstick sensor for arsenic(V). The method was based on the formation of a blue colored antimonyl–arseno–molybdate complex in the presence of ammonium molybdate, potassium antimonyl tartrate and ascorbic acid. All these reagents were encapsulated in a polymer hydrogel made of polyvinyl alcohol, acrylamide and glutaraldehyde. Plastic detector strips were dip coated with this hydrogel. Scanning electron microscopy (SEM) depicted the highly porous structure of the polymer hydrogel permitting adsorption of As(V) confirmed by energy dispersive X-ray spectroscopy (EDX), transmission electron microscopy (TEM) and Fourier transform infrared spectroscopy (FTIR) analysis. The advantages were low sample volume (10 ml), low detection limit (10 μg L−1 by the naked eye), good stability (4 months), low cost (0.03$ per test for visual detection), and high reproducibility. The sensor strips displayed selectivity in the presence of <100 μg L−1 of phosphate (arsenate structural analog) and 3 mg L−1 of iron. Changes in the RGB (red, green, and blue) values of color spots on the As(V) colorimetric dipstick sensor with various concentrations of As(V) created a pattern. The dominance of B (blue) values was revealed in low concentration range of As(V) while the R (red) values dominated in higher concentrations. The same strip could be used for detection of total arsenic in case the sample contained As(III). Phosphate interference could also be detected by a simple modification of the procedure. When applied to real groundwater arsenic contaminated samples, the results were in good agreement with the atomic absorption spectrophotometry (AAS) results as visualized by statistical analysis.
Water impactEnvironmental pollution related to arsenic poisoning in groundwater is an important global problem, especially in the developing world. The present research evolves a new user friendly technique for assessment of arsenate in drinking water. A new formulation of a hydrogel system consisting of polyvinyl alcohol and polyacrylamide was used along with well known chemicals arsenate and ammonium molybdate to produce a blue color. This is the first ever dipstick sensing of arsenate (lowest detection limit = 10 μg L−1) through visual observation without any instrumentation. |
Introduction
Arsenic is an odorless metalloid element. Arsenic poisoning causes severe damage to the environment and human health. Arsenic contamination in ground water is a significant concern in several countries. Arsenic exposure causes a variety of health hazards such as thickening and discoloration of the skin, lesions,1 stomach pain, nausea, vomiting, diarrhea, numbness in hands and feet, partial paralysis, blindness, skin, lung and bladder cancer.2 The World Health Organization (WHO) has recommended the maximum permissible limit for arsenic in water to be 10 μg L−1. Arsenic toxicity level mainly depends on its chemical forms. Inorganic forms such as arsenate [As(V)] and arsenite [As(III)] are the most toxic forms.3 Although As(III) is reported to be 25–60 times more toxic than As(V),4 under oxidative conditions As(V) is predominantly available in water. As(V) could be dominating over As(III) in a wide range of natural waters under pH 5–9.5Some conventional instrumental techniques commonly used for arsenic detection include atomic fluorescence spectrometry (AFS),5–7 inductively coupled plasma mass spectrometry (ICP-MS),8 hydride generation atomic absorption spectrometry (HG-AAS), electrothermal atomic absorption spectrometry (ETAAS),9,10 flow injection-hydride generation-inductively coupled plasma mass spectrometry (FI-HG-ICPMS),11 anodic stripping voltammetry (ASV),12–15 cathodic stripping voltammetry (CSV) using a hanging drop mercury electrode,16etc. Although the above methods possess low detection ranges, the disadvantages such as lack of onsite performance, high cost and requirement of highly trained professionals limit their applications.
Liu et al.17 developed an arsenic detection procedure through adsorption of DNA by iron oxide nanoparticles. Recently Siegfried et al.18 reported field testing of arsenic using lyophilized bioreporter bacteria but preparation of the lyophilized bioreporter bacteria made this process tedious and time consuming.
The most well known analytical technique for field samples employed for arsenic determination at the microlevel is the spot test, the Gutzeit method.19 It involves the formation of a colored complex due to formation of arsine by reduction of arsenic under acidic conditions, either with mercuric bromide20 or with silver diethyldithiocarbamate.21 The advantage of this method is the elimination of expensive instruments and it can be employed in kit form for the analysis of arsenic. Moreover, the method is sensitive, rapid and can be performed easily.19 The major drawback is that the concentrated hydrochloric acid used in this method is highly corrosive and thereby deals with handling and transportation problem.
The very well known Merck (Mumbai, India) kit (based on the Gutzeit method; Merck Arsenic Test method: colorimetric with test strips, 0.005–0.5 mg L−1 As3+/5+, prod.: 1.17927.0001, batch: HC80062, Merckoquant®) and Hach (Loveland, CO, USA) kit22 are widely used all over the world for arsenic detection in groundwater and have a detection capability of 5–500 μg L−1 of arsenic and both of them use solid sulfamic acid instead of concentrated hydrochloric acid.
Baghel et al.22 reported generation of arsine by reacting magnesium turnings with oxalic acid and this arsine reduced auric chloride into metallic gold which appeared as a pink-violet color. However, the use of costly auric chloride showed the major drawback of the process.
In the recent past, Das et al.23 developed two test kits for detecting total arsenic in microgram levels in water by using mercuric bromide and silver nitrate as the detector elements. Kearns et al.24 reported some improvement in the accuracy and precision of the Hach EZ test kit for quantifying inorganic arsenic concentration in drinking water by using digital analysis of the color developed on the detector strip. The digital analysis would produce fewer false positive and false negative results but running the test process for 24 h made the procedure time consuming. Arsenator® Digital Arsenic Test Kit commercialized by Wagtech, Palintest Ltd, United Kingdom is also a very well known digitised arsenic detection kit available in the market but measurement is costly by this kit. Sharma et al.25 developed a disposable sensor for quantitative detection of arsenic using MATLAB software. But the lowest detection limit of this process was 18 μg L−1 and unfortunately it is greater than the maximum contamination level of arsenic in groundwater (10 μg L−1) as guided by the WHO. Thus a significant opportunity is there for the development of a low-cost and environmental friendly simple colorimetric detection of arsenic in ground water samples.
The kits available in the market measure total arsenic i.e. both As(V) and As(III). The present study focuses on the detection of only arsenate. Hydrogels are polymeric networks consisting of crosslinked hydrophilic polymers that can absorb and retain a large amount of water within them. Polyacrylamide (PAM) has a typical three-dimensional (3D) network structure and it absorbs a large amount of water. PAM may be synthesized by a simultaneous crosslinking polymerization procedure using initiators like potassium peroxydisulphate. Poly(vinyl alcohol) (PVA) being an inexpensive biodegradable synthetic polymer, exhibits attractive features such as high transparency, very good flexibility, chemical resistance, non toxicity and wide commercial availability and the presence of hydroxyl groups imparts the property of high amount of water absorption. The properties of PVA hydrogels can be controlled by varying its crosslinking density by agents like glutaraldehyde, acetaldehyde, formaldehyde, etc.
Molybdenum forms the so called arsenomolybdate complex with arsenate to give an intense blue color under reductive conditions. Since the development of this blue color is very stable and corresponds to the concentration of the arsenate ion, many researchers tried quantitative analysis of As(V) by spectrophotometry.20,26 Recently Okazaki et al.27 reported a portable device equipped with two attachments of a CaCO3 cartridge and a molybdenum loaded membrane holder to develop visual colorimetry for determination of trace arsenic in groundwater. Although the minimum detection limit was 5 μg L−1, use of a CaCO3 cartridge along with membrane filters made this process costly. Up to date, no report is available on the use of a dipstick colorimetric procedure for As(V) and the performance evaluation by digital analysis.
In the present study, we developed a colorimetric dip strip which turns blue in the presence of As(V) in water. The strip was prepared by encapsulation of ammonium molybdate in a PAM–PVA hydrogel and used for the adsorption and detection of As(V). The sensing was validated with results from the conventional spectrophotometric method and AAS at room temperature. The evaluation could be made by the naked eye as well as digital and statistical analyses of the color of the dipstick strips in the presence of analyte i.e. As(V). The minimum detection level by visual observation (naked eye) is 10 μg L−1 of As(V).
Materials and methods
Chemicals and solutions
PAM was obtained from SRL, India. Ammonium molybdate tetrahydrate, potassium antimony(III) tartrate hemihydrates, glutaraldehyde, and sulfuric acid were supplied by Merck, India. PVA and L-ascorbic acid were procured from Loba Chemie, India. Working standard solutions of As(V) (10–250 μg L−1) were prepared by stepwise dilution of stock solutions of As(V) by dissolving sodium arsenate heptahydrate (Na2HAsO4·7H2O) (Merck) into 100 ml of water.Preparation of polymer hydrogel
A 2.5% PVA (i.e. 0.5 g) and 15% PAM (i.e. 3 g) polymer mixture was first prepared by heating the polymer mixture in 20 ml of deionised (18.2 MΩ) water at 80 °C temperature until the solution became transparent.Preparation of reagent
A reagent consisting of 2 ml of deionised water, 2 ml of 3% (24 mM) ammonium molybdate tetrahydrate, 1 ml of 0.56% (8 mM) potassium antimony(III) tartrate hemihydrate and 5 ml of 13.98% (2.5 M) sulfuric acid was prepared.Preparation of detector strip
1 ml of this reagent was mixed with 400 μl of a PAM–PVA polymer hydrogel mixture and 20 μl of 12.5% glutaraldehyde (diluted from 25% stock) to make a stable reagent–polymer mixture. Plastic detector strips were dip coated (HWTL 0.01 Dip Coater, MTI corporation, USA) with this mixture and dried in an oven at 45 °C for 30 minutes.Characterization
Effect of L-ascorbic acid (%) (reducing agent) concentration
The performance of the molybdenum blue-based polymer hydrogel dipstick colorimetric system was optimized with respect to L-ascorbic acid (0.02%–0.15%) concentrations. It was found that treatment of 10 mg of L-ascorbic acid in 10 ml of As(V) solution (0.1%) gave the best result (details are discussed in the Results and discussion section).Detection procedure of arsenic(V)
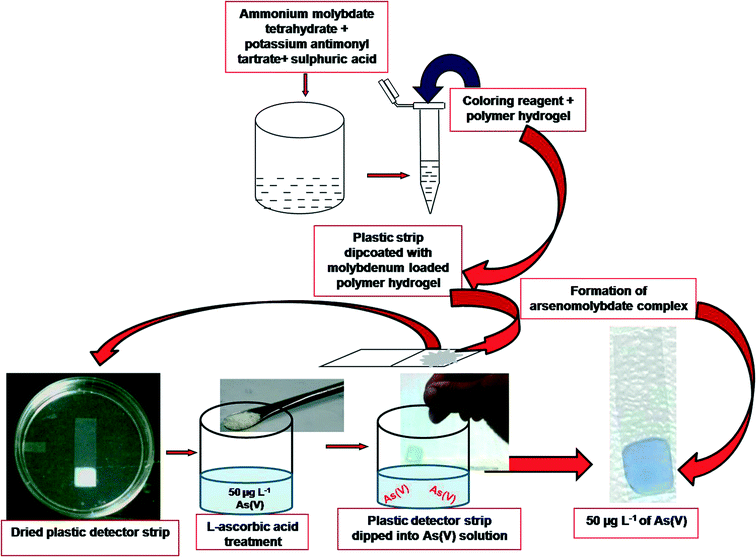
10 ml of the sample [including blank tap water and As(V) contaminated water] was poured into a 20 ml vial. It was treated with 10 mg of L-ascorbic acid. MLPH coated plastic strips were dipped into vials containing different As(V) concentrations including blank [no As(V)] and kept at room temperature for 20 minutes. The presence of arsenic(V) in the sample solution was detected by comparing the color with standard chart already obtained with standard As(V) samples. The intensity of the color was also measured by RGB analysis of the image of the color. The details of the procedure are depicted in Fig. 1.Field study
The dipstick sensor was also applied to test some field samples and the comparison was performed with AAS as well as the conventional spectrophotometric method.Data analysis
All data were represented as mean ± SD (n = 3). The images of the dipsticks under different reaction conditions were captured using a SONY Cybershot digital camera. For analyzing color values in the RGB (red, green, blue) system, digital images were fitted into Adobe Photoshop 6 software, three representative areas on each test strip were analyzed and the RGB values were obtained. The effective intensity of the RGB values was subsequently calculated by subtracting the corresponding values obtained from blank i.e. water sample without any arsenate.Proof of concept
Any color can be analyzed by its corresponding R, G and B values. The effective intensity (AX) for any color values obtained from the color spots of the detector strips was calculated as follows:28| Ar = − log(Rs/Rb) | (1) |
| Ag = −log(Gs/Gb) | (2) |
| Ab = −log(Bs/Bb) | (3) |
Interference study
The only interfering agent could be the phosphate ion. Ammonium molybdate forms a similar complex with phosphate, which under reductive conditions gives rise to molybdenum blue. The recommended maximum concentration of total phosphate in drinking water is 0.1 mg L−1i.e. 100 μg L−1 according to the US EPA. To check phosphate interference, we had prepared the phosphate standard chart and performed RGB analysis with that.The maximum contamination limit of iron in drinking water is 0.3 mg L−1 according to the WHO. In the presence of iron, there is a chance that precipitation of arsenic takes place. We had spiked water samples with iron 10 times higher than the WHO's stipulated limit (3 mg L−1) and in the presence of 10 μg L−1 and 250 μg L−1 of As(V) and applied our kit in order to perform the iron interference study.
Results and discussion
Synthesis of polymer composite hydrogel
Hydrogels were prepared by chemical crosslinking of a PAM–PVA-based polymer composite. Acrylamide was converted to polyacrylamide (PAM) when the PAM–PVA composite polymer was produced by heating and stirring in the presence of an initiator and accelerating agent. When this PAM–PVA polymer composite was mixed with the reagent containing molybdenum and glutaraldehyde, then acetal bridges could be formed between the pendant hydroxyl groups of the PVA chains and this might give rise to a PAM–PVA interpenetrating network.29SEM and TEM analyses
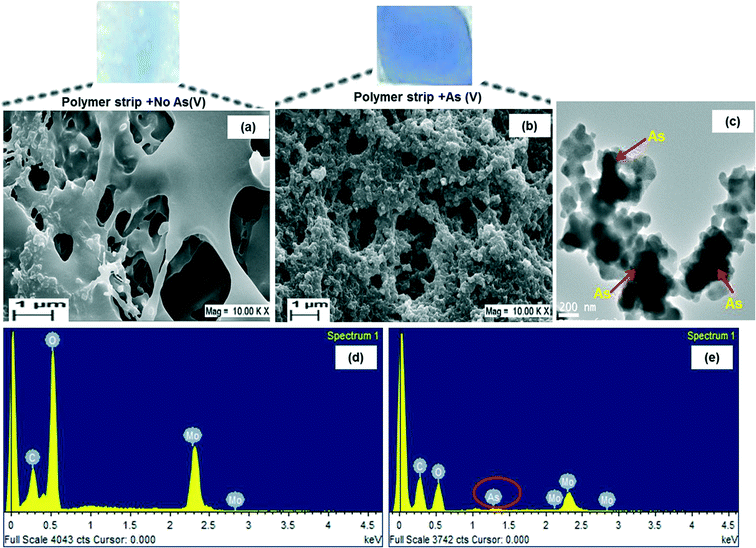
Fig. 3a shows the typical SEM image of MLPH before adsorption of arsenate (soaked in only tap water). A porous structure could be seen and the pores were connected to each other. The surface was smooth due to the amorphous nature of the hydrogel and homogeneous entrapment of molybdenum within the polymer hydrogel. The functional groups corresponding to PAM, PVA, molybdate and As(V) could further be confirmed by FTIR and the presence of As peaks within the polymer hydrogel was confirmed by EDX analysis. The porous structures of MLPH suggested that it could have allowed adsorption of arsenate from the aqueous solution since the effective diffusion distance could be controlled by the average distance between neighbouring pores.30 After adsorption of arsenate, the morphology of the hydrogel changed and this could be viewed in the SEM image in Fig. 3b. The surface turned rough due to the adsorption of arsenate by the composite hydrogel. The dark regions seen within the micrographs of TEM analysis (Fig. 3c) suggested that it might be due to the adsorption of arsenic inside the polymer hydrogel.FTIR analysis
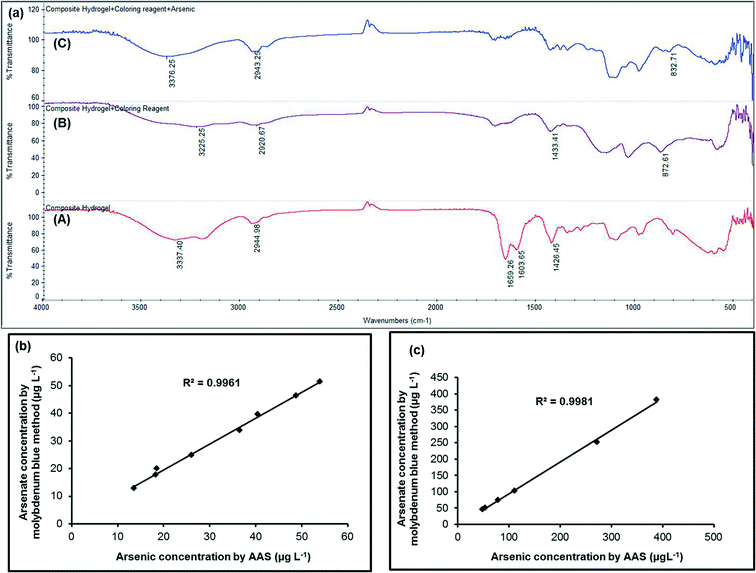
The FTIR spectra of only PVA grafted PAM hydrogel, MLPH before and after adsorption of arsenate are presented in Fig. 4a. The broad peaks at 3337.40 cm−1 (curve A), at 3225.25 cm−1 (curve B) and at 3376.25 cm−1 (curve C) could be attributed to overlapping of hydrogen bonded –O–H stretching vibrations due to unreacted OH bonds in the PVA polymer and –N–H stretching vibrations corresponding to –NH bonds of ammonium molybdate tetrahydrate. The C–H stretching from the –CH2 could be observed at 2944.98 cm−1 (curve A), 2920.67 cm−1 (curve B) and 2943.25 cm−1 (curve C). The specific absorption bands shown in curve A at 1659.26 cm−1, which could be due to the νC![[double bond, length as m-dash]](https://www.rsc.org/images/entities/char_e001.gif) O group (amide band 1), at 1603.65 cm−1 corresponding to the δNH group (amide band 2) and at 1426.45 cm−1 corresponding to C–N stretching (amide band 3) of PAM were found in the synthesized copolymer demonstrating the formation of a suitable PVA grafted PAM polymer hydrogel. It might be interesting to note that the peaks of amide band 1 and amide band 2 disappeared and the peak of amide band 3 was shifted from 1426.45 cm−1 to 1433.41 cm−1 in MLPH. This might be due to incorporation of molybdate within the polymer hydrogel (curve B). In curve B, the peak at 872.61 cm−1 appeared due to the asymmetric Mo–O bond vibration mode of molybdate which disappeared in Fig. 4a curve C due to the formation of an arsenatomolybdate complex. The characteristic band at 832.71 cm−1 was observed in the spectrum of MLPH after adsorption of arsenate (curve C) and was due to As–O stretching vibrations. This peak was not present in curve A and curve B and hence this peak could appear due to arsenate adsorption by the PVA grafted PAM strip.
O group (amide band 1), at 1603.65 cm−1 corresponding to the δNH group (amide band 2) and at 1426.45 cm−1 corresponding to C–N stretching (amide band 3) of PAM were found in the synthesized copolymer demonstrating the formation of a suitable PVA grafted PAM polymer hydrogel. It might be interesting to note that the peaks of amide band 1 and amide band 2 disappeared and the peak of amide band 3 was shifted from 1426.45 cm−1 to 1433.41 cm−1 in MLPH. This might be due to incorporation of molybdate within the polymer hydrogel (curve B). In curve B, the peak at 872.61 cm−1 appeared due to the asymmetric Mo–O bond vibration mode of molybdate which disappeared in Fig. 4a curve C due to the formation of an arsenatomolybdate complex. The characteristic band at 832.71 cm−1 was observed in the spectrum of MLPH after adsorption of arsenate (curve C) and was due to As–O stretching vibrations. This peak was not present in curve A and curve B and hence this peak could appear due to arsenate adsorption by the PVA grafted PAM strip.
EDX analysis
The MLPH (before and after adsorption of arsenate) was characterized by EDX. The corresponding EDX spectra of MLPH before adsorption of As(V) (Fig. 3d) showed the peaks corresponding to the elements C, O and Mo, confirming the existence of molybdenum on the surface of the composite. The presence of a peak corresponding to arsenic in the EDX spectra of arsenate adsorbed MLPH (Fig. 3e) suggested that arsenic sorption took place in the polymer matrix.Color development of MLPH
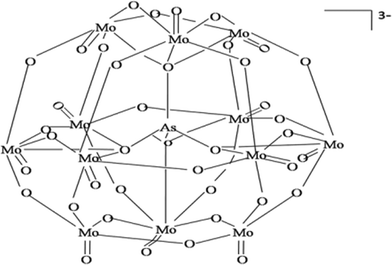
It is well known that molybdenum oxides form a heteropolyacid with arsenate (i.e. antimonyl–arseno–molybdate complex) which turns into molybdenum blue in the presence of L-ascorbic acid (i.e. under reductive conditions) (eqn (4) and (5)). Potassium antimony(III) tartrate hemihydrate speeds up the reaction process. The same reaction occurred within the hydrogel phase after adsorption of arsenate. The arsenate molybdate complexes prepared in this study could form a Keggin-like chemical structure within the solution showed in Fig. 2.31| AsO43− + 12(NH4)2MoO4 + 24H+ → (NH4)3AsO4 · 12Mo+6O3 + 21NH4+ + 12H2O | (4) |
| (NH4)3AsO4 · 12Mo+6O3 + (reducing agent) → (molybdenum blue) + (weaker reducing agent) | (5) |
Detection of arsenate and preparation of standard color chart
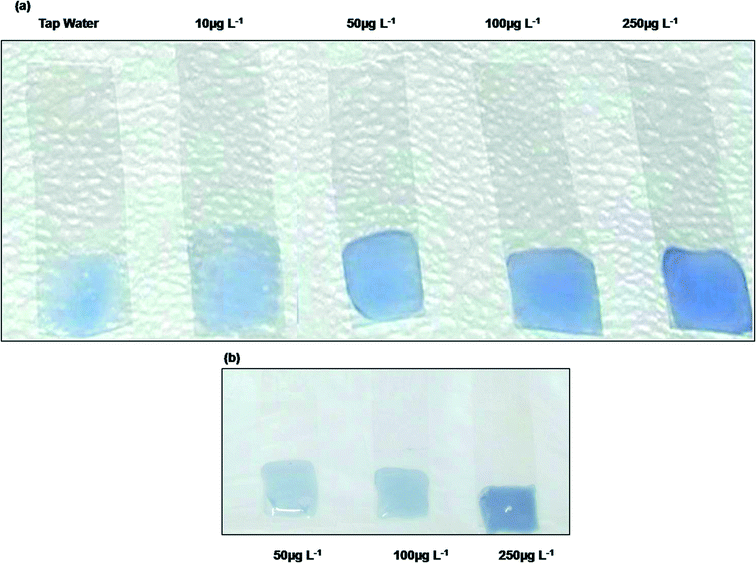
Standard arsenic(V) solutions of 10–250 μg L−1 together with a blank were measured using this method. The intensity of the blue color increased with the increase in concentration of arsenate in water. A standard color chart for arsenate was prepared based on variations of the intensity of the blue color (Fig. 5a). The dipstick sensor was also tested with 1000 μg L−1 arsenite, but no blue color appeared. For the regions where water contains significant quantities of arsenic(III) in addition to arsenic(V), As(III) could be oxidized to As(V) using some oxidizing agent e.g. KIO3.20 The test applied on this oxidized sample would thus give the total arsenic [As(III) + As(V)] value. Thus the sensing kit is not strictly limited to only As(V) measurement but it indirectly might give assessment of As(III) by difference [total − As(V)].Calibration curve
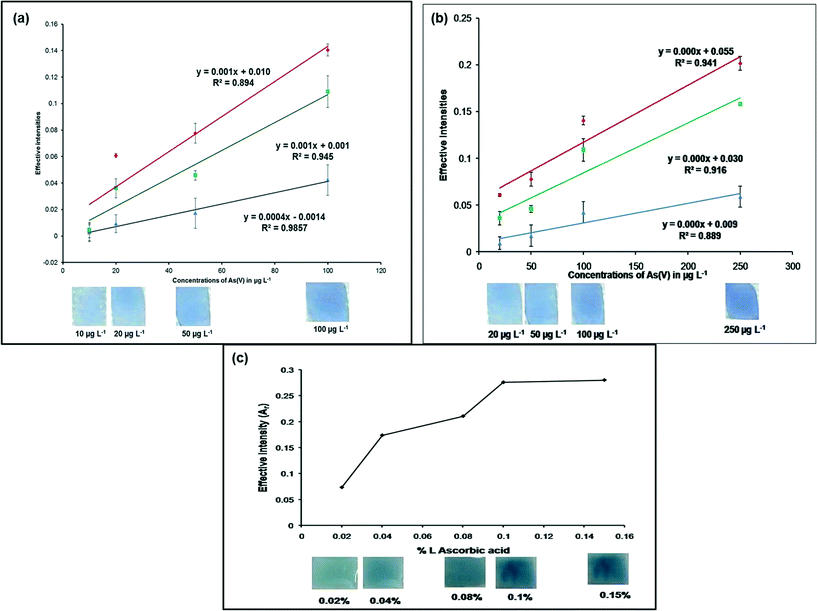
The proof of concept for this research work is presented in Fig. 6a and b. The calibration curve was obtained by plotting 10–250 μg L−1 of As(V) concentrations against their corresponding effective intensities (Fig. 6a and b). It could be concluded from Fig. 6a and b that more than one response could be used for determination of the arsenic(V) concentration. Fig. 6a depicts that the B values were more sensitive (R2 = 0.9857) in the range 10–100 μg L−1 of As(V) and Fig. 6b indicated good sensitivity of the R values (R2 = 0.941) in the 20–250 μg L−1 of As(V) concentration range.Effect of L-ascorbic acid (%) (reducing agent) concentration
The effect of L-ascorbic acid concentration on the detection of arsenate was investigated (Fig. 6c) using 300 μg L−1 As(V) solutions. From Fig. 6b, it could be seen that for higher concentrations of As(V), the R values were more sensitive, thus effective intensities of the R values were considered for this analysis. An increase in the effective intensity (Ar) (from 0.02% L-ascorbic acid) was observed with increasing concentrations of L-ascorbic acid, up to 0.1%, when the system reached a plateau. Further addition of L-ascorbic acid (0.15%) to the system did not affect the signal response of the MLPH sensing strips. Based on the observed results, an L-ascorbic acid concentration of 0.1% (i.e. 10 mg in 10 ml of As(V) solution) was selected as the optimum concentration for this study.Detection limit and detection time
The optimal complex formation time was found to be 20 minutes at room temperature. To restrict the optimal complex formation time, a number of experiments were performed. For a particular composition of the film, the time varies. However, 20 minutes was the shortest period for the stipulated concentration of reagents. All other compositions gave either a higher time or leakage of color. The minimum detection limit of this process was 10 μg L−1 of arsenate present in water (by visual observation). These strips could detect arsenate in drinking water in the range of 10–250 μg L−1. The RGB analysis showed that the method could give within 95% confidence limit when compared with the corresponding AAS results (Tables 2and 3).Interference study
We found that in the case of low as well as high concentration range of phosphate, the green (G) values might predict phosphate very well. For 100 μg L−1 of phosphate, the G value was 0.066. We could only get the B and R value responses (which were important in the case of arsenate detection) when the phosphate concentration is above 100 μg L−1. From this we can conclude that the arsenate detection method by the present molybdenum blue dipstick sensor could suffer from phosphate interference when the phosphate concentration was only above 100 μg L−1 (Fig. 5b). Thus the dipstick sensor for arsenate was free from phosphate interference up to 100 μg L−1.If there are possibilities of high phosphate concentration in water, a test could be conducted to confirm whether it is more than 100 μg L−1. In such cases, 20 ml of water will be treated with 1 g of sulfamic acid and 100 mg of sodium borohydride to reduce all arsenic to arsenic hydride, AsH3, a volatile gas, in about 10 minutes time.23 The water will have no arsenic and a test with the dipstick sensor can be used on this sample to check if the concentration of phosphate is higher than 100 μg L−1. If this produces a color then RGB analysis would give the intensity. The fresh sample will be checked with the dipstick and if it generates more intensity, the difference (either B or R values) will be due to the presence of arsenate in the sample. In our study we considered phosphate (PO43−) not the phosphorous (P) interference.
In the case of the iron interference study, we found that in both cases [3 mg L−1 of iron + 10 μg L−1 of As(V) and 3 mg L−1 of iron + 250 μg L−1 of As(V)] the color of the dipstick sensor matched the color of the strips dipped in iron-free 10 μg L−1 and 250 μg L−1 of arsenate solutions. Thus our kit is free from interference from iron at up to at least 10 times the WHO recommended limit.
Blank tap water was tested for the presence of iron using a Merck iron test kit (114![[thin space (1/6-em)]](https://www.rsc.org/images/entities/char_2009.gif) 759) and <0.1 mg L−1 of iron was found. The presence of phosphate in the tap water was checked by the process described in the interference study and <10 μg L−1 of phosphate was found.
759) and <0.1 mg L−1 of iron was found. The presence of phosphate in the tap water was checked by the process described in the interference study and <10 μg L−1 of phosphate was found.
Field study and precision of the arsenic(V) detection by the molybdenum blue dipstick
The proposed dipstick method was successfully applied to the field samples and field experiments were performed in three different establishments of CGCRI (Central Glass and Ceramic Research Institute, Kolkata) at Barasat, 24 Parganas (North), West Bengal. Additionally, the conventional spectrophotometric molybdenum blue method19 was used to estimate arsenic(V) to compare the results. The standard deviation (SD) and relative standard deviation (RSD) for 3 replicates for both the methods were calculated and reported in Table 1. In all the trials, the % variations between the means of the results of the proposed method and the conventional spectrophotometric molybdenum blue method were less than 10% (Table 1).| Test results | ||||||
|---|---|---|---|---|---|---|
| Sample no. | Arsenic(V) found by the conventional method | Arsenic(V) found by the proposed molybdenum blue dipstick method | Deviation between the means (μg L−1) | % Variation | ||
| a Higher ranges detected via dilution of samples. | ||||||
| 001(BARASAT Akrampur Pilot Plant latitude: 22.2300°N longitude: 88.4500°E) | X ± SD (μg L−1) | % RSD | X ± SD (μg L−1) | % RSD | 2 | 0.44 |
| 451.33 ± 1.53 | 0.336 | 453.33 ± 5.77a | 1.27 | |||
| 02(BARASAT Nivedita Palli, latitude: 22.2300°N longitude: 88.4500°E) | 351 ± 1.0 | 0.284 | 353.33 ± 5.77a | 1.63 | 2.33 | 0.66 |
| 03(BARASAT R. K. Mission Bamunmura, latitude: 22.2300°N longitude: 88.4500°E) | 191.67 ± 1.53 | 0.798 | 185 ± 5a | 2.70 | 6.67 | 3.48 |
The proposed method was also applied to groundwater samples collected from Baruipur, South 24 Parganas, West Bengal, Ashokenagar, Kalyanghar, North 24 Parganas, West Bengal and Chakdah, South 24 Praganas, West Bengal, Kalyani, North 24 Parganas, West Bengal, Barasat, South 24 Parganas, West Bengal, Nadia, West Bengal. For some of the field samples, the measurements were done just after the collection and the others were acidified with 0.1% HCl20 and tested later. The AAS measurements of the same samples are summarized in Table 2. Table 2 was constructed using RGB analysis. The correlation coefficient between lower and higher arsenic(v) concentrations measured by the present method and AAS was found to be 0.9961 and 0.9981, respectively (Fig. 4b and c) which suggested a good agreement with the AAS results. It might be noted that all the samples might contain only As(V) as there was little difference between the proposed method of As(V) estimation [valid for only As(V)] and the AAS [valid for total arsenic i.e. As(III) + As(V)] results. In case arsenite [As(III)] is present in water sample, it can be oxidized to arsenate [As(V)]20 and measurement by dipstick would give total arsenic [As(V) + As(III)] and could be compared with AAS results. The blank tap water was tested for arsenic using the very well known commercially available Merck kit (Merck Arsenic Test method: colorimetric with test strips, 0.005–0.5 mg L−1 As3+/5+, prod.: 1.17927.0001, batch: HC80062, Merckoquant®) and also by AAS. No traces of arsenic were found. All the field samples were tested for phosphate concentration using the procedure described in the interference study. Fortunately in all the cases, we found <100 μg L−1 of phosphate. Iron in the field samples had also been tested using the Merck, Germany Iron Test (114![[thin space (1/6-em)]](https://www.rsc.org/images/entities/char_2009.gif) 759) kit. In all the cases, we found <0.2 mg L−1 of iron. The low as well as the high arsenic concentrations for the field study (Table 2) were again tested 4 times each with the proposed method and statistical t-test was conducted with the test results from AAS considering a p-value of 0.05 (i.e., 95% confidence limit) and the results are tabulated in Table 3. The t-test indicated that there was no significant difference between the analytical results obtained by the proposed dipstick method and the conventional method at the confidence value of 95%.
759) kit. In all the cases, we found <0.2 mg L−1 of iron. The low as well as the high arsenic concentrations for the field study (Table 2) were again tested 4 times each with the proposed method and statistical t-test was conducted with the test results from AAS considering a p-value of 0.05 (i.e., 95% confidence limit) and the results are tabulated in Table 3. The t-test indicated that there was no significant difference between the analytical results obtained by the proposed dipstick method and the conventional method at the confidence value of 95%.
| Sample no. | Place from where the arsenic contaminated sample was collected | Arsenic(V) concentrations detected by the present molybdenum blue dipstick method | Arsenic(V) concentrations detected by AAS | % Deviation between the means | ||
|---|---|---|---|---|---|---|
| a Higher ranges were detected via dilution of samples. | ||||||
| 01 (tap water) | Kolkata, West Bengal latitude: 22°34′203210.92′′N longitude: 88°22′10.92′′E | X ± SD (μg L−1) | % RSD | X ± SD (μg L−1) | % RSD | — |
| <10 | — | Not traceable | — | |||
| 02 | Chakdah, South 24 Praganas, West Bengal. latitude: 23.07605°N longitude: 88.52546°E | 12.75 ± 0.5 | 3.92 | 13.5 ± 1 | 7.41 | 5.56 |
| 03 | Baduria, North 24 Praganas, West Bengal. latitude: 22.7286274°N longitude: 88.8022842°E | 17.5 ± 0.58 | 3.31 | 18.25 ± 0.5 | 2.74 | 4.11 |
| 04 | Kalyani, North 24 Parganas, West Bengal, latitude: 22.9750°N longitude: 88.4344°E | 19.75 ± 0.5 | 2.53 | 18.5 ± 1 | 5.41 | 6.75 |
| 05 | Nadia, West Bengal. latitude: 22.7059105°N longitude: 88.7530076°E | 24.75 ± 0.5 | 2.02 | 26 ± 0.82 | 3.14 | 4.80 |
| 06 | Barasat, South 24 Parganas, latitude: 22.2300°N longitude: 88.4500°E | 33.75 ± 2.5 | 7.41 | 36.5 ± 1 | 2.74 | 7.53 |
| 07 | Nadia, West Bengal. latitude: 22.7059105°N longitude: 88.7530076°E | 39.5 ± 2.5 | 2.53 | 40.5 ± 1.29 | 3.19 | 2.47 |
| 08 | Barasat, South 24 Parganas, latitude: 22.2300°N longitude: 88.4500°E | 46.25 ± 0.5 | 1.08 | 48.75 ± 0.96 | 1.96 | 5.13 |
| 09 | Ashokenagar, Kalyanghar, North 24 Praganas, West Bengal. latitude: 22.833°N longitude: 88.633°E | 51.25 ± 2.5 | 4.88 | 54 ± 1.41 | 2.62 | 5.09 |
| 10 | Kalyani, North 24 Parganas, West Bengal, latitude: 22.9750°N longitude: 88.4344°E | 74.75 ± 0.5 | 0.67 | 79.25 ± 0.96 | 1.21 | 5.68 |
| 11 | Baruipur, South 24 Praganas West Bengal. latitude: 22.57485°N longitude: 88.3983°E | 103.25 ± 0.5 | 0.48 | 112 ± 1.63 | 1.46 | 7.81 |
| 12 | Chakdah, South 24 Praganas, West Bengal. latitude: 23.07605°N longitude: 88.52546°E | 251.25 ± 0.5a | 0.2 | 272.5 ± 1.73 | 0.64 | 7.8 |
| 13 | Baruipur, South 24 Praganas West Bengal. latitude: 22.57485°N longitude: 88.3983°E | 382.5 ± 5a | 1.31 | 389.25 ± 2.87 | 0.74 | 1.73 |
| Sample name | Calculated t-valuea | Tabulated t-value (P = 0.05) for (n = 4)a |
|---|---|---|
| a In all the cases the calculated t-values did not cross the tabulated t-value at 95% confidence level. | ||
| Sample 02 | 1.34 | 2.45 |
| Sample 03 | 1.97 | 2.45 |
| Sample 04 | 2.24 | 2.45 |
| Sample 06 | 2.04 | 2.45 |
| Sample 07 | 1.22 | 2.45 |
| Sample 08 | 2.31 | 2.45 |
| Sample 13 | 2.34 | 2.45 |
Reproducibility of the system
The measurements obtained from four different dipsticks for four concentrations of arsenic (110, 55, 15, and 12 μg L−1) were used for this study. Table 4 shows that the RSD obtained from the ratio of standard deviation to the mean value for each set of four strips was below 5%.| Serial no. | Concentrations of As(V) solutions in μg L−1 | Average | Standard deviation | Relative standard deviation (%) | The concentration values corresponding to the B values from the calibration curve in μg L−1 |
|---|---|---|---|---|---|
| 1 | 110 | 0.04245 | 0.0001 | 0.3611 | 109.625 |
| 2 | 55 | 0.019 | 0.00082 | 4.2973 | 51 |
| 3 | 15 | 0.0043 | 0.000173 | 4.0754 | 14.125 |
| 4 | 12 | 0.00305 | 0.000129 | 4.2328 | 11.125 |
Cost, shelf life of test kit and comparison with other test kits
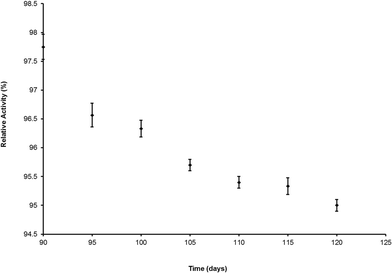
The arsenate detection procedure needed only 10 ml of water sample. If we have to perform the detection of phosphate interference test then a total of 30 ml of water sample will be needed. The images were captured by a very low cost camera and analysed using Adobe Photoshop (free software). The production cost of each strip would be around INR 0.04. If we consider the As(III) oxidation cost, phosphate interference testing cost along with the reducing agent cost then the total cost per test would be INR 1.90 (~$0.03), which is much lower than the running cost of other arsenic detection kits available in the market. The detailed cost comparison study is provided in Table 5. The preliminary test by a single dipstick sensor showed that if it was stored at room temperature, 70% humidity and in light, after 120 days of storage, the dipstick sensor retained 95% of its initial detection ability. The stability of the proposed sensor was checked using arsenate spiked water (250 μg L−1) (Fig. 7).| Kits | Arsenic detection form | Detection nature | Detection range in μg L−1 | Detection limit in μg L−1 | Response time in minutes | Cost | Shelf-life | |
|---|---|---|---|---|---|---|---|---|
| Capital cost | Operating cost | |||||||
| HACH Arsenic Test Kit, U.S.A | Total arsenic [As(V) + As(III)] | Visual | 0–500 | 10 | 30–35 | Not available | $1.67 per test | Not available |
| Arsenator® Digital Arsenic Test Kit, Wagtech WTD, Palintest Ltd, United Kingdom | Total As | Digital | 0–100 | 2 | 20 | Not available | $4.59 per test | Not available |
| QUANTOFIX® Arsenic Sensitive, MACHEREY-NAGEL GmbH & Co. KG, Düren, Germany, Product No. 91345 | Total As | Visual | 0–500 | 5 | 10 | Not available | $1.01 per test | 2.5 years |
| Quick™ Arsenic Test Kit, Industrial test systems, Inc., United States of America Part Number: 481396 | Total As | Visual | 0–>500 | 5 | 12 | Not available | $1.78 per test | Not available |
| Merckoquant® Arsenic (highly sensitive) (Merck Germany, Product No. 1.17927.0001) | Total As | Visual | 0–500 | 5 | 20 | Not available | $2 per test | 2 years |
| Present kit | Arsenate [As(V)], total As, phosphate | Visual + RGB analysis | 0–250 | 10 | 20 | NIL for visual observation (only for RGB analysis, camera – $50, software free, tab – $100) | 1. Production cost per strip – INR 0.04 | 4 months |
| 2. Arsenite oxidation cost per test – INR 0.01 | ||||||||
| 3. Phosphate testing cost per test – INR 1.78 | ||||||||
| 4. L-Ascorbic acid cost per test – INR 0.07 | ||||||||
| Total cost per test – INR 1.90 ~$0.03 | ||||||||
Conclusions
A novel visual polymer hydrogel-based colorimetric sensor strip was used for the detection of arsenate in water. This system was based on the reaction of arsenate with ammonium molybdate which produced a blue arseno–molybdate complex in the presence of the reducing agent (i.e.L-ascorbic acid). This system was sensitive with a detection limit as low as 10 μg L−1 of As(V) by the naked eye. The sensor strips displayed selectivity in the presence of <100 μg L−1 of phosphate and 3 mg L−1 of iron. The molybdenum blue arsenic(V) detection dipstick method was simple, extremely cheap ($0.03 per test), accurate, portable and user-friendly for the onsite analysis of water samples when used only by visual observation. The RGB analysis with the developed color gave interesting results and any As(V) concentration could be measured quantitatively by digital analysis with the help of additional instruments i.e. camera and computer. The kit did not require any instrument, power or any other utilities when detection is compared with a standard chart by visual observation. It might be noted that the strips could also be useful for measurement of total arsenic [As(III) + As(V)] and phosphate with minor changes in the measurement procedure. The strips showed stability for four months and could be used conveniently by a layman. The strips could find applications by non-governmental organizations (NGOs) involved in social work and individuals.Acknowledgements
The authors are indebted and thankful to DST (WTI) for a project grant (DST File no. DST/TDT/WTI/2 K9/133).References
- P. Sarkar, S. Banerjee, D. Bhattacharyay and A. P. F. Turner, Ecotoxicol. Environ. Saf., 2010, 73, 1495–1501 CrossRef CAS PubMed.
- I. A. Katsoyiannis, M. Mitrakas and I. A. Zouboulis, Desalin. Water Treat., 2015, 54, 2100–2107 CrossRef CAS.
- M. J. Watts, M. Button, J. O. Reill, A. L. Marcilla, R. A. Shaw and N. I. Ward, Environ. Geochem. Health, 2010, 32, 479–490 CrossRef CAS PubMed.
- M. Asadollahzadeh, N. Niksirat, H. Tavakoli, A. Hemmati, P. Rahdari, M. Mohammadi and R. Fazaeli, Anal. Methods, 2014, 6, 2973–2981 RSC.
- H. Miao, G. Wuer and X. Shuangshuang, Anal. Methods, 2014, 6, 1796–1801 RSC.
- M. Chen, Y. Lin, C. Gu and J. Wang, Talanta, 2013, 104, 53–57 CrossRef CAS PubMed.
- B. Chen, W. T. Corns, P. B. Stockwell and J.-H. Huang, Anal. Methods, 2014, 6, 7554–7558 RSC.
- P. Li, X.-Q. Zhang, Y.-J. Chen, H.-Z. Lian and X. Hu, Anal. Methods, 2014, 6, 4205–4211 RSC.
- I. N. Pasias, N. S. Thomaidis, E. B. Bakeas and E. A. Piperaki, Environ. Monit. Assess., 2013, 185, 6867–6879 CrossRef CAS PubMed.
- I. N. Pasias, N. S. Thomaidis and E. A. Piperaki, Microchem. J., 2013, 108, 1–6 CrossRef CAS.
- K. Chandrasekaran, M. V. BalaramaKrishna and D. Karunasagar, J. Anal. At. Spectrom., 2010, 25, 1348–1353 RSC.
- R. A. Dar, N. G. Khare, D. P. Cole, S. P. Karna and A. K. Srivastava, RSC Adv., 2014, 4, 14432–14440 RSC.
- D. Li, J. Li, X. Jia, Y. Han and E. Wang, Anal. Chim. Acta, 2012, 733, 23–27 CrossRef CAS PubMed.
- P. Salaün, K. B. Gibbon-Walsh, G. M. S. Alves, H. M. V. M. Soares and C. M. G. Van den Berg, Anal. Chim. Acta, 2012, 746, 53–62 CrossRef PubMed.
- K. Gibbon-Walsh, P. Salaün and C. M. G. Van den Berg, Anal. Chim. Acta, 2012, 710, 50–57 CrossRef CAS PubMed.
- M. A. Ferreira and A. A. Barros, Anal. Chim. Acta, 2002, 459, 151–159 CrossRef CAS.
- B. Liu and J. Liu, Chem. Commun., 2014, 50, 8568–8570 RSC.
- K. Siegfried, C. Endes, C. A. F. Md. K. Bhuiyan, A. Kuppardt, J. Mattusch, J. R. V. D. Meer, A. Chatzinotas and H. Harms, Environ. Sci. Technol., 2012, 46, 3281–3287 CrossRef CAS PubMed.
- M. Salman, M. Athar, W. U. Zaman, U. Shafique, J. Anwar, R. Rehman, S. Ameer and M. Azeem, Anal. Methods, 2012, 4, 242–246 RSC.
- R. K. Dhar, Y. Zheng, J. Rubenstone and A. V. Geen, Anal. Chim. Acta, 2004, 526, 203–209 CrossRef CAS.
- L. A. Dal Cortivo, M. Cefola and C. J. Umberger, Anal. Biochem., 1960, 1, 491–497 CrossRef CAS PubMed.
- A. Baghel, B. Singh, P. Pandey and K. Sekhar, Anal. Sci., 2007, 23, 135–137 CrossRef PubMed.
- J. Das, P. Sarkar, J. Panda and P. Pal, J. Environ. Sci. Health, Part A: Toxic/Hazard. Subst. Environ. Eng., 2014, 49, 108–115 CrossRef CAS PubMed.
- J. Kearns and J. Tyson, J. Anal. Methods Chem., 2012, 4, 1693–1698 RSC.
- R. B. Sharma, S. Joshi and S. Amlathe, Anal. Methods, 2011, 3, 452–456 RSC.
- T. Okazaki, W. Wang, H. Kuramitz, N. Hata and S. Taguchi, Anal. Chem., 2013, 29, 67–72 CAS.
- T. Okazaki, H. Kuramitz, N. Hata, S. Taguchi, K. Murai and K. Okauchi, Anal. Methods, 2015, 7, 2794–2799 RSC.
- L. K. S. De Almeida, S. Chigome, N. Torto, C. L. Frost and B. I. Pletschke, Sens. Actuators, B, 2015, 206, 357–363 CrossRef CAS.
- N. Tudorachi, Mater. Plast., 2008, 45, 326–331 CAS.
- K.-F. Arndt, T. Schmidt and R. Reichelt, Polymer, 2001, 42, 6785–6791 CrossRef CAS.
- E. G. Fidalgo, A. Neels, H. Stoeckli-Evans and G. Süss-Fink, Polyhedron, 2002, 21, 1921–1928 CrossRef CAS.
| This journal is © The Royal Society of Chemistry 2016 |

