Morphology, structure, and metal binding mechanisms of biogenic manganese oxides in a superfund site treatment system†
O. W.
Duckworth
*a,
N. A.
Rivera
ab,
T. G.
Gardner
a,
M. Y.
Andrews‡
a,
C. M.
Santelli
c and
M. L.
Polizzotto
a
aDepartment of Crop and Soil Sciences, North Carolina State University, Raleigh, North Carolina 27695, USA. E-mail: owen_duckworth@ncsu.edu; Fax: +1-919-515-1267; Tel: +1-919-513-1577
bDepartment of Civil and Environmental Engineering, Duke University, Durham, NC 27708, USA
cDepartment of Earth Sciences, University of Minnesota, Minneapolis, MN 55455, USA
First published on 1st December 2016
Abstract
Manganese oxides, which may be biogenically produced in both pristine and contaminated environments, have a large affinity for many trace metals. In this study, water and Mn oxide-bearing biofilm samples were collected from the components of a pump and treat remediation system at a superfund site. To better understand the factors leading to their formation and their effects on potentially toxic metal fate, we conducted a chemical, microscopic, and spectroscopic characterization of these biofilm samples. Scanning electron microscopy revealed the presence of Mn oxides in close association with biological structures with morphologies consistent with fungi. X-ray absorption spectroscopy (XAS) and X-ray diffraction (XRD) revealed the oxides to be a mixture of layer and tunnel structure Mn(IV) oxides. In addition, XAS suggested that Ba, Co, and Zn all primarily bind to oxides in the biofilm in a manner that is analogous to synthetic or laboratory grown bacteriogenic Mn oxides. The results indicate that Mn oxides produced by organisms in the system may effectively scavenge metals, thus highlighting the potential utility of these organisms in designed remediation systems.
Environmental impactFouling of water treatment systems hinders the remediation of contaminated sites. In many cases, deposits formed on system components may contain biogenic minerals precipitated in a biofilm matrix. Biogenic deposits, in particular those containing manganese oxides, may oxidize and sorb metals, affecting their fate within the treatment systems. This study explores the mineralogy and metal (Ba, Co, Zn) binding mechanism of biofilm deposits collected from the components of a “pump and treat” system at a superfund site that is often impacted by the buildup of Mn oxides. This work thus not only helps to elucidate how biofouling affects the treatment process but also may provide insight into how biominerals may behave when incorporated into designed remediation systems as metal scavengers. |
Introduction
Environmental remediation, the reclamation of land or water from pollution for productive use, is both a pressing societal need and an >$18 billion dollar industry in the United States.1 In recent years, an emphasis has been placed on developing innovative technologies for in situ remediation. However, more traditional strategies are still widely utilized for cleaning polluted soil and water. For example, “pump and treat” systems have been established at superfund sites across the US and, despite the limitation of approaches that rely on groundwater extraction, these systems remain the major tool for groundwater remediation.2,3A widespread issue that may affect the function of pump and treat remediation systems is fouling, a process by which deposits of calcium (Ca), iron (Fe), or manganese (Mn)-containing minerals form on systems components, especially air strippers.4 In many cases, these deposits are associated with biofilms, which contain organisms that may promote the precipitation of oxide or carbonate minerals. The formation of these precipitates negatively impacts the efficacy of systems, and may dramatically increase the cost of operating pump and treat remediation systems.5
Manganese(III/IV) oxides and oxyhydroxides, referred to hereafter as “Mn oxides”, are of particular interest in remediation systems. Unlike Fe2+, which rapidly precipitates under aerobic circumneutral conditions and thus is relatively easily removed from waste streams, the oxidation of Mn(II) is slow at circumneutral pH. Consequently, Mn2+ may persist in aerobic water and Mn(III,IV) precipitation is typically promoted by microorganisms.6 Thus, Mn mineral deposits may form as scales when anaerobic groundwater is pumped into aerobic treatments systems, potentially complicating remediation goals if not managed appropriately.
However, Mn oxides, particularly those that are biologically produced, are also of technological importance and may be utilized in water treatment and environmental remediation.7,8 Manganese oxides in marine systems are known as “scavengers of the sea” due to their large sorption capacity for metals.9 In addition, Mn oxides are effective oxidants, capable of degrading myriad organic pollutants via redox reactions.10 It is thus of particular interest to better understand the properties of Mn oxides formed in remediation systems not only to better control their formation within existing systems, but also to determine if controlled precipitation of biogenic Mn oxides may be useful in future designed remediation systems.7,11,12 Furthermore, Mn oxidizing microorganisms from treatment systems may be particularly suited for use in remediation because they may be tolerant of potentially toxic components found in waste streams.8,13–15
Currently, little is known about the properties of Mn oxides produced in pump and treat remediation systems. In this paper, a geochemical approach was employed to study the morphology, structure, and metal binding mechanisms of Mn oxides embedded in biofilms formed on the components of a pump and treat remediation system at a superfund site in North Carolina. Scanning electron microscopy was utilized to examine the relationship between microbes and oxide minerals. X-ray absorption spectroscopy and X-ray diffraction determined the structures of the Mn oxides in the system. In addition, wet chemical data coupled to X-ray absorption spectroscopy was used to better understand how oxides bind trace metals within the system.
Materials and methods
Sample collection
Samples in this study were collected from the lot 86, farm unit 1 superfund site (“Lot 86 site”), located in Raleigh, North Carolina (35°14′N, 78°43′W). At this site, metal and solvent contaminated groundwater was pumped into a multicomponent treatment system that was established in 2006.16 Following a prolonged interruption in system operation caused by biofouling, the site was sampled in May 2012.A schematic of the treatment system is shown in ESI Fig. S1.† The pH (pH = 6.6) and water temperature (12–14 °C) were consistent throughout the system. Water samples were collected from the raw influent (I), the process tank (PT), intermediate tank (IT), activated carbon column (CC), and effluent tank (ET), and passed through a 0.2 μm filter. Aliquots of these samples were subsequently analyzed for dissolved organic carbon (Shimadzu TOC-5050 total carbon analyzer). Additionally, subsamples were acidified with trace metal grade HCl prior to measuring dissolved cations (As, Ba, Ca, Fe, Mn, Na, Zn, Co, Cr, Cu, Ni, and Pb) using a Perkin Elmer Optima 2000 DV optical ICP emission spectrometer (ICP-OES) or Varian 820-MS ICP-mass spectrometer (ICP-MS).
Biofilm samples were collected from the interior walls (including caps) of the air stripper (AS), IT, CC, ion exchange columns (IC), and ET using sterile spatulas to scrape materials directly into sterile falcon tubes. Samples of biofilm (black, containing biominerals) were first dried to quantify water content; however, quantification of sample mass was complicated by the presence of column materials in samples collected from the carbon and the ion selective resin columns. These solid grains were intimately mixed with the biofilm and could not be separated from the biofilm prior to sample digestion. To estimate mass, samples were dried and weighed before digestion, and then any solid residue remaining after digestion was collected, dried, and weighed. Biofilm samples were weighed into capped 15 mL tubes in duplicate and digested in 5 mL 0.1 N oxalic acid in a 60 °C water bath for several days, with periodic vortexing to mix. Trace grade HCl (100 μL) was then added to dissolve any iron minerals and the samples were vortexed to mix. Solid residue was filtered out using dried Whatman 42 paper and weighed as described above. Samples from AS were weighed prior to digestion only, as there were no column materials in these samples. The supernatant was then passed through 0.2 μm filters and analyzed for cation concentrations as described for the influent groundwater.
Scanning electron microscopy
The morphology of biofilms from remediation system components were examined using a scanning electron microscope (SEM) equipped with energy dispersive spectrometry (EDS). To prepare for SEM/EDS analysis, biofilm samples were transferred to a 15 mL plastic conical tube and centrifuged at low RCF to promote deposit settling. The supernatant solution was decanted and replaced with 2.5% glutaraldehyde in a 0.2 M sodium phosphate buffer at pH 7.0. Samples were resuspended by vortexing and stored at 4 °C overnight. The samples were then rinsed 3 times with deionized water, followed by a progressive dehydration by rinsing with increasing concentrations of ethanol (30, 50, 70, 80, 90, and 100% v/v).Processed substrate bearing samples were critical point dried using a Leica EM CPD300 manual critical point dryer. Samples were mounted on stubs using carbon tape and coated with silver paint, and then analyzed for composition at selected spots by using a focused ion beam scanning electron microscope (FEI Quanta 3D FEG, with gaseous analytical detector, housed at the Smithsonian Institution, National Museum of Natural History) equipped with an energy dispersive X-ray spectrometer (EDS) operated at 15 keV under low vacuum. Following EDS analysis, the samples were coated with carbon to a thickness of about 1 nm using a BAL-TEC Med 020 Sputter Coater, and the morphologies of the biofilm samples were observed using scanning electron microscopy.
X-ray diffractometry
X-ray diffraction analysis of biofilm samples was conducted by using a Rigaku D/MAX Rapid micro diffractometer with an imaging plate detector (housed at the Smithsonian Institution, National Museum of Natural History). A small amount of each sample (ca. 2–4 mg) was air-dried and glued to the tip of a thin glass capillary tube, and then exposed to X-rays from a Mo source for 5–10 minutes. The resulting images were imported into the Area Max program (Rigaku) and converted to a 2-D line scan.X-ray absorption spectroscopy
Biofilm samples were analyzed by X-ray absorption spectroscopy (XAS) at ambient temperature on beamlines 11–2, 4–1, and 4–3 at the Stanford Synchrotron Radiation Lightsource (SSRL) under dedicated conditions (3 GeV, 500 mA) using an unfocused beam. Biofilm masses equating to approximately one absorption length were deposited on a cellulose acetate filter for Mn K-edge analysis, with filters mounted in polycarbonate holders (1 mm thick) with Kapton tape windows. Sample for Co, Ba, and Zn metal analysis were packed into polycarbonate holders with Lexan windows.Manganese K-edge spectra were collected on beamline 4–1 in transmission mode. A Si(220) monochromator was detuned approximately 40% to reject higher order harmonics. Zn and Co K-edge spectra were collected on beamline 11–2 in fluorescence mode by using a 100-element Ge detector equipped with a Z-1 filter and Soller slits. A Si(220) monochromator was detuned approximately 35% to reject higher order harmonics. The energy scale was calibrated to the derivative maxima of the respective metal foils (Mn = 6539 eV, Zn = 9659 eV, and Co = 7709 eV). Barium LIII-edge spectra were collected on beamline 4–3 using a Si(111) variable-exit monochromator and a vortex-ME4 four element silicon drift detector. Harmonics were rejected using Rh-coated mirrors, and energy was calibrated by setting the third inflection point of a spectrum of a vanadium foil to 5465 eV. Multiple spectra were collected for each sample, with no evidence of beam damage in successive scans, and averaged to improve the signal-to-noise ratio.
Estimates of proportions of various chemical species present in the Lot 86 biofilm samples were made using the linear combination fitting (LCF) routine in Athena17 to determine the combination of scaled X-ray absorption near edge structure (XANES) and extended X-ray absorption fine structure (EXAFS) spectra from standards that gave the best-fit to sample spectra.18 All reported data are normalized to 100%, with raw summations ranging from 95–106% ± 2–10%. Proportions of spectra for standards that yield the “best fits” (lowest statistical goodness of fit) to sample spectra when summed are considered as being estimates of analogous species in the Lot 86 samples. We used XANES fits to eliminate lower valence spectra from our EXAFS fits. A list of all candidate spectra used in the initial fits are listed in the ESI (Table S1†).
Results and discussion
Composition of the biofilm and water
The concentrations of metals in water samples are shown in Fig. 1. Iron is found at 9.1 mg L−1 in the influent but is <0.1 mg L−1 in all other system components. This trend is consistent with oxidation of Fe2+ and precipitation of Fe(III) minerals in the PT (which had a red-stained bag filter on its outlet) and AS (where Fe in the solid phases is largest). Dissolved Mn is found at concentrations <5 mg L−1 throughout the system, with the exception of the CC (26 mg L−1). The concentrations of Co, Cu, Pb, and Ni (μg L−1) all have their first and second largest concentrations in CC and influent, respectively, following the same general trend in concentration as Mn (cf.Fig. 1A and B); however, significant correlations between dissolved concentrations exists only between Cu and Mn (p = 0.043; data not shown). Major base cations Ca and Na vary by a factor of two within the system, both with maximum concentrations in the PT (Fig. 1A). Dissolved Zn and Ba are found at concentrations varying from 0.01–0.13 mg L−1 throughout the system (Fig. 1C). In all samples, As and Cr were below the limit of reliable quantitation (<3.5 and <1.0 μg L−1, respectively). It is important to note that, because of the interruption to system activity, concentrations are not representative of those present in treated water during normal system function.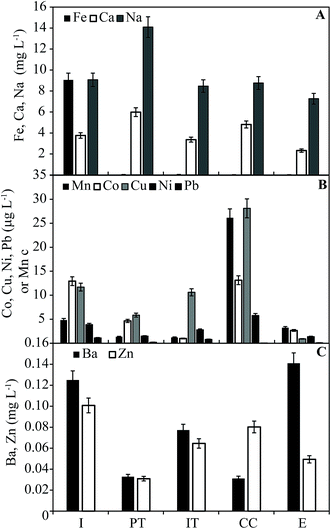 | ||
| Fig. 1 Dissolved metals in water samples collected from the treatment system. Error bars are based on estimated analytical error (7%). | ||
The concentrations of metals in biofilm samples are shown in Fig. 2. Iron is found in highest concentration in the AS (57 mg g−1), consistent with its removal from the water stream in the IT and AS. In biofilm samples, Mn concentration vary from 0.05–31% w/w. Concentrations (0.4–9.0 μg g−1) of Ba (p < 0.001), Co (p < 0.05), and Zn (p < 0.001) correlate with Mn in samples (not shown). These elements are known to sorb strongly to Mn oxides, including those that are biologically produced.9 The low concentrations of metals in the solids also may be due to the presence of carbon beads that could not be separated from the solid samples prior to digestion, resulting in a higher undissolved residual fraction.
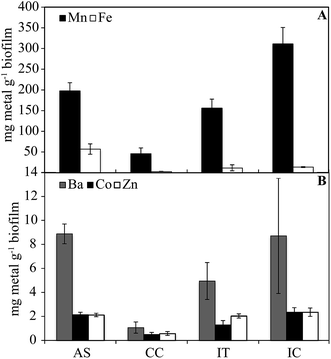 | ||
| Fig. 2 Concentrations of metals in biofilm samples from each system component (dry weight basis). Error bars are based on the calculated standard error. | ||
Morphology of biofilms
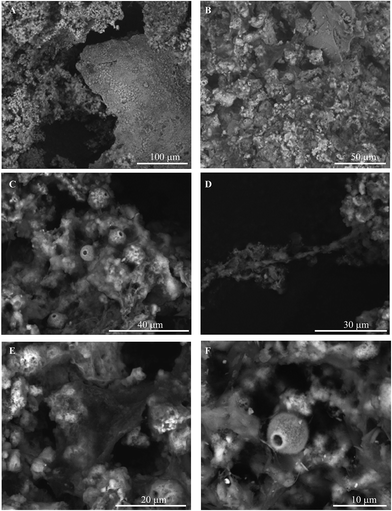
Examples of SEM micrographs representative of biofilm samples collected from the treatment system are presented in Fig. 3. Images of samples collected from the air stripper, carbon column, and ion exchange column all show similar morphologies, revealing complex assemblages of materials with morphologies consistent with microbial structures and minerals (Fig. 3A and B). Evident in images throughout the system are fibril structures (ca. 1 μm by >30 mm; Fig. 3D) and rounded forms (ca. 10 μm in diameter; Fig. 3A–F) with a small hole, consistent with the hyphae and reproductive structure (e.g., ascospores) of fungi, respectively. Additionally, there are ball-like, platy, and web-like structures that are similar to those seen in micrographs containing phyllosilicate and phyllomanganate minerals (Fig. 3A, B and E).Energy dispersive spectroscopy (EDS) was conducted on biotic and mineral structures in the images. The spectra reveal a dominant presence of Mn (80 ± 10% expressed as simple oxide based on the average and standard deviation of ten spot measurements; data not shown) associated with platy structures, small ball-like assemblages, and biological structures, consistent with the ubiquitous presence of Mn oxides.13 The EDS spectra also reveal the presence of Fe in the air stripper and activated carbon column, and minor contributions from Al, K, P, Ba, Ti, S, Cl and Na (<5% expressed as simple oxide; data not shown). These elements are likely components of the waste plume, although it is also possible that several of these elements (e.g., Mn, Al, and Fe) may have been derived from native minerals (geogenic origin) within the plume.19
The intimate mixture of Mn oxides and biological structures suggests the presence of Mn oxides produced by microorganisms, specifically fungi. This assertion is consistent with results of a culture survey in which 95% of Mn oxidizing organisms isolated from this system were fungi.20 In addition, fungi have been identified as important constituents of metal oxidizing microbial communities in a number of polluted sites.8,14,15 It is important to note that although multiple lines of evidence support a role of Mn oxidizing fungi in Mn oxide formation, other organisms, and possibly abiotic oxidation, may also contribute to Mn oxide formation in our system.6,21
Structure of manganese oxides
Manganese K-edge X-ray absorption spectra of biofilm samples are shown in Fig. 4. The maximum energy position of the white line for all the Mn oxides centers around 6562 eV, similar in position to Mn(IV) standards (Fig. 4A). However, linear combination fitting (Fig. 4B) indicates the presence of a lower valence phase, which is best fit by 10–22% Mn(III), resulting in an average Mn oxidation number (AMON) of 3.78–3.9. These values are consistent with prior measurements of AMON in biogenic oxides.13,22–26 Furthermore, FT magnitudes of EXAFS spectra (Fig. 4C) show a large first-shell peak at R + ΔR ≈ 1.4 Å, which is consistent with the known Mn(IV)–O octahedral bond distance, further indicating a predominance of Mn(IV) in the solids (Table 1).27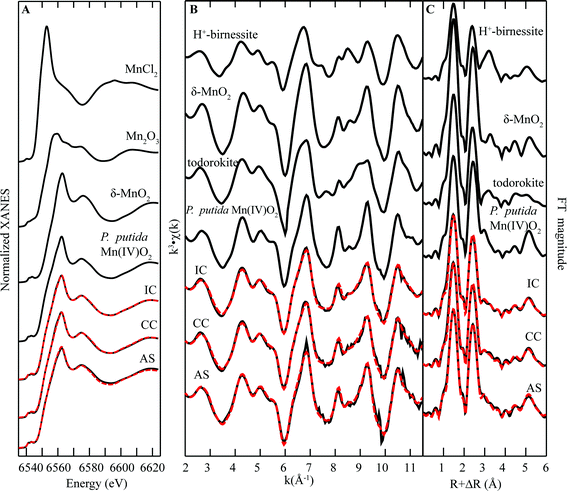 | ||
| Fig. 4 Mn K-edge (A) XANES spectra, (B) EXAFS spectra, and (C) FT magnitude plots of standards and biofilm samples from remediation components at Lot 86. The fitting data (dashed red lines) overlay the data (solid black lines). Reference spectra used in the fits are shown above the experimental data and fits, with all candidate spectra considered listed in ESI Table S1.† | ||
| Element/sample | XANES spectral fit components (%)b | ||
|---|---|---|---|
| Manganese | Mn(IV) | Mn(III) | R-factorc |
| a Mn: Mn(IV)-δ-MnO2 + mycogenic δ-MnO2; Mn(III)–Mn2O3; Mn(II)–MnCl2. Co: Co(III)–Co(OH)3; Co(II)–Co(OH)2. b Sum of the data values of individual components (%) are normalized to 100. R-factor = ∑(data − fit)2/∑(data2). c Parameter uncertainties calculated by Athena. | |||
| AS | 78 ± 5 | 22 ± 2 | 0.001 |
| CC | 90 ± 2 | 10 ± 2 | 0.0004 |
| IS | 88 ± 2 | 12 ± 2 | 0.0002 |
| Cobalt | Co(III) | Co(II) | R-factorc |
|---|---|---|---|
| AS | 100 | 0 | 0.01 |
| CC | 100 | 0 | 0.01 |
| IS | 100 | 0 | 0.01 |
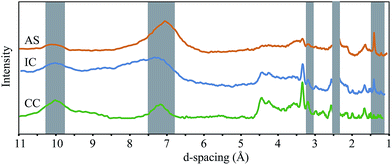
Visual inspection of EXAFS spectra shows a characteristic beat pattern seen in Mn(III,IV) oxide standards (Fig. 4B). Further analysis of the EXAFS region of the spectra of biofilm samples helped to elucidate the structure of Mn(III,IV) in biofilm samples. Inspection of the “indicator region” between k = 6.5–9.5 Å−1, a sensitive region of the spectrum that can be used to differentiate between layer and tunnel Mn(III,IV) oxide structures,13 reveals relatively sharp peaks at k = 8 Å−1 and 9.3 Å−1, which are consistent with features of spectra that are diagnostic layer-type Mn oxides (e.g. birnessite). However, the region between these peaks is relatively flat for the AS sample where there is significant upward slope in the CC and IC samples. Qualitative interpretation suggest that all samples contain layer-type oxides, with the CC and IC samples containing a higher percentage of tunnel structure minerals (e.g. todorokite). This qualitative interpretation is consistent with linear combination fits of EXAFS spectra with standards, which suggest that AS is predominantly composed of layer type oxides (∼81%) whereas IC samples contain a more even mixture of tunnel and layer-type minerals (57–63% layer-type; Table 2).
| Sample | EXAFS spectral fit components (%)a | ||
|---|---|---|---|
| Mn | Layer-type MnO2 | Todorokite | R-factorb |
| a Sum of the data values of individual components (%) are normalized to 100. R-factor = ∑(data − fit)2/∑(data2). b Parameter uncertainties calculated by Athena. | |||
| AS | 81 ± 3 | 19 ± 3 | 0.02 |
| CC | 63 ± 4 | 37 ± 2 | 0.02 |
| IC | 57 ± 4 | 43 ± 4 | 0.04 |
| Zn | Zn sorbed to P. putida produced Mn oxide | Zn sorbed to Fe biominerals | R-factorb |
|---|---|---|---|
| AS | 92 ± 3 | 8 ± 4 | 0.07 |
| CC | 74 ± 3 | 26 ± 4 | 0.06 |
| IC | 87 ± 2 | 13 ± 3 | 0.04 |
| Co | Co sorbed to P. putida produced Mn oxide | R-factorb |
|---|---|---|
| AS | 100 | 0.2 |
| CC | 100 | 0.2 |
| IC | 100 | 0.1 |
| Ba | Ba sorbed to δ-MnO2 | BaCl2 | R-factorb |
|---|---|---|---|
| AS | 73 ± 7 | 27 ± 7 | 0.1 |
| CC | 52 ± 9 | 48 ± 8 | 0.2 |
| IC | 69 ± 11 | 31 ± 10 | 0.2 |
X-ray diffractograms for air-dried samples are shown in Fig. 5. Peaks at near 2.4, 1.4, and 1.2 Å are present in both birnessite and todorokite; however a broad peak near 7 Å represents a (001) stacking peak in layer-type oxides whereas peaks near 9.8–9.5, 4.3, and 3.1 Å are consistent with the spectra of todorokite.28 These results suggest a relatively smaller quantity of todorokite in the AS sample relative to the IC and CC samples, an interpretation which is consistent with our EXAFS results.
It is worth noting that bacteria and fungi are known to produce both layer-type and tunnel structure Mn oxides,13,24 and that a number of other factors may affect the formation of tunnel structure minerals, including Mn(III) content of the oxide,29 identity of the Mn oxidizing organism,13 and dissolved metal ions present.29
Trace metal speciation in biofilm samples
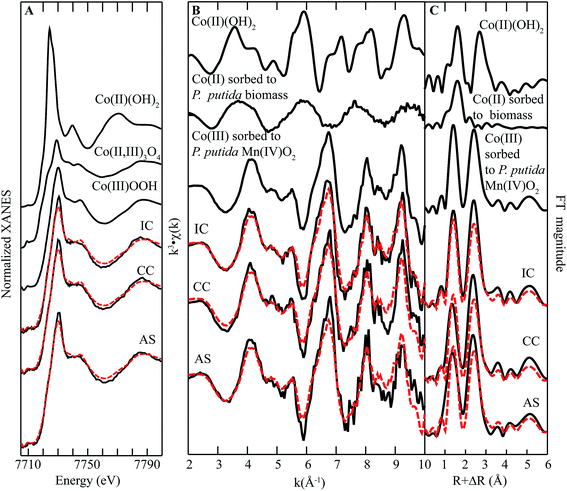 | ||
| Fig. 6 Co K-edge (A) XANES spectra, (B) EXAFS spectra, and (C) FT magnitude plots of standards and biofilm samples from remediation components at Lot 86. The fitting data (dashed red lines) overlay the data (solid black lines). Reference spectra used in the fits are shown above the experimental data and fits, with all candidate spectra considered listed in ESI Table S1.† | ||
The EXAFS region of the spectra for Co in biofilms collected from all parts of the system closely resemble the spectra of Mn in biofilm samples (cf.Fig. 6B and 4B). The qualitative similarity of these spectra indicates that the Co is in a similar coordination environment to Mn, which is consistent with incorporation of Co(III) in the layer structure of Mn(III,IV) oxides. Moreover, the EXAFS region of the spectra can be fit by one component-Co(III) incorporated into biogenic Mn oxide produced by the model Mn oxidizing bacterium Pseudomonas putida MnB1.30 These observations suggest that Co in these biofilms is predominantly incorporated into the structure of Mn oxides as a trivalent ion.
Typically, dissolved Co is found in the divalent state, with the trivalent state considered insoluble and unstable (with respect to reduction) at circumneutral pH unless stabilized by a high-affinity ligand.31 Previous studies have shown than Co(II) may be oxidized by Mn(III) or Mn(IV) within the oxide structure.32–35 The resulting Co(III), which is similar in size to Mn(IV), is then rapidly (ca. hours36) incorporated into the layer structure of the oxide by incorporation into vacancy sites or by growth at edges. It is worth noting that inspection of the FT magnitude (Fig. 6C) plot shows a misfit in the second shell, indicating Co in the sample contains more second shell neighbors than in the standard. This increase in neighboring Mn suggests preferential incorporation at defect sites. However, a recent study comparing the structures of Mn oxides produced by P. putida GB1 and a Mn oxidizing fungus isolated from the Lot 86 site noted that the bacteriogenic oxide contained more defects,37 suggesting that this difference in amplitude could also result from structural characteristics of the Mn oxides.36
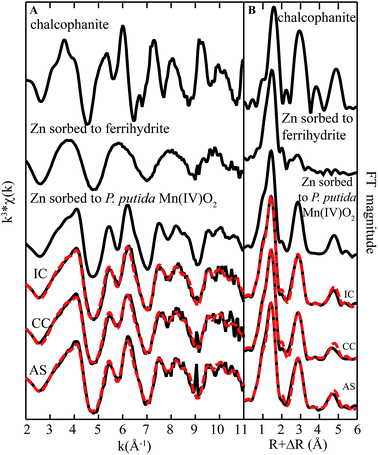 | ||
| Fig. 7 Zn K-edge (A) EXAFS spectra and (B) FT magnitude plots of standards and biofilm samples from remediation components at Lot 86. The fitting data (dashed red lines) overlay the data (solid black lines). Reference spectra used in the fits are shown above the experimental data and fits, with all candidate spectra considered listed in ESI Table S1.† | ||
Interestingly, the fit was not improved by inclusion of model organic compounds that have been used to represent microbial biomass (viz. Zn-citrate, Zn-acetate, or Zn-phytate). However, data were best fit with a minor contribution (8–26%) from one additional component-octahedral Zn sorbed to a biogenic ferrihydrite-like phase.39 It is worth noting that although iron is abundant in AS, only small concentrations of iron are found in the solid phase throughout the rest of the system. The presence of this iron bound component in fits suggests that Zn may be bound to, in addition to Mn oxides, iron rich domains within the biofilm.
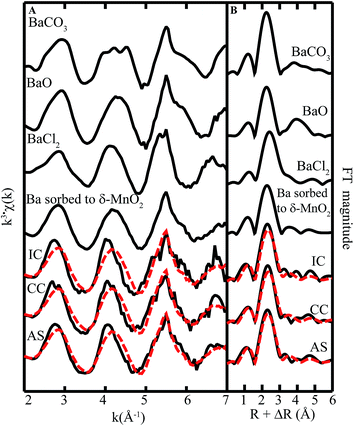 | ||
| Fig. 8 Ba L3-edge (A) EXAFS spectra and (B) FT magnitude plots of standards and biofilm samples from remediation components at Lot 86. The fitting data (dashed red lines) overlay the data (solid black lines). Reference spectra used in the fits are shown above the experimental data and fits, with all candidate spectra considered listed in ESI Table S1.† | ||
We also note that there is some misfit between the LCF model and the data (cf. superimposed red and black lines in Fig. 8A), suggesting the presence of a phase that is poorly represented by our set of model compounds (ESI Table S1†). Other phases that could be significant to Ba speciation include todorokite or aluminosilicate clay minerals.40 It should be noted that attempts to fit the data with a spectrum representing Ba(II) sorbed Na-4-mica, a layer type aluminosilicate mineral, as well as Ba acetate, oxide, hydroxide, carbonate, and sulfate,41 did not improve the fit.
Conclusions
Our results indicate that Mn oxides with structures and morphologies consistent with biogenic minerals were present in all components of the treatment system at the Lot 86 site. Manganese may be present in high concentrations in reducing groundwater simply from natural sources,19 and it is therefore likely that Mn scale may be a widespread issue even in groundwater treatment systems where Mn is not a component of the waste. Because Mn does not rapidly abiotically oxidize and precipitate under circumneutral oxic conditions, Mn mineral deposition is typically controlled by microbial activities. The morphologies observed in our micrographs are consistent with fungal structures, which have been shown to be resilient in other contaminated sites and remediation systems.8,13–15Although mineral scales are generally viewed as a hindrance to treatment systems, the Mn oxides formed in the Lot 86 system also have the potential to sequester problematic metals. Interestingly, both the structure of Mn oxides and the binding of Ba, Co, and Zn in our biofilm samples are similar to those observed with laboratory grown bacteriogenic Mn oxides. This may be somewhat surprising because the conditions these oxides are produced under are quite different than our treatment system. Firstly, the laboratory minerals are typically produced by pure cultures (possibly distinct from organism treatment system communities) in carefully selected growth media. Secondly, they are often exposed to metals after mineral formation is complete. Thirdly, sorption experiments are typically conducted with a single metal ion at a time. The ability of the oxides to approximate the sorption behavior of several metals to minerals grown by a microbial consortium in a complex waste stream suggests that these surrogates are, at least in this case, an effective model for Mn oxides formed in contaminated environments. These results further suggest that a large body of knowledge9,42,43 collected on these model systems, which identifies which metal ions are candidates for remediation and also notes specific information about the binding structure of the ions, may be leveraged to better utilize fungal Mn oxides for metal sequestration in designed remediation systems.
The results have additional implications for the use of biogenic Mn oxides for environmental remediation. Although Mn oxides in general are high-affinity sorbents of metals, the sorption capacity of layer-type minerals generally exceed those of tunnel structure and lower valence oxides for most metals.44 Optimization of metal sequestration would thus require utilizing a system that favors birnessite precipitation. Although many biogeochemical factors may affect mineralogy, our results suggest a subaerial environment favors birnessite-like mineral formation.
Acknowledgements
We thank Adrian Finch, Brandy Toner, and Jaquelin Peña for providing standard XAS spectra used in fitting. We thank Bruce Stewart for assistance in sampling. We are grateful for support received from the National Science Foundation Environmental Chemical Sciences Program (award CHE-1407180) and a NCSU Research Innovation and Seed Funding program. TGG acknowledges support from an NCSU College of Agriculture and Life Sciences Dean's postdoctoral fellowship. Use of the Stanford Synchrotron Radiation Lightsource, SLAC National Accelerator Laboratory is supported by the U. S. Department of Energy, Office of Science, Office of Basic Energy Sciences under Contract No. DE-AC02-76SF00515.References
- IBISWorld, Remediation and Environmental Cleanup in the US: 56291, February 27, 2012 Search PubMed.
- S. S. Suthersan, in Remediation Engineering, ed. S. S. Suthersan, CRC Press, Boca raton, 1996 Search PubMed.
- National Resource Council, Alternatives for Ground Water Cleanup, National Academy Press, Washington, D.C., 1994 Search PubMed.
- B. Horn, Petroleum hydrocarbons and organic chemicals in ground water, Baltimore, Md, 2004 Search PubMed.
- B. Horn, Proceedings of the focus conference on eastern regional ground water, Burlington, VT, 1994 Search PubMed.
- J. J. Morgan, Met. Ions Biol. Syst., 2000, 37, 1–34 CAS.
- N. Miyata and Y. Tani, in Handbook of Metal Biotechnology-Applications for Environmental Conservation and Sustainability, ed. M. Ike, M. Yamashita and S. Soda, Pan Stanford Publishing Pte. Ltd., 2012, pp. 1–37 Search PubMed.
- C. M. Santelli, D. H. Pfister, D. Lazarus, L. Sun, W. D. Burgos and C. M. Hansel, Appl. Environ. Microbiol., 2010, 76, 4871–4875 CrossRef CAS PubMed.
- B. M. Tebo, J. R. Bargar, B. G. Clement, G. J. Dick, K. J. Murray, D. L. Parker, R. Verity and S. M. Webb, Annual Reviews in Earth Planetary Science, 2004, 32, 287–328 CrossRef CAS.
- C. K. Remucal and M. Ginder-Vogel, Environ. Sci.: Processes Impacts, 2014, 16, 1247–1266 CAS.
- I. Forrez, M. Carballa, G. Fink, A. Wick, T. Hennebel, L. Vanhaecke, T. Ternes, N. Boon and W. Verstraete, Water Res., 2011, 45, 1763–1773 CrossRef CAS PubMed.
- T. Hennebel, B. De Gusseme, N. Boon and W. Verstraete, Trends Biotechnol., 2009, 27, 90–98 CrossRef CAS PubMed.
- C. M. Santelli, S. M. Webb, A. C. Dohnalkova and C. M. Hansel, Geochim. Cosmochim. Acta, 2011, 75, 2762–2776 CrossRef CAS.
- C. M. Santelli, D. L. Chaput and C. M. Hansel, Geomicrobiol. J., 2014, 31, 605–616 CrossRef CAS.
- D. L. Chaput, C. M. Hansel, W. D. Burgos and C. M. Santelli, Appl. Environ. Microbiol., 2015, 81, 2189–2198 CrossRef CAS PubMed.
- NCDENR and USEPA, Second five-year review report North Carolina State University Lot 86 Site Raleigh, Wake County, North Carolina, 2008 Search PubMed.
- B. Ravel and M. Newville, J. Synchrotron Radiat., 2005, 12, 537–541 CrossRef CAS PubMed.
- S. D. Kelly, D. Hesterberg and B. Ravel, in Methods of Soil Analysis, ed. A. L. Ulery and L. R. Drees, Soil Science Society of America, Madison, WI, 2008 Search PubMed.
- E. C. Gillispie, R. E. Austin, N. A. Rivera, R. Bolich, O. W. Duckworth, P. Bradley, A. Amoozegar, D. Hesterberg and M. L. Polizzotto, Environ. Sci. Technol., 2016, 50, 9963–9971 CrossRef CAS PubMed.
- O. W. Duckworth, T. G. Gardner, M. Y. Andrews, N. A. Rivera, M. L. Polizzotto, L. Sombers and E. Mitchell, in American Chemical Society Fall Meeting, Boston, 2015 Search PubMed.
- B. M. Tebo, H. A. Johnson, J. K. McCarthy and A. S. Templeton, Trends Microbiol., 2005, 13, 421–428 CrossRef CAS PubMed.
- M. Villalobos, B. Toner, J. R. Bargar and G. Sposito, Geochim. Cosmochim. Acta, 2003, 67, 2649–2662 CrossRef CAS.
- N. Miyata, Y. Tani, K. Maruo, H. Tsuno, M. Sakata and K. Iwahori, Appl. Environ. Microbiol., 2006, 72, 6467–6473 CrossRef CAS PubMed.
- I. Saratovsky, S. J. Gurr and M. A. Hayward, Geochim. Cosmochim. Acta, 2009, 73, 3291–3300 CrossRef CAS.
- S. Grangeon, B. Lanson, N. Miyata, Y. Tani and A. Manceau, Am. Mineral., 2010, 95, 1608–1616 CrossRef CAS.
- N. Miyata, K. Maruo, Y. Tani, H. Tsuno, H. Seyama, M. Soma and K. Iwahori, Geomicrobiol. J., 2006, 23, 63–73 CrossRef CAS.
- R. Shannon, Acta Crystallogr., Sect. A: Cryst. Phys., Diffr., Theor. Gen. Crystallogr., 1976, 32, 751–767 CrossRef.
- S. Bodeï, A. Manceau, N. Geoffroy, A. Baronnet and M. Buatier, Geochim. Cosmochim. Acta, 2007, 71, 5698–5716 CrossRef.
- H. Zhao, X. Liang, H. Yin, F. Liu, W. Tan, G. Qiu and X. Feng, Geochem. Trans., 2015, 16, 8 CrossRef PubMed.
- J. Peña, Ph.D. thesis, University of California, 2009.
- O. W. Duckworth, A. A. Jarzecki, J. R. Bargar, O. Oyerinde, T. G. Spiro and G. Sposito, Mar. Chem., 2009, 113, 114–122 CrossRef CAS.
- A. Manceau, A. I. Gorshkov and V. A. Drits, Am. Mineral., 1992, 77, 1133–1143 CAS.
- A. Manceau, A. I. Gorshkov and V. A. Drits, Am. Mineral., 1992, 77, 1144–1157 CAS.
- A. Manceau, B. Lanson and V. A. Drits, Geochim. Cosmochim. Acta, 2002, 66, 2639–2663 CrossRef CAS.
- A. Manceau, V. A. Drits, E. Silvester, C. Bartoli and B. Lanson, Am. Mineral., 1997, 82, 1150–1175 CAS.
- A. A. Simanova and J. Peña, Environ. Sci. Technol., 2015, 49, 10867–10876 CrossRef CAS PubMed.
- B. Droz, N. Dumas, O. W. Duckworth and J. Peña, Environ. Sci. Technol., 2015, 49, 4200–4208 CrossRef CAS PubMed.
- B. Toner, A. Manceau, S. M. Webb and G. Sposito, Geochim. Cosmochim. Acta, 2006, 70, 27–43 CrossRef CAS.
- A. H. Whitaker, M. Y. Andrews, T. D. Sowers and O. W. Duckworth, Elucidating the structure and reactivity of bacteriogenic iron oxides to better understand contaminant cycling, presented at Soil Science Society of America national meeting, Minneapolis, MN, 2015 Search PubMed.
- D. C. Adriano, Trace Elements in Terrestrial Environments, Springer, New York, 2nd edn, 2001 Search PubMed.
- A. A. Finch, N. Allison, H. Steaggles, C. V. Wood and J. F. W. Mosselmans, Chem. Geol., 2010, 270, 179–185 CrossRef CAS.
- M. Villalobos, in Advances in the Environmental Biogeochemistry of Manganese Oxides, American Chemical Society, 2015, vol. 1197, pp. 65–87 Search PubMed.
- T. G. Spiro, J. R. Bargar, G. Sposito and B. M. Tebo, Acc. Chem. Res., 2011, 43, 2–9 CrossRef PubMed.
- X. H. Feng, L. M. Zhai, W. F. Tan, F. Liu and J. Z. He, Environ. Pollut., 2007, 147, 366–373 CrossRef CAS PubMed.
Footnotes |
| † Electronic supplementary information (ESI) available. See DOI: 10.1039/c6em00525j |
| ‡ Current address: Center for Integrated Fungal Research, North Carolina State University, Raleigh, NC 27695, USA. |
| This journal is © The Royal Society of Chemistry 2017 |

