Formation of environmentally persistent free radical (EPFR) in iron(III) cation-exchanged smectite clay
Ugwumsinachi G.
Nwosu
ab,
Amitava
Roy
c,
Albert Leo N.
dela Cruz
ab,
Barry
Dellinger
ab and
Robert
Cook
*ab
aLouisiana State University, Department of Chemistry, Baton Rouge, LA 70803, USA. E-mail: rlcook@lsu.edu
bLouisiana State University Superfund Research Center, Baton Rouge, Louisiana 70803, USA
cCentre for Advanced Microstructures & Devices, Louisiana State University, 6980 Jefferson Highway, Baton Rouge, Louisiana 70806, USA
First published on 25th November 2015
Abstract
Environmentally persistent free radicals (EPFRs) have been found at a number of Superfund sites, with EPFRs being formed via a proposed redox process at ambient environmental conditions. The possibility of such a redox process taking place at ambient environmental conditions is studied utilizing a surrogate soil system of phenol and iron(III)-exchanged calcium montmorillonite clay, Fe(III)CaM. Sorption of phenol by the Fe(III)CaM is demonstrated by Fourier-transformed infra-red (FT-IR) spectroscopy, as evidenced by the peaks between 1345 cm−1 and 1595 cm−1, and at lower frequencies between 694 cm−1 and 806 cm−1, as well as X-ray diffraction (XRD) spectroscopy, as shown by an increase in interlayer spacing within Fe(III)CaM. The formation and characterization of the EPFRs is determined by electron paramagnetic resonance (EPR) spectroscopy, showing phenoxyl-type radical with a g-factor of 2.0034 and ΔHP-P of 6.1 G at an average concentration of 7.5 × 10¹⁷ spins per g. EPFRs lifetime data are indicative of oxygen and water molecules being responsible for EPFR decay. The change in the oxidation state of the iron redox center is studied by X-ray absorption near-edge structure (XANES) spectroscopy, showing that 23% of the Fe(III) is reduced to Fe(II). X-ray photoemission spectroscopy (XPS) results confirm the XANES results. These findings, when combined with the EPFR concentration data, demonstrate that the stoichiometry of the EPFR formation under the conditions of this study is 1.5 × 10⁻² spins per Fe(II) atom.
Environmental impactThis study presents a systematic approach to studying EPFRs by applying a range of analytical methods to a well-controlled environmental surrogate system of Fe-loaded montmorillonite clay. The goals of this work are to gain a molecular level understanding of the EPFR formation, the influence of environmental conditions on EPFR stability, and also to investigate the frequency with which EPFRs are formed per each reduction occurring on the redox center. The results of this study reveal that (i) EPFRs can be formed at environmentally relevant conditions without the need for a biotic pathway, (ii) EPFR formation is a rare event compared to the number of redox centers reduced, and (iii) environmental conditions play a major role in determining EPFR stability. |
1. Introduction
Clay minerals are important components of soils and act as a potential reservoir of metals and toxic organic pollutants.1,2 Sorption of polycyclic aromatic hydrocarbons (PAHs) and chlorinated aromatic hydrocarbons to clay minerals has been used to remediate organic pollutants;2,3 however, the possible formation of undesirable dioxins render this practice detrimental to the environment.4,5 Organochlorinated contaminants, formed as products and by-products of such remediation processes, are not only toxic in their own right, but the intermediate reactions leading to their formation are also of major concern to environmental safety.6,7 In particular, these intermediate processes result in the formation of surface-stabilized environmentally persistent free radicals (EPFRs).2,8,9 Traditionally, EPFRs have been misidentified as molecular pollutants in soils and particulate matter.10 The stability of an EPFR is associated with the ability of mostly aromatic organic contaminants to undergo chemisorption and form complexes with a redox (transition metal) centre, with the EPFR being formed through a single electron transfer.9,11 In addition to EPFRs playing a role in the transformation of pollutants, radical processes involving EPFRs and organic compounds impact the formation of humic substances, and hence, carbon sequestration.12 It has also been found that EPFR-containing particles can generate reactive oxygen species (ROS) which, in turn, may induce oxidative stress. This can occur in three steps: (1) EPFRs reduce molecular oxygen to superoxide, (2) the superoxide, through disproportion, forms hydrogen peroxide; (3) the reduced metal species formed via EPFR formation participate in Fenton chemistry which, in turn, generates ROS.7 EPFRs have recently been found at elevated concentrations in numerous soil/sediment samples from a range of pentachlorophenol-polluted Superfund sites.13,14 A detailed top-down study found that the EPFRs were almost solely associated with the clay/humic soil fraction.14Other studies have shown that: (1) dioxin radicals can form in the presence of Cu(II) smectite montmorillonite clay mineral,15 (2) pentachlorophenol (PCP) radical cations are generated in Fe(III)-montmorillonite clay,2 and (3) transition metal centres in clay minerals play a key role in the formation of the intermediate radicals in the formation of dioxins.2,5 However, these studies were carried out at conditions not relevant to the EPFR-contaminated Superfund sites as organic solvents were used and/or high temperature and reflux conditions were applied. Our previous investigations also demonstrated the catalytic role of transition metal centres, Cu(II) and Fe(III) supported on silica particles metal surfaces, in the formation of intermediate EPFRs.9,11,16 While important, these studies did not address the type of conditions present at the Superfund sites in which soil EFPRs have been found.
With the remediation of EPFR-contaminated soil systems being the ultimate goal of this research, it is important to first gain a fundamental molecular level understanding of how EPFRs are formed in soils at environmental conditions. The soil matrix, however, due to its complexity, poses major technical challenges for modern molecular level analytical methods, thus a bottom-up approach is appropriate, in which a soil is broken down into its biological, organic, and inorganic components and the role of each of these components is determined individually and in combination with each other. In this effort to systematically reconstruct the geosorbant (here soil) and understand at a molecular level the mechanism of EPFR formation in contaminated soil systems, we report on the use of Fe(III) exchanged montmorillonite clay, designed to model the clay component of a real soil in which EPFR have been shown to concentrate.14 Iron was chosen as the redox centre of interest as it was found to be the most abundant transition metal in the contaminated Superfund sites.13 Phenol was utilized as a simplified model of organic contaminants as it is a well known soil contaminant itself and can be easily produced by microbial reductive dechlorination of chlorophenol and polychlorophenols in contaminated soils,17 and is considered as priority pollutant by U.S. EPA.18 The following analytical techniques were combined in this study: (1) Fourier transformed infrared (FTIR) spectroscopy and X-ray diffraction (XRD) to demonstrate the sorption of the model pollutant, phenol, (2) X-ray photoelectron spectroscopy (XPS) to study the changes in chemical environment of Fe species, the redox centre of interest in this study, and other elements in the clay, (3) electron paramagnetic resonance (EPR) spectroscopy for radical detection and quantification, and (4) X-ray absorption near edge structure (XANES) spectroscopy to investigate the redox change of the Fe centres. This non-biological approach offers insights into the mechanism of the EPFR formation in soils and allows one to measure EPFR lifetimes under environmentally relevant conditions.
2. Experimental
2.1 Materials
Smectite clay (CaM), STx-1b (montmorillonite) with a cation exchange capacity (CEC) of 84.4 meq./100 g and a surface area of 83.79 ± 0.22 m2 g−1, was purchased from the Source Clay Repository (Purdue University, West Lafayette, IN). Iron(III) chloride, FeCl3, was obtained from Sigma Aldrich, analytical grade phenol (loose crystal) was obtained from Mallinckrodt, and trace metal grade nitric acid, HNO3, was obtained from Fisher Scientific.2.2 ICP-OES-analysis
The metal content of the clay samples was determined by inductively coupled plasma optical emission spectroscopy (ICP-OES) using a Varian Vista-MPX CCD Simultaneous ICP-OES. For this analysis, a 0.2 g sample of clay was digested in 5 mL of concentrated HNO3 for approximately 8 h, cooled, and the resultant digestate was diluted to a total volume of 50 mL with 18 MΩ cm water and analyzed.2.3 Gas phase phenol dosing of clay samples
Clay samples were dosed with phenol following a previously reported method.14 Briefly, 50 mg of samples, contained in a 4 mm glass detachable bulb-shaped pyrex reactor with a protruding Suprasil® quartz EPR tube, were exposed to phenol at room temperature in vapor phase by dosing in a custom-made vacuum exposure system. Sample dosing commenced after the attainment of a ∼10−2 mmHg vacuum to allow the removal of interfering organic contaminants. Unreacted physisorbed phenol was evacuated by applying a vacuum of 10−2 mmHg. This procedure resulted in the production of four different samples, namely: pristine montmorillonite (PureCaM), phenol-exposed pristine montmorillonite (DosedCaM), Fe(III)-cation-exchanged montmorillonite (Fe(III)CaM), and phenol-exposed Fe(III)-cation-exchanged montmorillonite (DosedFe(III)CaM). All phenol-exposed samples were protected from light throughout the study.2.4 Sample exposures
Three different sample exposures were used in this study. First, the sample was simply left under vacuum. Secondly, the sample was exposed to ambient air. The third experiment involved exposing the sample to humid air inside a Model 3940 Series Forma Environmental Chamber with the relative humidity and temperature set at 75% and 25 °C, respectively.2.5 Electron paramagnetic resonance (EPR) spectroscopic analysis
EPR measurements were conducted using a dual cavity Bruker EMX 10/2.7 EPR spectrometer with a X-band microwave frequency of 9.78 GHz at room temperature and spectra were recorded under the following instrumental conditions: sweep width of 150 G and 6000 G, attenuator of 20 dB, power of 2.03 mW, modulation frequency of 100 kHz, modulation amplitude of 4 G, sweep time of 41.94 s, time constant of 1.28 ms, conversion time of 20.48 ms, static field of 3460.059 G, centre field of 3488.00 G, receiver gain of 1.0 × 10⁴, and a total of 5 scans. The instrument was calibrated with a 2,2-diphenyl-1-picrylhydrazyl (DPPH) standard.11,202.6 FTIR analysis
Infrared spectra were collected on a Bruker Alpha or Tensor 27 Fourier transform infrared (FT-IR) spectrometer. Powdered clay samples were dispersed directly onto a Pike Miracle ATR cell sample plate as to cover the Pt-diamond crystal. Spectra acquisition was recorded within the frequency ranges of 400 cm−1 to 4000 cm−1 at a minimum resolution of 4 cm−1 by averaging 16 scans.2.7 X-ray analysis
X-ray absorption near edge structure (XANES) spectra were obtained at the wavelength shifter Double Crystal Monochromator (WDCM) beam line of the J. Bennett Johnston, Sr., Center for Advanced Microstructures and Devices (CAMD) located on the 7 T wavelength shifter. Germanium 220 crystals were used in a Lemonnier-type monochromator with design modifications made at Bonn University, Germany. Iron metal foil was used for monochromator calibration at 7112 eV. Samples were prepared by spreading a few μm thick clay powders onto a Kapton™ tape. The measurements in fluorescence mode were made with a 13-element germanium solid state detector (Canberra Industries, Meridian, Connecticut, USA). Multiple scans (2–5 scans each) were performed at room temperature and were averaged using the Demeter software (Ravel and Newville, 2005). Spectra of reagent grade standards of Fe2O3, FeO and Fe3O4 were also collected for least squares fitting. The X-ray diffraction (XRD) data were collected on a PANalytical Empyrean diffractometer using the Cu Kα radiation of λ = 1.5419 Å within 2θ scan range of 5–90°. The X-ray photoelectron spectroscopy (XPS) measurements were performed using the Kratos AXIS 165 XPS/AES system equipped with a monochromatic Al-Kα source and a charge neutralizer, at pass energy of 80 eV for high resolution scans. The step size of 0.05 eV was applied and shifts in binding energies were corrected with a 284.6 carbon 1 s peak as internal reference.3. Results and discussion
Our previous research on particulate matter (PM2.5) proposed that EPFR formation involves an initial physisorption of an organic pollutant, followed by chemisorption and a concurrent single electron transfer process to an active redox (transition metal) centre.9,11,16 In this study we wish to (i) determine if the same processes could take place on a very simple soil surrogate system, namely Fe(III)CaM, under ambient environmental conditions, (ii) monitor the sorption of the organic pollutant (in this case phenol), the formation of the EPFRs, and the reduction of the transition metal centre, (iii) quantify the amount of EFPRs formed and metal centres reduced, as well as (iv) determine the influence of environmental conditions on EPFR stability.3.1 PureCaM and Fe(III)CaM characterization
As shown in Fig. 1A, a reduced basal spacing in the XRD pattern from 1.53 nm for the PureCaM sample to 1.31 nm for the Fe(III)CaM sample indicates the replacement of interlayer Ca(II) cations by Fe(III).21 An XPS survey spectra (Fig. 1B) show intense oxygen peaks associated to the major silicate Si (2s, 2p) and aluminate Al (2s, 2p) metal framework that forms the tetrahedral and octahedral layers in calcium montmorillonite clay.22 The Fe 2p region in the survey after cation exchange appears to intensify after treatment with Fe(III) (inset spectra). This is an indication of Fe(III) exchange with the Al(III) interstitial lattice sites of the octahedral aluminate clay layers.23 Similarly, the intercalation and the replacement of calcium and other interlayer cations with by Fe(III) species are also known to be responsible for such changes.24 Overall, these data strongly suggest that the Fe(III) introduced in the cation exchange procedure is interstitial in nature; however, the possibility of FeOOH coating a small percentage of the clay surface cannot be completely disregarded.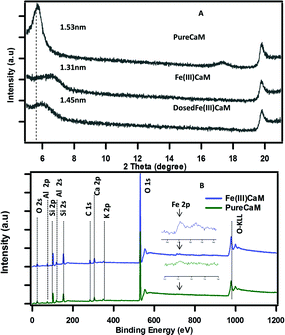 | ||
| Fig. 1 XRD pattern spectra of (A) PureCaM, Fe(III)CaM and DosedFe(III)CaM, (B) XPS survey spectra of (Fe(III)CaM) and PureCaM. Experiment performed with 1.8 × 10⁴ mg kg−1 Fe loading. | ||
3.2 Phenol sorption
The sorption of phenol to the clay samples following the dosing procedure was confirmed using FTIR spectroscopy by the presence of phenol vibrational frequencies in the phenol-dosed samples.The spectral regions presented in Fig. 2A and B are highly diagnostic of phenol sorption. In Fig. 2A sorption of phenol to the DosedCaM and DosedFe(III)CaM samples is shown via the absorption bands at 1595 cm−1, 1501 cm−1, 1474 cm−1, and 1345 cm−1. The double peaks at 1501 cm−1 and 1474 cm−1, along with the peak at 1595 cm−1, are all attributable to the carbon–carbon stretching vibration of phenol, while the bands at 1368 cm−1 and 1345 cm−1 for pure phenol, DosedCaM, and DosedFe(III)CaM are assignable to the in-plane –OH bending.25,26 Other bands seen in Fig. 2B that are associated with the adsorption of phenol appear in the lower frequency region at 755 cm−1 and 694 cm−1 and correspond to the out-of-plane C–H bending.26 Similarly, a shoulder peak at 806 cm−1, typical of the aromatic C–H bending region, indicates adsorption of phenol to the metal cation.26,27 The sorption of phenol is further supported by the increase in the basal spacing observed from the XRD patterns (cf.Fig. 1) between the Fe(III)CaM and DosedFe(III)CaM samples from 1.31 nm to 1.45 nm, respectively. Spectra shown in Fig. 2C reveal a broad and rather featureless envelope of peaks between 3200 cm−1 and 3583 cm−1 for all clay samples and pure phenol, which can be assigned to a number of different hydroxyl group types. The sharp peak at 3628 cm−1 for the clay samples can be assigned to the –OH groups associated with Si(IV) and Al(III) or Fe(III) in the tetrahedral and octahedral sheets.28–30Fig. 2C further shows the corresponding –OH bending absorption bands between 841 cm−1 and 791 cm−1 for octahedral cations (Si(IV), Al(III), and Fe(III)), mainly Al–OH–Fe and Al–OH–Mg.24,28 In addition, H–O–H stretching vibrations from inherent and adsorbed interfacial water molecules and weak hydrogen bonding within the Si–O surfaces have also been known to show strong absorption bands within these regions.28–31
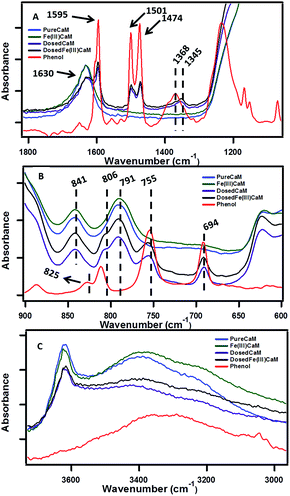 | ||
| Fig. 2 FTIR spectra showing sorption of phenol at different wavenumbers, ranging from 4000 cm−1 to 600 cm−1, with Fe loading of 1.8 × 10⁴ mg kg−1 (expanded view). | ||
3.3 EPFR formation and analysis
The presence of organic radicals, EPFRs, were detected by EPR shortly after the dosing of the Fe(III)CaM with phenol.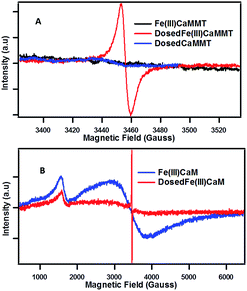 | ||
| Fig. 3 EPFR generation: EPR spectra for Fe(III)CaM with Fe loading of 1.8 × 10⁴ mg kg−1 and DosedFe(III)CaM at (A) 150 G and (B) 6000 G spectral width. | ||
The example of Fe(III) illustrates the importance of transition metal centres and their exact speciation. It is further supported by the fact that the DosedCaM system does not form EPFRs. While PureCaM does inherently possess Fe(III) centres, they are located at the enclosed inner lattice sites in the octahedral clay layer. This hinders phenol–Fe(III) interactions, preventing EPFR formation, as indicated by no radicals being detected in the DosedCaM system. This demonstrates that intercalated Fe(III) species are mainly responsible for the formation of the organic radicals through a single-electron oxidation of phenol.11,16 Furthermore, a change in colour from brownish yellow for Fe(III)CaM to greyish green for the DosedFe(III)CaM also confirms the occurrence of a redox process; this has been previously observed for the Fe(III) reduction to Fe(II) in montmorillonite clays.34
3.4 Role of redox centres in EPFR formation
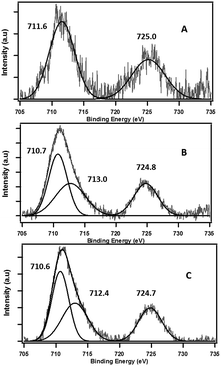
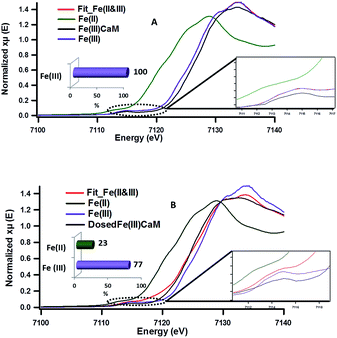
The role of the Fe(III) redox centre was further studied by a combination of high resolution XPS and XANES.The expanded insets of the Fig. 5A and B show the emergence of an intense and broad peak in the post phenol-dosed sample spectrum DosedFe(III)CaM and in its spectral fit (Fit_Fe(II & III)). It results in a slight deviation from the pre-edge centroid position. This type of shift has been previously associated with a change in oxidation state of Fe(III).38–42 However, further explanation can be ascribed to the distortion in the coordinating ligands after chemisorption, with the subsequent replacement of ligating species, such as –OH and H2O, following a single electron transfer from phenol molecules.38,39,42 This possible distortion in the 1s → 3d pre-edge transitions during electron transfer (Fe(III) → Fe(II)) in the octahedral coordination environment, may explain the intensity gain observed for Fit_Fe(II & III) as a result of their quadrupolar character.38,40,41 This finding corroborates the initial EPR observations. Furthermore, the Fe(III)CaM and Fit_Fe(II & III) spectra appear to align with the standard Fe(III) spectrum, both in the 1s → 4s (main-edge) and in the 1s → 3d (pre-edge) transition regions, demonstrating a 100% Fe(III) composition in the pre-phenol-dosed sample (Fe(III)CaM) with no distortion in the coordination environment. In summary, the XANES data support the proposal that phenol is chemisorbed to the Fe redox centre and, via electron donation, reduces Fe(III) to Fe(II), and reinforce the EPFR formation mechanism presented in Scheme 1.
3.5 Influence of Fe(III) loading in Fe(III)CaM on EPFR concentration
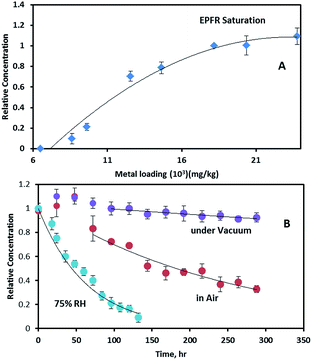
To further investigate the relationship between Fe concentration and EPFR formation, Fe(III)CaM samples with different Fe loadings were prepared from Fe solutions of varying concentrations, ranging from 0.0021 M to 0.025 M, following previously stated procedures.19 Upon exposure to phenol, an increase in the Fe(III) loading concentration from ∼8 × 10³ mg kg−1 to ∼2.4 × 10⁴ mg kg−1 caused a non-linear increase in the EPFR concentration (cf.Fig. 6A). EPFR concentrations obtained when the Fe loading concentrations were between ∼1.8 × 10⁴ and 2.4 × 10⁴ mg kg−1 were found to be statistically within the same range. This observation can be explained as follows: at low Fe loadings (8 × 10³ mg kg−1 to 1.0 × 10⁴ mg kg−1) only a few Fe(III) centres are available for EPFR formation. Due to steric effects, the adsorbed phenoxyl radicals prevent additional phenol molecules from accessing Fe(III) centres.11 However, at higher Fe loading concentrations (>1.0 × 10⁴ mg kg−1), more and more Fe(III) centres become available for reaction with phenol. The data also show that, at 1.8 × 10⁴ mg kg−1, an optimum number of the appropriate Fe(III) centres are available, beyond which no further EPFR formation occurs. This EPFR saturation can be explained by the fact that, at higher (1.8 × 10⁴ mg kg−1) Fe(III) concentrations, there are either no additional isolated Fe(III) centres, causing any radicals formed to react with each other instead of facilitating EPFR formation or additional Fe(III) are not accessible to sorbed phenol molecules due to steric reasons.3.6 EFPR lifetime analysis
The stability of EPFRs in the atmosphere contributes to their environmental impact. We have investigated this by exposing the Fe(III)CaM-associated EFPRs to air.The growth period also resulted in the g-factor and ΔHp-p of the EPFRs increasing from 2.0034 to 2.0036 and from 6.1 to ∼6.6–6.9 G, respectively. The increase in ΔHp-p is a consequence of concentration broadening.37 The EPFR decay rates and lifetimes were determined employing the pseudo-first-order integrated rate law expression (ln(R/R0) = −kt, where tτ = 1/k, τ = 1/e, e is the base of the natural logarithm, and R/R0 is the ratio of the final to initial radical concentrations).11,16,43 When suspended in vacuum, EPFRs showed significant stability, with decay occurring at a very slow rate of 0.00028 h−1, yielding a 1/e lifetime of τ = 148.8 days. During this decay period, the g-factor and ΔHp-p remained unchanged. For EPFR decay monitored in air, a 1/e lifetime of 10.4 days was observed with a decay rate of 0.0040 h−1. During the in-air decay period, the g-factor and ΔHp-p decreased to 2.0032 and 5.2 G, respectively. The total EPFR lifetimes for the systems under study here are 151.8 days (with 72 h of radical growth) under vacuum compared to 12.4 days (with 48 h of radical growth) in air.
The above lifetimes are longer than the 3.8 days previously reported for EPFRs generated (in air) on a Fe(III)2O3/silica system, a model surrogate of the PM2.5 system,16 dosed with phenol at 230 °C, but shorter than those reported for EPFRs in pentachlorophenol-contaminated soils and real PM2.5 systems. Conversely, multiple decays with longer combined EPFR lifetimes of 39 and 21 – 5028 days were reported for PCP-contaminated soil and real PM2.5 systems, respectively.37,43 The complex nature of the soil matrix, which can consist of polymeric aromatic components of soil organic matter (SOM) and assorted transition metals (Fe(III), Cu(II), Mn(III)),13,14,36,43 may account for the longer lifetimes encountered in the contaminated soil system due to local effects, such as hydrophobic associations and π-stacking, which are common with the SOM systems.13,14,43 Additionally, the long EPFR lifetimes for real PM2.5 samples have been previously explained by the presence of trapped EPFRs, also known as ‘internal radicals’. This trapping, or internalization, protects radicals from molecular oxygen in the environment, hindering the oxidation, and hence, slowing decay processes of these ‘internal’ EPFRs.37 It has also been reported that phenol intercalation can occur in a montmorillonite clay containing organic cations, constricting phenol molecules to their interlayer domain.44 The same intercalation can be assumed for the system under study here, as evidenced by the increase of the basal spacing from 1.31 nm to 1.45 nm for Fe(III)CaM and DosedFe(III)CaM (cf.Fig. 1), causing similar internalization and hindrance to oxidation, resulting in longer EPFR lifetimes for the DosedFe(III)CaM than for the Fe(III)2O3/silica system. Radical dimerization provides another plausible explanation of the prolonged EPFR lifetimes, especially during the radical growth period after air exposure.43 For example, a cyclopentadienyl radical formed from a phenoxyl radical via chlorophenoxyl radical intermediates, as previously implicated in the formation of different types of dioxins.16 Such an occurrence may can also contribute to the slight change in the g-factor and ΔHp-p observed during the radical growth period in this work.
4. Conclusions
It has previously been found that soils with iron concentrations between 14 and 23 × 103 mg kg−1, contaminated with phenols and, to a lesser extent, other organic pollutants, have EFPR concentrations ranging from 5.83 × 10¹⁷ to 20.2 × 10¹⁷ spins per g.13 The complex tri-component biological/mineral/SOM soil system is an analytical challenge, especially for mechanistic studies. This study is an initial step in gaining a mechanistic understanding of how EPFR form in contaminated soils by simplifying the soil system to its mineral components. The mineral component, represented here by montmorillonite clay, was chosen as it has been shown that the vast majority of EPFRs in contaminated soils are associated with this fraction, and that clay systems act as a major metal repository and a sorbent of organic pollutants.13,14,43 This model system yielded EPFR concentrations and lifetimes close to, but lower than, those reported for real world soil samples, with no biological component present. The differences in concentration can be explained by other processes, such as enzyme-enhanced EPFR formation.13,14 The longer EPFR lifetimes for real world soil samples can be explained by SOM stabilization, as we have previously suggested.14Mechanistically, the Fe-loaded montmorillonite system revealed that, under environmentally relevant conditions, an EPFR can be formed by the intercalation sorption of phenol, followed by a transfer of an electron from the phenol to an Fe(III) centre, which results in the reduction of iron to Fe(II). The intercalation of phenol results in the intercalated EPFR, which reduces the ability of oxygen to oxidize this radical, and hence, allows for a long-lived radical. This mechanism can be further extended by the fact that the concentration of EPFRs (spins) are much lower than that of the Fe(II) centres per gram of clay, which leads to the conclusion that a large number of the formed radicals dimerize and form non-radical final products, such as dioxins, and only the isolated radicals become EPFRs. Finally, it was found that high humidity resulted in faster EPFR decay, hence EPFR toxicity may be lower in humid climates.
The strong resistance to oxidation and the stability of these radicals after exposure to air imply that, even without the stabilizing effect of SOM, the formed EPFRs can persist long enough in the soil to increase the chance of the EPFR-containing clay particles being suspended in air by wind and, in turn, inhaled, ultimately causing oxidative stress.7 The critical environmental implication of this work lies in the observation that the clay system, when contaminated, in the absence of any biological components, can form EPFRs at concentrations close to those found in real contaminated soils at ambient temperature, which has wide ranging environmental and human health implications, especially when humidity is relatively low.
Acknowledgements
Support for this research was provided by a grant from the NIEHS Superfund Research Program through grant, 2P42ES013648-03.Notes and references
- H. Holmstrand, D. Gadomski, M. Mandalakis, M. Tysklind, R. Irvine, P. Andersson and Ö. Gustafsson, Environ. Sci. Technol., 2006, 40, 3730–3735 CrossRef CAS PubMed.
- C. Gu, C. Liu, C. T. Johnston, B. J. Teppen, H. Li and S. A. Boyd, Environ. Sci. Technol., 2011, 45, 1399–1406 CrossRef CAS PubMed.
- Y. Soma and M. Soma, Environ. Health Perspect., 1989, 83, 205–214 CrossRef CAS PubMed.
- T. Kunisue, S. Nakanishi, N. Oka, F. Sato, M. Tsurumi and S. Tanabe, Environ. Sci. Technol., 2006, 40, 6919–6927 CrossRef CAS PubMed.
- N. Ferré-Huguet, M. Nadal, M. Schuhmacher and J. L. Domingo, Environ. Sci. Technol., 2005, 40, 61–66 CrossRef.
- B. Dellinger, W. A. Pryor, R. Cueto, G. L. Squadrito, V. Hegde and W. A. Deutsch, Chem. Res. Toxicol., 2001, 14, 1371–1377 CrossRef CAS PubMed.
- M. A. Kelley, V. Y. Hebert, T. M. Thibeaux, M. A. Orchard, F. Hasan, S. A. Cormier, P. T. Thevenot, S. M. Lomnicki, K. J. Varner, B. Dellinger, B. M. Latimer and T. R. Dugas, Chem. Res. Toxicol., 2013, 26, 1862–1871 CrossRef CAS PubMed.
- H. Truong, S. Lomnicki and B. Dellinger, Chemosphere, 2008, 71, 107–113 CrossRef CAS PubMed.
- S. Lomnicki, H. Truong, E. Vejerano and B. Dellinger, Environ. Sci. Technol., 2008, 42, 4982–4988 CrossRef CAS PubMed.
- H. Truong, S. Lomnicki and B. Dellinger, Environ. Sci. Technol., 2010, 44, 1933–1939 CrossRef CAS PubMed.
- L. W. Kiruri, L. Khachatryan, B. Dellinger and S. Lomnicki, Environ. Sci. Technol., 2014, 48, 2212–2217 CrossRef CAS PubMed.
- Z. Sun, B. Tang and H. Xie, Energy Fuels, 2015, 29, 1269–1278 CrossRef CAS.
- A. L. N. dela Cruz, R. L. Cook, B. Dellinger, S. M. Lomnicki, K. C. Donnelly, M. A. Kelley and D. Cosgriff, Environ. Sci.: Processes Impacts, 2014, 16, 44–52 CAS.
- A. L. N. dela Cruz, W. Gehling, S. Lomnicki, R. Cook and B. Dellinger, Environ. Sci. Technol., 2011, 45, 6356–6365 CrossRef CAS PubMed.
- S. A. Boyd and M. M. Mortland, Environ. Sci. Technol., 1986, 20, 1056–1058 CrossRef CAS PubMed.
- E. Vejerano, S. Lomnicki and B. Dellinger, Environ. Sci. Technol., 2010, 45, 589–594 CrossRef PubMed.
- J. M. Tront, B. K. Amos, F. E. Löffler and F. M. Saunders, Environ. Sci. Technol., 2006, 40, 529–535 CrossRef CAS PubMed.
- F. Fu, D. D. Dionysiou and H. Liu, J. Hazard. Mater., 2014, 267, 194–205 CrossRef CAS PubMed.
- Y.-L. Ma, Z.-R. Xu, T. Guo and P. You, J. Colloid Interface Sci., 2004, 280, 283–288 CrossRef CAS PubMed.
- U. G. Nwosu and R. L. Cook, Environ. Eng. Sci., 2015, 32, 14–22 CrossRef CAS PubMed.
- P. J. Wallis, A. L. Chaffee, W. P. Gates, A. F. Patti and J. L. Scott, Langmuir, 2010, 26, 4258–4265 CrossRef CAS PubMed.
- N. H. Tran, M. A. Wilson, A. S. Milev, G. R. Dennis, G. S. K. Kannangara and R. N. Lamb, Sci. Technol. Adv. Mater., 2006, 7, 786–791 CrossRef CAS.
- M. A. Martinluengo, H. Martinscarvalho, J. Ladriere and P. Grange, Clay Miner., 1989, 24, 495–504 CAS.
- Z. Huang, P. Wu, H. Li, W. Li, Y. Zhu and N. Zhu, RSC Adv., 2014, 4, 6500–6507 RSC.
- A. Popov, E. Kondratieva, J.-P. Gilson, L. Mariey, A. Travert and F. Maugé, Catal. Today, 2011, 172, 132–135 CrossRef CAS.
- D. R. Katti, K. S. Katti, M. Raviprasad and C. Gu, J. Nanomater., 2012, 2012, 15 CrossRef.
- H. Qing-Qing, W. Guang-Wei, L. Zhao-Tie and L. Zhong-Wen, in Nanocatalysis for Fuels and Chemicals, American Chemical Society, 2012, vol. 1092, ch. 11, pp. 167–193 Search PubMed.
- L. V. Amorim, C. M. Gomes, H. d. L. Lira, K. B. França and H. C. Ferreira, Mater. Res., 2004, 7, 583–593 CrossRef CAS.
- Y.-Q. Ji, L. Black, P. G. Weidler and M. Janek, Langmuir, 2004, 20, 9796–9806 CrossRef CAS PubMed.
- A. E. I. Elkhalifah, T. Murugesan and M. A. Bustam, National Postgraduate Conference (NPC), IEEE, 2011, 1–6 DOI:10.1109/NatPC.2011.6136275.
- J. Madejová, Vib. Spectrosc., 2003, 31, 1–10 CrossRef.
- K. Flogeac, E. Guillon and M. Aplincourt, J. Colloid Interface Sci., 2005, 286, 596–601 CrossRef CAS PubMed.
- R. S. Muralidhara, C. R. Kesavulu, J. L. Rao, R. V. Anavekar and R. P. S. Chakradhar, J. Phys. Chem. Solids, 2010, 71, 1651–1655 CrossRef CAS.
- J. Manjanna, T. Kozaki, N. Kozai and S. Sato, J. Nucl. Sci. Technol., 2007, 44, 929–932 CrossRef.
- Z. Huang, P. Wu, H. Li, W. Li, Y. Zhu and N. Zhu, RSC Adv., 2014, 4, 6500–6507 RSC.
- B. Dellinger, S. Lomnicki, L. Khachatryan, Z. Maskos, R. W. Hall, J. Adounkpe, C. McFerrin and H. Truong, Proc. Combust. Inst., 2007, 31, 521–528 CrossRef PubMed.
- W. Gehling and B. Dellinger, Environ. Sci. Technol., 2013, 47, 8172–8178 CAS.
- T. E. Westre, P. Kennepohl, J. G. DeWitt, B. Hedman, K. O. Hodgson and E. I. Solomon, J. Am. Chem. Soc., 1997, 119, 6297–6314 CrossRef CAS.
- P.-E. Petit, F. Farges, M. Wilke and V. A. Sole, J. Synchrotron Radiat., 2001, 8, 952–954 CrossRef CAS PubMed.
- L. Galoisy, G. Calas and M. A. Arrio, Chem. Geol., 2001, 174, 307–319 CrossRef CAS.
- E. D. Ingall, J. M. Diaz, A. F. Longo, M. Oakes, L. Finney, S. Vogt, B. Lai, P. L. Yager, B. S. Twining and J. A. Brandes, Nat. Commun., 2013, 4, 1981 Search PubMed.
- G. S. Pokrovski, J. Schott, F. Farges and J.-L. Hazemann, Geochim. Cosmochim. Acta, 2003, 67, 3559–3573 CrossRef CAS.
- A. L. N. d. Cruz, R. L. Cook, S. M. Lomnicki and B. Dellinger, Environ. Sci. Technol., 2012, 46, 5971–5978 CrossRef CAS PubMed.
- T. Okada, Y. Watanabea and M. Ogawa, Chem. Commun., 2004, 320–321, 10.1039/b312962d.
| This journal is © The Royal Society of Chemistry 2016 |

