 Open Access Article
Design of anaerobic membrane bioreactors for the valorization of dilute organic carbon waste streams†
Brian D.
Shoener
a,
Cheng
Zhong
a,
Anthony D.
Greiner
b,
Wendell
O. Khunjar
b,
Pei-Ying
Hong
c and
Jeremy S.
Guest
*a
aUniversity of Illinois at Urbana-Champaign, Department of Civil & Environmental Engineering, 205 N. Mathews Avenue, Urbana, Illinois 61801, USA. E-mail: jsguest@illinois.edu; Tel: +1 217 244 9247
bHazen and Sawyer, 4035 Ridge Top Road, Suite 400, Fairfax VA 22030, USA
cKing Abdullah University of Science and Technology (KAUST), Water Desalination and Reuse Center (WDRC), Biological and Environmental Sciences & Engineering Division (BESE), Thuwal 23955-6900, Saudi Arabia
First published on 18th January 2016
Abstract
Aqueous waste organics are an abundant resource generated continuously by industry and human metabolism. Despite its high energy content, organic carbon is typically degraded to CO2 through energy-intensive processes due to its heterogeneity, its low concentration, and stringent requirements for effluent quality. However, valorizing waste organics alongside recovered water is critical for the viability of utilities, industry, and next generation biorefineries. To that end, we employ a quantitative sustainable design (QSD) methodology to set a research agenda for the development of anaerobic membrane bioreactors (AnMBRs) for the conversion of dilute, aqueous organic carbon into methane-rich biogas, with the simultaneous recovery of quality water. 150 unique AnMBR configurations were assembled as the landscape of possible development pathways. Each configuration was evaluated by integrating full-scale design and operation with techno-economic analysis (TEA) and life cycle assessment (LCA) in a Monte Carlo framework. Costs and environmental impacts were most sensitive to membrane configuration, membrane type, and inclusion of granular activated carbon (GAC) as physical media for membrane scouring. The least expensive designs (20th percentile) were exclusively AnMBRs with cross-flow, multi-tube membranes. Research targets were set through sensitivity analyses, prioritizing a decrease in cross-flow velocity (<0.5 m s−1), elimination of gas sparging, increase in membrane life (>10 years), decrease in upflow velocity for physical media bed expansion (<7.5 m h−1), and the development of low-cost physical media for fouling mitigation. Lastly, a subset of AnMBR designs had costs below state-of-the-art treatment (high rate activated sludge with anaerobic digestion), demonstrating the valorization of waste organics would be financially advantageous to industry and utilities.
Broader contextAqueous waste organics are an underutilized energy resource due to their heterogeneous and dilute nature, but their valorization is essential to the financial viability and environmental sustainability of utilities and the biofuels industry. Here we demonstrate an emerging technology, the anaerobic membrane bioreactor (AnMBR), has the potential to reduce costs and key environmental impacts as compared to conventional aerobic technology. Through a quantitative sustainable design framework, we prioritize research objectives and set technology targets that will enable the financially viable production of methane and high quality water from dilute waste streams. Analyses of this nature are imperative to set agendas for research and technology development that have the greatest potential to valorize waste streams, and to align environmental and economic performance of technologies along more sustainable trajectories. |
1 Introduction
Aqueous waste organics represent a ubiquitous, renewable resource for bioenergy production. To date, aerobic degradation of organics to carbon dioxide (CO2) has been the primary approach to wastewater management, despite incurred energy costs of 1000–2000 kW h kg carbon−1.1–5 As a result, wastewater treatment plants (WWTPs, a.k.a. water resource recovery facilities, WRRFs) consume an estimated 3% of the US electricity demand, or 15 GW in the U.S. alone.2,6 Additionally, as next generation biorefineries come online, wastewater treatment will be responsible for roughly 20% of capital costs and parasitic losses on the order of 11–26% of a refinery's operational electricity consumption.7–9 As utilities and governments invest hundreds of billions of dollars in wastewater infrastructure over the coming decades,10 the valorization of industrial- and municipal-derived aqueous waste organics can play a key role in aligning economic and environmental performance along sustainable trajectories.6,11–13Mainline anaerobic wastewater treatment has been shown to have several benefits over traditional aerobic processes, including the potential to eliminate aeration (often half of a WWTP's electricity consumption14), reduce sludge wasting, and convert organic carbon to usable fuel (e.g., methane, hydrogen, electricity).6,15–18 Mainline anaerobic treatment has been slow to take hold in technologically advanced communities due to several critical challenges, including large land requirements, unreliable performance at low temperatures, the potential to produce odors, and poor effluent quality.18 Methane-producing technologies – which demonstrate the highest levels of energy production (as kJ g carbon removed−1)17 – also suffer from high concentrations of soluble methane in reactor effluent.18 However, technological advances continue to improve soluble methane recovery,19 and long-term performance of psychrophilic (<20 °C) anaerobic technology has been demonstrated.20,21 A persistent barrier to anaerobic technologies, however, has been their failure to achieve adequate organic carbon removal to reliably meet discharge requirements.17 With the introduction of membranes to mainline anaerobic treatment, anaerobic membrane bioreactors (AnMBRs) overcome this critical barrier and have been demonstrated to consistently produce high quality effluent in conjunction with high levels of methane-rich biogas production.17,22–26 With significant potential to align goals for bioenergy production and wastewater treatment, the research, development, and deployment (RD&D) of AnMBR is actively pursued. A key challenge in AnMBR RD&D, however, is the many disparate, competing designs and a lack of understanding of their relative sustainability and the factors governing environmental and economic performance.
The fundamental characteristic of AnMBR is the integration of an anaerobic unit process [e.g., completely stirred tank reactor (CSTR) or anaerobic filter (AF)] with membrane filtration.27 The inclusion of membranes in the biological process allows hydraulic retention time (HRT) to be reliably decoupled from solids residence time (SRT); this often results in much smaller plant footprints (compared to conventional anaerobic treatment) and can lower capital costs.28 However, the inclusion of membranes may result in trade-offs such as increased energy demand due to permeate pumping and, more significantly, membrane fouling control (e.g., gas sparging).29,30 Ultimately, AnMBR is still an emerging technology, and many novel designs are being evaluated in parallel.24,25,31–41 With a broad range of possible configurations (including reactor structure, fouling mitigation strategy, membrane type, etc.), it is expected that a subset of these alternatives are bound to be inherently better than others in terms of economic viability and environmental impacts of full-scale installations. To date, however, configurations have only been analyzed one-at-a-time,30,42–44 limiting the field's understanding of which RD&D pathways have the greatest potential to align trajectories toward environmental and economic sustainability.
The objective of this work was to evaluate the environmental and economic implications of the broad landscape of AnMBR designs to prioritize RD&D needs. To this end, discrete design decisions were identified and assembled to generate 150 unique AnMBR designs, including various combinations of reactor design, membrane design, and methane management (Fig. 1, Table ESI-1†). Given that the focus of this study was on the identification of technology development pathways rather than the existing performance of individual configurations, it was assumed that each configuration could (at present or with incremental improvements over time) eventually achieve adequate effluent quality to meet permit requirements for biochemical oxygen demand (BOD) and suspended solids (e.g., 30 mg L−1 and 30 mg L−1, respectively). This assumption is supported by a range of AnMBR designs that have been demonstrated to achieve ≥90% COD removal (Table ESI-6†). Full-scale designs for all configurations were developed and assessed using a quantitative sustainable design (QSD) methodology11 integrating life cycle assessment (LCA) and techno-economic analysis (TEA) in a Monte Carlo framework in MATLAB. Sensitivity analysis was also conducted to determine which input parameters have the greatest influence on environmental and economic metrics. Finally, the relative importance of individual design decisions to economic and environmental sustainability were quantified and targets for research and development were prioritized.
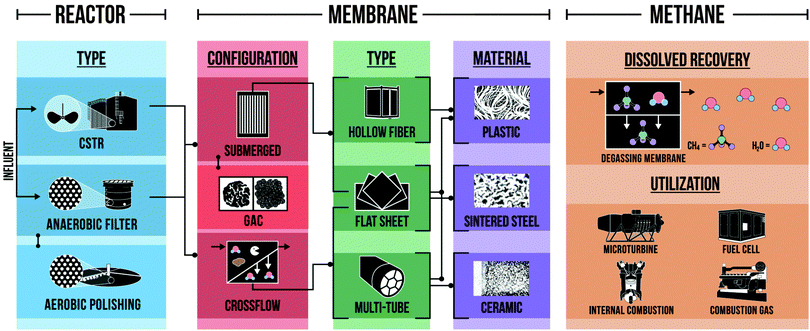 | ||
| Fig. 1 Discrete design decisions evaluated as potential development pathways for AnMBR. Initial choices limited downstream alternatives, as indicated by black lines and brackets. Dissolved methane recovery and utilization options were available to all designs. This approach resulted in a total of 150 discrete AnMBR designs that were evaluated as potential development pathways. A full list of evaluated designs can be found in Table ESI-1.† | ||
2 Results and discussion
2.1 Impact of design decisions
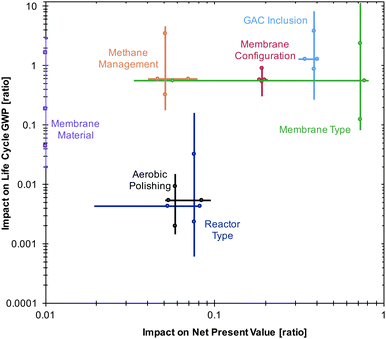
Membrane type [hollow fiber (HF), flat sheet (FS), multi-tube (MT)], membrane configuration (submerged, cross-flow), and GAC inclusion had the greatest relative median impacts on both cost (Fig. 2; 0.72, 0.19, and 0.39) and GWP (0.56, 0.58, and 1.28). Consistent trends were observed for reactor type, with AFs being less expensive than CSTRs (on average 6.2%), and for membrane types used in cross-flow configuration, with MT membranes consistently having the lowest GWP (median value 81% lower). Other choices, however, were more nuanced. For example, including GAC always reduced GWP (by 58% on average) and, when used in conjuction with HF membrane modules, lowered the total cost by 25%. When GAC was used in conjunction with FS modules, however, the additional membrane tank volume (FS required more tankage per m2 of membrane surface area) increased the cost by roughly 40%. Although GAC eliminates the need for gas sparging, the material itself is expensive (Table ESI-2†). When a large amount of GAC is needed – as in the case of FS AnMBRs (which require a larger membrane tank than HF units handling the same flow) – the cost of GAC may outweigh any environmental benefits. This finding highlights the need for the development of membrane modules specifically designed to leverage physical media (e.g., GAC) for fouling mitigation, while also reducing membrane tank volume.Methane management (i.e., deciding whether or not to include a degassing membrane, DM) was also high in its impact on GWP because for any given design, if a DM was not included, anywhere between 30–50% of the produced methane was lost in the effluent26,35 and was assumed to result in fugitive emissions to the atmosphere as a potent greenhouse gas (GHG). The degassing membrane is an early-stage technology with anticipated improvements in efficiency,45 but a range of soluble methane management technologies may have potential for dramatic reductions in GHG reductions if energy positive operation or the beneficial use of soluble methane is achievable.
2.2 Impacts of individual designs
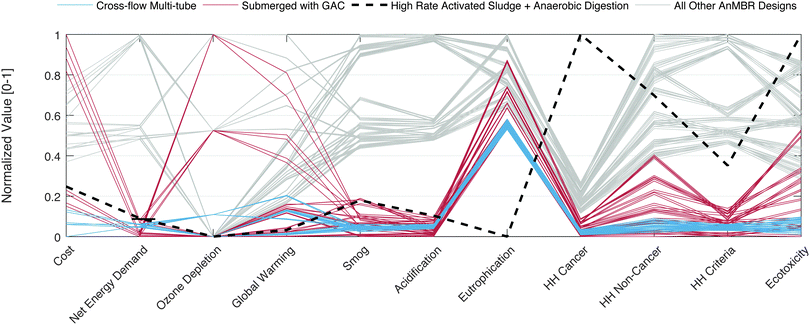
After examining the relative TEA and LCA impacts of the six discrete decisions under uncertainty, the cumulative impacts of each of the individual 150 AnMBR designs were compared to each other and to the performance of a state-of-the-art activated sludge system for organic carbon removal consisting of high rate activated sludge (HRAS; the first step in the AB process) coupled with anaerobic digestion (AD; see detailed explanation in ESI†). No single design universally minimized cost and environmental impacts across all categories. In order to comparatively examine the full landscape of designs, the median values of the net present value, net energy, and life cycle environmental impacts for each design were normalized between 0 and 1 according to eqn (1): | (1) |
In general, designs in the 90th percentile of costs had similar environmental impacts to those that were in the 10th percentile, indicating that certain design decisions decouple costs from energy consumption and environmental impacts. Specifically, the most expensive designs were principally submerged FS AnMBRs with GAC, with high costs stemming from larger membrane tanks (and thus, more GAC) as compared to HF systems (Fig. 4). The elimination of gas sparging through the use of an AFMBR (i.e., the use of physical media for fouling mitigation) had dramatic benefits across environmental impact categories due to reduced electricity consumption, which led to strong environmental performance for all configurations leveraging GAC. In particular, AFMBR systems demonstrated the greatest level of energy positive performance, with an estimated net energy consumption of −0.09 to −0.06 kW h m−3; significantly better than conventional activated sludge WWTPs which consume roughly 0.3 to 0.6 kW h m−3 for similar levels of COD removal.1,3 The HRAS + AD system was 13–34% more expensive than the top performing configurations (i.e. cross-flow with MT) – primarily due to aeration and sludge wastage requirements – but also operated near energy neutrality and had the lowest eutrophication impact. Eutrophication of all designs was driven by direct aquatic emissions (i.e., the effluent), and superior HRAS + AD performance stemmed from increased biomass yield and the assimilation of N and P into new biomass, thereby removing more nutrients from the wastewater during treatment. The relative difference between HRAS + AD and AnMBR eutrophication would be dramatically reduced for waste streams with more dilute nutrients or with N and P recovery downstream of AnMBR (discussed in more detail below). Designs above the 90th percentile for most environmental impacts (excluding ozone depletion and GWP) were cross-flow FS units because of the increased mass of membrane material needed and the added energy consumption from higher pumping rates to achieve adequate cross-flow velocity. The worst performing designs (above the 90th percentile) for ozone depletion and global warming were those that used membranes made of PTFE, which has a disproportionately high environmental footprint (normalized impact per kg of membrane material) as compared to other membrane materials that do not require fluorination.
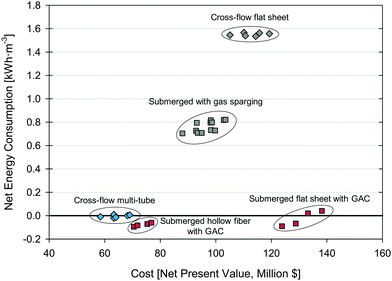 | ||
| Fig. 4 Comparison of cost [net present value, $million] to net energy consumption [kW h m−3] for all 150 configurations. Diamonds and squares represent cross-flow and submerged configurations, respectively. See Fig. 3 for an explanation of the color scheme. Configurations below the bolded line are energy positive. | ||
Designs in the 20th percentile for cost had a cross-flow, MT membrane (blue lines in Fig. 3), which also achieved near energy neutral performance (−0.02 to 0.01 kW h m−3; Fig. 4). Although the AFMBR technology did achieve more energy positive performance, the cost of GAC put AFMBR at ∼10–31% higher life cycle cost than cross-flow systems with MT membranes. Focusing on the 10% of designs with the lowest cost (which varied by $5 million in NPV) resulted in far less variability in LCA impacts than the full spectrum of designs, but even within these designs the median GWP impacts varied from 0.10 to 0.85 kg CO2 eq. m−3 treated. Thus, although cost minimization would steer design away from the worst (from a life cycle environmental perspective) designs, differences in environmental impacts may still be significant (varying up to an order of magnitude in the Monte Carlo simulations).
2.3 Sensitivity to scenario, process, and technology assumptions
The sensitivity of total net present value and GWP (both on a per m3 treated basis) to each of the 22 input variables (Table 2) were determined using Spearman's rank correlation coefficients (Fig. 5), as described in the Methods section. Cost was most sensitive to interest, flux, and membrane lifetime, with median correlation coefficients of −0.50 (i.e., a moderate negative correlation), −0.38, and −0.29, respectively. These values were significantly different from a “dummy” variable that had no effect on the model outputs (p-values < 0.001, Wilcoxon rank sum test). Membrane cost had a moderate positive correlation (0.16). Certain input parameters only impacted specific designs (e.g., cross-flow velocity for designs with a cross-flow configuration); correlations for these parameters were only calculated for the relevant designs.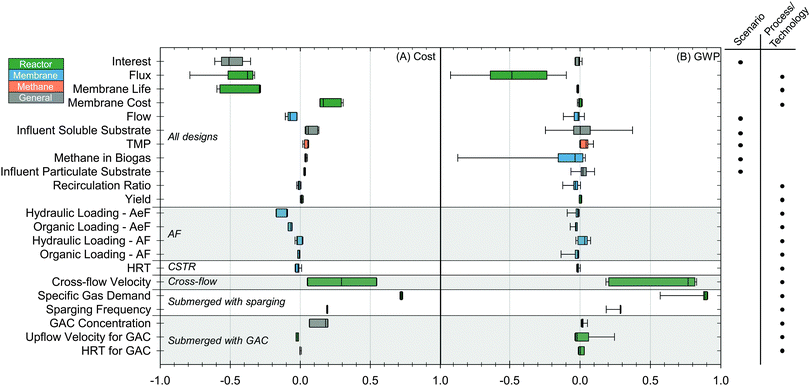 | ||
| Fig. 5 Sensitivity of (A) cost as NPV and (B) GWP to 22 input parameters. Values were determined using the results from Spearman's rank correlation calculations for all 150 configurations. Negative values indicate an inverse correlation between the input parameter and the output value. Tails are the 10th and 90th percentiles. The color of the boxes correspond to the colors in Fig. 1, where colors relate to the component of the AnMBR that is directly impacted. Inputs were also categorized based on whether they impact all scenarios or are specific to the technology/process. | ||
GWP was most sensitive to flux, which was shown to have a moderate negative correlation (−0.48) stemming from the impact on membrane tank volume and membrane materials (increasing flux would decrease these sources of environmental impacts). This was statistically different from the “dummy” variable (p < 0.001). The influent soluble substrate concentration had an elevated 90th percentile (0.37). AF AnMBRs with a cross-flow MT membrane or AFs with a submerged membrane had higher sensitivity to this parameter. The percent of methane partitioned to the biogas (i.e., the percent that is not dissolved in the effluent) had a high 90th percentile (−0.87) because of methane's potency as a GHG. Sensitivity to specific gas demand (SGD) was high (0.89), because increased SGD led to increased electricity consumption and, ultimately, higher GWP.
2.4 Research, development & deployment prioritization
Arguably the greatest strength of AnMBR is its ability to reliably, and under a range of temperatures and loading conditions,38,46 achieve high levels of carbon removal (90–99%)17,26 from wastewater. As further research is conducted on this emerging technology, treatment efficacy is expected to improve in conjunction with decreasing costs.44 In order to expedite this process, the work presented here examined 150 possible AnMBR designs in order to prioritize research and development needs; a summary of these priorities can be found in Table 1.AnMBRs may continue to be developed as both CSTRs and AFs, with submerged and cross-flow configurations. A critical challenge for cross-flow systems is the need to improve pumping efficiency relative to membrane scouring.47 MT designs outperform existing FS designs in this respect, and membrane geometries targeting >0.02 m s−1 cross-flow velocity per m3 h−1 feed flow should be prioritized to reduce pumping. Even with increased efficiency in membrane geometry, a fundamental tension may still exist between fouling mitigation (which is improved through higher shear) and the stability and performance of anaerobic bioprocesses (which may be negatively impacted by higher shear). High shear has been shown to disturb syntrophic interactions among anaerobic microorganisms (likely caused by a buildup of fermentation products),48 indicating that the implications of shear on hydrolysis, microbial community structure, and overall reactor performance need to be examined further. As a result, cross-flow velocities below 0.5 m s−1 should be targeted and fouling mitigation studies should also track bioprocess performance (CH4 production, carbon removal, volatile fatty acid build-up, etc.) under continuous, long-term operation.
A critical challenge for submerged systems also stems from fouling mitigation, with this analysis demonstrating the clear need to eliminate gas sparging and replace it with less energy-intensive processes. Possible development pathways include the use of physical media for scouring of the membrane surface34,35,49 or membrane vibration.18,50,51 Including GAC in an AnMBR has many benefits (e.g., decreased membrane fouling,35,52,53 higher fluxes,52 and removal of trace contaminants),35 but its use needs to be further evaluated through long-term experimental studies to better quantify trade-offs between an increased flux and a potential decrease in membrane life (increasing maintenance costs). To the degree possible, research efforts should focus on physical medium selection and membrane geometry to achieve membrane cleaning without damage, and simultaneously target cheaper, smaller, and lower density particles49 to reduce upflow velocity requirements for bed expansion (e.g., reduce upflow velocity to <7.5 m h−1 while keeping HRT below 1.6 h). Research on membrane materials can further support this goal by continuing to target better resistance to fouling while simultaneously increasing useful life.26,49 Increasing membrane material efficiency (i.e., the ratio of membrane surface area to material volume) to over 2000 m2 m−3 will also contribute to lower cost, more efficient systems with reduced environmental impacts. Finally, although researchers have achieved long-term AFMBR operation (485 days, 0.8 m3 reactor volume) without chemical cleaning, cleaning may ultimately benefit system performance and a method should be developed that does not harm organisms attached to the fluidized GAC.53
The release of dissolved methane to the atmosphere via reactor effluent is a persistent problem for AnMBRs that has significant impacts on energy recovery and life cycle GWP.1,54,55 Existing approaches include the use of sweep gas18,19 or vacuum extraction with a degassing membrane;45 the latter was examined in this study as well as in Pretel et al.30 If DMs are ultimately able to recover the same amount of energy (as methane) than that which is required to operate the system (as electricity), these systems would reduce the life cycle GWP of a plant by more than half but at a 5% increase in NPV. These environmental benefits may also be achieved through alternative uses of soluble methane, including the production of chemicals (e.g., methanol)56–60 or the facilitation of denitrification.61 Ultimately, the criticality of soluble methane management and the breadth of potential solutions underscores the need to develop integrated solutions for WWTPs interested in AnMBR. Beyond methane, nutrient management is a critical challenge for many utilities, creating opportunities for downstream nitrogen removal26,62 or the development of more comprehensive resource recovery strategies through the integration of phototrophic bioprocesses (e.g., microalgae cultivation for energy positive nutrient recovery).17
3 Conclusions
This novel analysis of AnMBR examined 150 potential development pathways, and identifies a range of research and development needs for this emerging technology. In addition to those specific needs identified above (and in Table 1), research efforts should continue to focus on core elements of AnMBR that reduce costs without sacrificing treatment efficacy (e.g., increasing membrane flux,54 decreasing HRT26), maintaining the goal of achieving adequate effluent quality at costs below conventional aerobic systems. There were no designs that had both the lowest costs and lowest environmental impacts, though designs below the 10th percentile for costs did have comparatively low environmental impacts. Most design decisions resulted in trade-offs, the navigation of which is necessary if AnMBRs are to become broadly applied at full-scale WWTPs.30,44 Relative to the state-of-the-art WWTPs relying on mainline aerobic treatment processes (HRAS + AD or the first stage of the AB process coupled with AD), two subsets of configurations – (i) cross-flow with multi-tube and (ii) submerged hollow fiber with GAC – were less expensive and able to achieve energy neutral or positive treatment. If future research targets the design, operational, and material improvements discussed here, net energy positive treatment and life cycle environmental benefits (e.g., net GHG removal from the atmosphere through energy offsets) can be achieved. In the U.S., hundreds of billions of dollars will be spent over the next few decades to meet more stringent discharge requirements and update aging infrastructure.10 In parallel, existing and emerging biomass-based industries – including the biological production of fuels and chemicals – will generate dilute organic carbon waste streams that must be managed. Utilizing AnMBRs instead of energy-intensive aerobic processes will not only reduce costs and environmental impacts, but will ultimately align goals for local and global environmental sustainability with financial viability in the management of aqueous carbon resources.4 Methods
4.1 Design roadmap
To evaluate the broad range of AnMBR designs that could be pursued in the coming years, the following discrete decisions were considered (Fig. 1): reactor type, membrane configuration, membrane type, membrane material, soluble methane management, and methane processing method. The landscape of possible combinations of these decisions (e.g., a submerged membrane unit could only have a hollow fiber or flat sheet membrane module, not a multi-tube module) was assembled based on the literature and industry experience. Ultimately, the overall costs and environmental impacts of 150 different AnMBR designs were compared (Table ESI-1†). Details of individual decisions are described below.| Parameter | Units | Distribution | Valuesa | Citation |
|---|---|---|---|---|
| a Probability density functions were characterized by: minimum and maximum values (uniform); minimum, most probable, and maximum values (triangular); average and standard deviation (normal). b Value was assumed. c Transmembrane pressure. d Hydraulic retention time. e Granular activated carbon. | ||||
| Flux | L m−2 h−1 | Triangular | 5, 12, 17 | 36, 44 and 70 |
| TMPc | bar | Triangular | 0.04, 0.17, 0.37 | 32, 33, 38, 44 and 70 |
| Membrane life | years | Triangular | 5, 10, 15 | 44 |
| Membrane cost | $m−2 | Uniform | 64.5–107.6 | 71 |
| Organic loading (AF) | g COD L−1 d−1 | Uniform | 0.2–8 | 4 |
| Hydraulic loading (AF) | m h−1 | Uniform | 2–6 | 5 |
| Organic loading (AeF) | g COD L−1 d−1 | Uniform | 0.5–4 | 4 and 63 |
| Hydraulic loading (AeF) | m h−1 | Uniform | 0.11–0.44 | 72 |
| HRTd | h | Uniform | 8–12 | 36 and 44 |
| HRT for GACe | h | Uniform | 2.2–3.3 | 70 |
| Recirculation ratio | Multiple of forward flow | Uniform | 0.5–4 | 30 and 44 |
| Cross-flow velocity | m s−1 | Uniform | 0.4–2 | 28 |
| Specific gas demand | m3 m−2 h−1 | Uniform | 0.05–1.2 | 30 and 44 |
| Sparging frequency | % | Uniform | 50–100 | 38 |
| GAC concentration | g L−1 | Uniform | 187.8–225 | 35, 52 and 70 |
| Biomass yield | g biomass g COD−1 | Uniform | 0.02–0.08 | 16 and 44 |
| Percent gaseous methane | % | Uniform | 50–70 | 35 and 26 |
| Upflow velocity for GAC bed expansion | m h−1 | Triangular | 6, 8, 10 | 49 |
| Flow rate | ML | Normal | 75.7 (18.9) | |
| Influent soluble substrate | mg COD L−1 | Normal | 300 (30) | |
| Influent particulate substrate | mg COD L−1 | Normal | 100 (10) | |
| Interest | % | Uniform | 6–10 | |
The implications of including physical media (assumed to be granular activated carbon, GAC, based on recent work on this topic34,35,40) in submerged configurations – designated the anaerobic fluidized MBR (AFMBR)35 – was also examined. If GAC was included, it was placed only in the membrane tank and recirculation pumping was increased to achieve adequate upflow velocity for full bed expansion of the GAC; headloss due to bed expansion was assumed to be negligible.49 No GAC replacement was assumed (consistent with Kim et al.35) and no aerobic polishing (consistent with Smith et al.44) post-membrane filtration was included.
Three types of membrane material were included in the LCA: plastic, sintered steel, and ceramic. Within plastic, four types were considered: polyethersulfone (PES), polyvinylidenefluoride (PVDF), polyethylene terephthalate (PET), and polytetrafluoroethylene (PTFE).25,32,34,35,38,39,41 Plastic was assumed to be usable for any membrane type, but sintered steel and ceramic were limited to FS and MT membranes, respectively. While these materials incur different environmental impacts due to their respective production methods, differences in costs were assumed to be negligible.
For further foulant removal, chemical cleaning – both in-place (CIP) and out-of-place (COP) – may be required. Citric acid (100% by weight) and sodium hypochlorite (NaOCl, 12.5% by weight) were included in this study for inorganic and organic foulant removal, respectively. Annual consumptions were assumed to be 0.6 L year−1 m−3 d−1 and 2.2 L year−1 m−3 d−1 for citric acid and NaOCl, respectively, based on industry experience (Table ESI-2†). This assumption did not significantly impact the costs or life cycle environmental impacts of the system.
4.2 Techno-economic analysis (TEA)
Using the system boundary described above, costs for the construction, operation, and maintenance of unit processes were calculated using equations derived from CapdetWorks™ (v3.0; Hydromantis Environmental Software Solutions, Inc.) and Hazen and Sawyer (Section S2 of the ESI†). In order to compare the costs of different configurations, the net present value (NPV) was calculated assuming an interest rate that varied uniformly between 6–10%. Unit costs for equipment were acquired from CapdetWorks™ 2014 vendor data or were retrieved directly from the manufacturer. See Section 2 of the ESI† for a detailed explanation of cost calculations.4.3 Life cycle assessment
For operation, considered processes included citric acid and NaOCl consumption for membrane cleaning, electricity consumption and offsets, GAC, membrane replacement, and sludge landfilling. Direct emissions from the plant to air and water were also included in this study (i.e., COD, NH3, NH4+, organic nitrogen, total phosphorus, and PO43− to water; CH4 and CO2 to air). The electricity mix was set to the 2014 U.S. average,83 namely: 39% hard coal, 27% natural gas, 19% nuclear, 7% hydroelectric, 4.1% wind, 1.5% biomass, and 1% petroleum. For all materials and processes, LCI data were gathered using ecoinvent v3.084 and surrogates were used for items without available inventory data (Table ESI-3†).
4.4 Uncertainty and sensitivity analyses
Monte Carlo with Latin Hypercube Sampling (LHS; 3000 trials per AnMBR design) was used to propagate input uncertainty for 22 parameters (Table 2) to quantify costs and life cycle environmental impacts for each design. The analysis was repeated with 1000 trials per design to confirm results did not change and that 3000 trials was more than sufficient to generate reproducible results. Assigned values were based on the literature or were conservatively estimated if data were lacking. Uncertainty distributions were also assigned to each parameter based on data availability; uniform distributions (i.e., ±20% of the assigned value) were used unless evidence suggested otherwise (Fig. 6). The sensitivity of net present value and GWP (both normalized to a per m3 treated basis) to the input parameters across all configurations was determined by comparing Spearman's rank correlation coefficients.12,86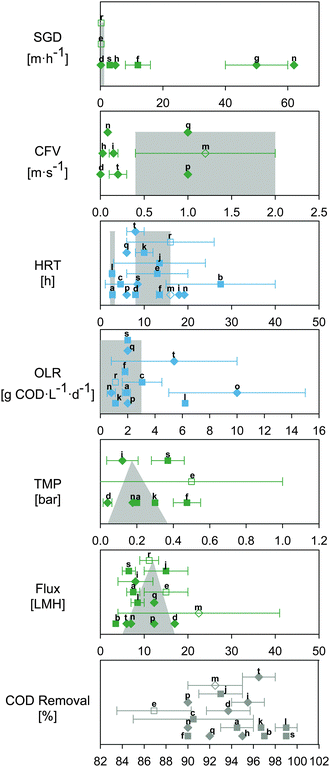 | ||
| Fig. 6 Experimental data for key operational parameters for AnMBRs. Data were separated by membrane configuration (i.e., submerged – square or cross-flow – diamond) and were labeled according to their citation (see Table ESI-6† for list of citations and values). If the configuration was listed as submerged, but a cross-flow velocity was given, the AnMBR was considered to have a cross-flow configuration. Data is presented as single points or a range of values, signified by error bars. Unfilled symbols represent pilot-scale AnMBRs (i.e., >500 L); these were given preference when determining uncertainty distributions for the model (gray shading). Colors correspond to how the input affected the model (see Fig. 5 for a description). HRT has two distributions: one for AnMBRs with GAC (2.2–3.3 hours) and one for AnMBRs without GAC (8–16 hours). | ||
In order to discern how individual design decisions affected the model outputs, the relative impact of each decision was used to characterize its economic and environmental importance. Variation for a given metric (focusing on NPV and GWP) resulting from the six design decisions examined in this analysis was quantified by taking the difference in median values (i.e., median of 3000 Monte Carlo trials) between two configurations that only varied by one decision (e.g., the reactor type and membrane material were the same, but one used a submerged membrane and the other used a cross-flow), and dividing by the minimum of those two median values.
Acknowledgements
This work was partially funded by the King Abdullah University of Science and Technology (KAUST) Academic Partnership Program (UIeRA 2012-06291). The authors would also like to acknowledge the Jack Kent Cooke Foundation and the Environmental Engineering and Science Program (UIUC) for partial funding for B. D. Shoener, and Roland Cusick for helpful discussions.References
- P. L. McCarty, J. Bae and J. Kim, Environ. Sci. Technol., 2011, 45, 7100–7106 CrossRef CAS PubMed.
- USEPA, Wastewater management fact sheet: Energy conservation, EPA 832-F-06-024, 2006 Search PubMed.
- USEPA, Clean energy opportunities in water & wastewater treatment facilities: Background and resources, 2009 Search PubMed.
- G. Tchobanoglous, H. D. Stensel, R. Tsuchihashi and F. L. Burton, Wastewater engineering: Treatment and resource recovery, McGraw-Hill Higher Education, New York, London, 5th edn, 2013 Search PubMed.
- C. Grady Jr, G. T. Daigger, N. G. Love and C. D. M. Filipe, Biological Wastewater Treatment, CRC Press, 3rd edn, 2012 Search PubMed.
- B. E. Logan and K. Rabaey, Science, 2012, 337, 686–690 CrossRef CAS PubMed.
- R. Davis, L. Tao, E. Tan, M. Biddy, G. Beckham, C. Scarlata, J. Jacobson, K. Cafferty, J. Ross, J. Lukas, D. Knorr and P. Schoen, Process design and economics for the conversion of lignocellulosic biomass to hydrocarbons: Dilute-acid and enzymatic deconstruction of biomass to sugars and biological conversion of sugars to hydrocarbons, DOE Technical Report NREL/TP-5100-60223, 2013.
- R. Davis, L. Tao, C. Scarlata, E. Tan, J. Ross, J. Lukas and D. Sexton, Process design and economics for the conversion of lignocellulosic biomass to hydrocarbons: Dilute-acid and enzymatic deconstruction of biomass to sugars and catalytic conversion of sugars to hydrocarbons, DOE Technical Report NREL/TP-5100-62498, 2015.
- D. Humbird, R. Davis, L. Tao, C. Kinchin, D. Hsu, A. Aden, P. Schoen, J. Lukas, B. Olthof, M. Worley, D. Sexton and Dudgeon, Process design and economics for biochemical conversion of lignocellulosic biomass to ethanol: Dilute-acid pretreatment and enzymatic hydrolysis of corn stover, DOE Technical Report NREL/TP-5100-47764, 2011.
- ASCE, 2013 Report Card for America's Infrastructure, 2013 Search PubMed.
- J. S. Guest, S. J. Skerlos, J. L. Barnard, M. B. Beck, G. T. Daigger, H. Hilger, S. J. Jackson, K. Karvazy, L. Kelly, L. Macpherson, J. R. Mihelcic, A. Pramanik, L. Raskin, M. C. M. Van Loosdrecht, D. Yeh and N. G. Love, Environ. Sci. Technol., 2009, 43, 6126–6130 CrossRef CAS PubMed.
- X. Wang, P. L. McCarty, J. Liu, N.-Q. Ren, D.-J. Lee, H.-Q. Yu, Y. Qian and J. Qu, Proc. Natl. Acad. Sci. U. S. A., 2015, 112, 1630–1635 CrossRef CAS PubMed.
- M. C. M. van Loosdrecht and D. Brdjanovic, Science, 2014, 344, 1452–1453 CrossRef CAS PubMed.
- WERF, Energy production and efficiency research – The roadmap to net-zero energy, Water Environment Research Foundation Technical Report ENER1fs, 2011.
- G. Tchobanoglous, F. L. Burton and H. D. Stensel, Wastewater engineering: Treatment and reuse, McGraw-Hill Professional, 2003 Search PubMed.
- B. E. Rittmann and P. L. McCarty, Environmental biotechnology: Principles and applications, McGraw-Hill, Boston, 2001 Search PubMed.
- B. D. Shoener, I. M. Bradley, R. D. Cusick and J. S. Guest, Environ. Sci.: Processes Impacts, 2014, 16, 1204–1222 CAS.
- D. J. Batstone and B. Virdis, Curr. Opin. Biotechnol., 2014, 27, 142–149 CrossRef CAS PubMed.
- J. Cookney, E. Cartmell, B. Jefferson and E. McAdam, Water Sci. Technol., 2012, 65, 604–610 CrossRef CAS PubMed.
- C. Y. Gomec, J. Environ. Sci. Health, Part A: Toxic/Hazard. Subst. Environ. Eng., 2010, 45, 1169–1184 CrossRef CAS PubMed.
- A. L. Smith, S. J. Skerlos and L. Raskin, Environ. Sci.: Water Res. Technol., 2015, 1, 56–64 CAS.
- M. Dagnew, W. Parker, P. Seto, K. Waldner, Y. Hong, R. Bayly and J. Cumin, Proceedings of the Water Environment Federation, 2011, 2011, 4931–4941 CrossRef.
- H. El-Mashad and R. Zhang, Bioresour. Technol., 2010, 101, 4021–4028 CrossRef CAS PubMed.
- J. B. Giménez, A. Robles, L. Carretero, F. Durán, M. V. Ruano, M. N. Gatti, J. Ribes, J. Ferrer and A. Seco, Bioresour. Technol., 2011, 102, 8799–8806 CrossRef PubMed.
- D. Martinez-Sosa, B. Helmreich, T. Netter, S. Paris, F. Bischof and H. Horn, Bioresour. Technol., 2011, 102, 10377–10385 CrossRef CAS PubMed.
- A. L. Smith, L. B. Stadler, N. G. Love, S. J. Skerlos and L. Raskin, Bioresour. Technol., 2012, 122, 149–159 CrossRef CAS PubMed.
- C. Ramos, A. García and V. Diez, Water Res., 2014, 67, 203–215 CrossRef CAS PubMed.
- B.-Q. Liao, J. T. Kraemer and D. M. Bagley, Crit. Rev. Environ. Sci. Technol., 2006, 36, 489–530 CrossRef CAS.
- A. Hospido, I. Sanchez, G. Rodriguez-Garcia, A. Iglesias, D. Buntner, R. Reif, M. T. Moreira and G. Feijoo, Desalination, 2012, 285, 263–270 CrossRef CAS.
- R. Pretel, B. D. Shoener, J. Ferrer and J. S. Guest, Water Res., 2015, 87, 531–541 CrossRef CAS PubMed.
- L.-B. Chu, F.-L. Yang and X.-W. Zhang, Process Biochem., 2005, 40, 1063–1070 CrossRef CAS.
- J. Ho, S. Khanal and S. Sung, Water Sci. Technol., 2007, 55, 79–86 CrossRef CAS PubMed.
- Z. Huang, S. L. Ong and H. Y. Ng, Water Res., 2011, 45, 705–713 CrossRef CAS PubMed.
- A. Hu and D. Stuckey, J. Environ. Eng., 2007, 133, 73–80 CrossRef CAS.
- J. Kim, K. Kim, H. Ye, E. Lee, C. Shin, P. L. McCarty and J. Bae, Environ. Sci. Technol., 2011, 45, 576–581 CrossRef CAS PubMed.
- H. Lin, J. Chen, F. Wang, L. Ding and H. Hong, Desalination, 2011, 280, 120–126 CrossRef CAS.
- A. Robles, M. V. Ruano, F. García-Usach and J. Ferrer, Bioresour. Technol., 2012, 114, 247–254 CrossRef CAS PubMed.
- A. L. Smith, S. J. Skerlos and L. Raskin, Water Res., 2013, 47, 1655–1665 CrossRef CAS PubMed.
- I. Vyrides and D. Stuckey, Water Res., 2009, 43, 933–942 CrossRef CAS PubMed.
- R. Yoo, J. Kim, P. L. McCarty and J. Bae, Bioresour. Technol., 2012, 120, 133–139 CrossRef CAS PubMed.
- M. Harb, Y. Xiong, J. Guest, G. Amy and P.-Y. Hong, Environ. Sci.: Water Res. Technol., 2015, 1, 800–813 Search PubMed.
- R. Pretel, A. Robles, M. V. Ruano, A. Seco and J. Ferrer, Bioresour. Technol., 2013, 149, 532–540 CrossRef CAS PubMed.
- R. Pretel, A. Robles, M. V. Ruano, A. Seco and J. Ferrer, Sep. Purif. Technol., 2014, 126, 30–38 CrossRef CAS.
- A. L. Smith, L. B. Stadler, L. Cao, N. G. Love, L. Raskin and S. J. Skerlos, Environ. Sci. Technol., 2014, 48, 5972–5981 CrossRef CAS PubMed.
- W. M. Bandara, H. Satoh, M. Sasakawa, Y. Nakahara, M. Takahashi and S. Okabe, Water Res., 2011, 45, 3533–3540 CrossRef CAS PubMed.
- C.-H. Wei, M. Harb, G. Amy, P.-Y. Hong and T. Leiknes, Bioresour. Technol., 2014, 166, 326–334 CrossRef CAS PubMed.
- I. Martin-Garcia, V. Monsalvo, M. Pidou, P. Le-Clech, S. J. Judd, E. J. McAdam and B. Jefferson, J. Membr. Sci., 2011, 382, 41–49 CrossRef CAS.
- S. I. Padmasiri, J. Zhang, M. Fitch, B. Norddahl, E. Morgenroth and L. Raskin, Water Res., 2007, 41, 134–144 CrossRef CAS PubMed.
- M. Aslam, P. L. McCarty, J. Bae and J. Kim, Sep. Purif. Technol., 2014, 132, 10–15 CrossRef CAS.
- J. Kim, J. Shin, H. Kim, J.-Y. Lee, M.-h. Yoon, S. Won, B.-C. Lee and K. G. Song, Bioresour. Technol., 2014, 172, 321–327 CrossRef CAS PubMed.
- A. Kola, Y. Ye, P. Le-Clech and V. Chen, J. Membr. Sci., 2014, 455, 320–329 CrossRef CAS.
- R. Lee, P. L. McCarty, J. Bae and J. Kim, J. Chem. Technol. Biotechnol., 2015, 90, 391–397 CrossRef CAS.
- C. Shin, P. L. McCarty, J. Kim and J. Bae, Bioresour. Technol., 2014, 159, 95–103 CrossRef CAS PubMed.
- J. Gouveia, F. Plaza, G. Garralon, F. Fdz-Polanco and M. Peña, Bioresour. Technol., 2015, 185, 225–233 CrossRef CAS PubMed.
- S. Pacheco-Ruiz, S. Heaven and C. J. Banks, Environ. Technol., 2015, 36, 2328–2339 CrossRef CAS PubMed.
- E. Taher and K. Chandran, Environ. Sci. Technol., 2013, 47, 3167–3173 CAS.
- R. J. Conrado and R. Gonzalez, Science, 2014, 343, 621–623 CrossRef CAS PubMed.
- Q. Fei, M. T. Guarnieri, L. Tao, L. M. L. Laurens, N. Dowe and P. T. Pienkos, Biotechnol. Adv., 2014, 32, 596–614 CrossRef CAS PubMed.
- C. A. Haynes and R. Gonzalez, Nat. Chem. Biol., 2014, 10, 331–339 CrossRef CAS PubMed.
- J. Sheehan, Nat. Biotechnol., 2009, 27, 1128–1129 CrossRef CAS PubMed.
- P. J. Strong, S. Xie and W. P. Clarke, Environ. Sci. Technol., 2015, 49, 4001–4018 CrossRef CAS PubMed.
- J. Delgado Vela, L. B. Stadler, K. J. Martin, L. Raskin, C. B. Bott and N. G. Love, Environ. Sci. Technol. Lett., 2015, 2, 234–244 CrossRef CAS.
- M. Hatamoto, H. Yamamoto, T. Kindaichi, N. Ozaki and A. Ohashi, Water Res., 2010, 44, 1409–1418 CrossRef CAS PubMed.
- GE Power and Water, ZeeWeed 500D Module, 2013.
- S.-H. Yoon, Membrane bioreactor processes: Principles and applications, CRC Press, 2015 Search PubMed.
- Pentair, X-Flow compact 33 ultrafiltration membrane, 2015.
- S. Judd and C. Judd, The MBR book, Butterworth-Heinemann, Oxford, 2nd edn, 2011 Search PubMed.
- IPCC, Climate change 2013: The physical science basis. Contribution of Working Group I to the fifth assessment report of the Intergovernmental Panel on Climate Change, Cambridge University Press, Cambridge, United Kingdom and New York, NY, USA, 2013 Search PubMed.
- USEPA, RDC, ERG and CHPP, Opportunities for combined heat and power at wastewater treatment facilities: Market analysis and lessons from the field, 2011.
- J. Bae, C. Shin, E. Lee, J. Kim and P. L. McCarty, Bioresour. Technol., 2014, 165, 75–80 CrossRef CAS PubMed.
- L. Rupp, City of Ashland Oregon: Wastewater treatment plant membrane replacement options, Keller Associates Technical Report 210055/2/10-406, 2010.
- A. Tawfik, R. A. Wahab, A. Al-Asmer and F. Matary, Bioprocess Biosyst. Eng., 2011, 34, 767–776 CrossRef CAS PubMed.
- L. Corominas, J. Foley, J. S. Guest, A. Hospido, H. F. Larsen, S. Morera and A. Shaw, Water Res., 2013, 47, 5480–5492 CrossRef CAS PubMed.
- ISO, ISO 14040: Environmental management – Life cycle assessment – Principles and framework, ISO Technical Report ISO 14040:2006(E), 2006.
- ISO, ISO 14044: Environmental management – Life cycle assessment – Requirements and guidelines, ISO Technical Report ISO 14044:2006(E), 2007.
- J. M. Foley, R. A. Rozendal, C. K. Hertle, P. A. Lant and K. Rabaey, Environ. Sci. Technol., 2010, 44, 3629–3637 CrossRef CAS PubMed.
- R. Nogueira, A. Brito, A. Machado, P. Janknecht, J. Salas, L. Vera and G. Martel, Desalin. Water Treat., 2009, 4, 16–21 CrossRef CAS.
- N. Tangsubkul, P. Beavis, S. J. Moore, S. Lundie and T. D. Waite, Water Resour. Manag., 2005, 19, 521–537 CrossRef.
- M. Yildirim and B. Topkaya, Clean: Soil, Air, Water, 2012, 40, 171–178 CrossRef CAS.
- S. Fahner, H. Bührer and C. Grabski, Thesis, IBB Ingenieurschule beider Basel, 1995.
- G. Doka, Life cycle inventory of wastewater treatment, Swiss Centre for Life Cycle Inventories Technical Report Ecoinvent Report No., 13, 2003.
- J. Foley, D. de Haas, K. Hartley and P. Lant, Water Res., 2010, 44, 1654–1666 CrossRef CAS PubMed.
- U.S. Energy Information Administration, What is U.S. electricity generation by energy source?, 2014.
- R. Frischknecht, N. Jungbluth, H.-J. Althaus, G. Doka, R. Dones, T. Heck, S. Hellweg, R. Hischier, T. Nemecek, G. Rebitzer and M. Spielmann, Int. J. Life Cycle Assess., 2005, 10, 3–9 CrossRef CAS.
- J. C. Bare, G. Norris, D. Pennington and T. McKone, J. Ind. Ecol., 2002, 6, 49–78 CrossRef.
- S. Marino, I. B. Hogue, C. J. Ray and D. E. Kirschner, J. Theor. Biol., 2008, 254, 178–196 CrossRef PubMed.
Footnote |
| † Electronic supplementary information (ESI) available. See DOI: 10.1039/c5ee03715h |
| This journal is © The Royal Society of Chemistry 2016 |

