 Open Access Article
Creative Commons Attribution 3.0 Unported Licence
Polymeric cobalt(II) thiolato complexes – syntheses, structures and properties of 1∞[Co(SMes)2] and 1∞[Co(SPh)2NH3]†
Andreas
Eichhöfer
*abc and
Gernot
Buth
d
aInstitut für Nanotechnologie, Karlsruher Institut für Technologie (KIT), Campus Nord, Hermann-von-Helmholtz-Platz 1, 76344 Eggenstein-Leopoldshafen, Germany. E-mail: andreas.eichhoefer@kit.edu; Fax: +49-(0)721-608-26368; Tel: +49-(0)721-608-26371
bLehn Institute of Functional Materials, Sun Yat-Sen University, Guangzhou 510275, China
cKarlsruhe Nano Micro Facility (KNMF), Hermann-von-Helmholtz-Platz 1, 76344 Eggenstein-Leopoldshafen, Germany
dInstitut für Photonenforschung und Synchrotronstrahlung, Karlsruher Institut für Technologie (KIT), Campus Nord, Hermann-von-Helmholtz-Platz 1, 76344 Eggenstein-Leopoldshafen, Germany
First published on 27th September 2016
Abstract
Reactions of [Co(N(SiMe3)2)2thf] with 2.1 equiv. of MesSH (Mes = C6H2-2,4,6-(CH3)3) yield dark brown crystals of the one dimensional chain compound 1∞[Co(SMes)2]. In contrast reactions of [Co(N(SiMe3)2)2thf] with 2.1 equiv. of PhSH result in the formation of a dark brown almost X-ray amorphous powder of ‘Co(SPh)2’. Addition of aliquots of CH3OH to the latter reaction resulted in the almost quantitative formation of crystalline ammonia thiolato complexes either [Co(SPh)2(NH3)2] or 1∞[Co(SPh)2NH3]. Single crystal XRD reveals that 1∞[Co(SPh)2NH3] forms one-dimensional chains in the crystal via μ2-SPh bridges whereas [Co(SPh)2(NH3)2] consists at a first glance of isolated distorted tetrahedral units. Magnetic measurements suggest strong antiferromagnetic coupling for the two chain compounds 1∞[Co(SMes)2] (J = −38.6 cm−1) and 1∞[Co(SPh)2NH3] (J = −27.1 cm−1). Interestingly, also the temperature dependence of the susceptibility of tetrahedral [Co(SPh)2(NH3)2] shows an antiferromagnetic transition at around 6 K. UV-Vis-NIR spectra display d–d bands in the NIR region between 500 and 2250 nm. Thermal gravimetric analysis of [Co(SPh)2(NH3)2] and 1∞[Co(SPh)2NH3] reveals two well separated cleavage processes for NH3 and SPh2 upon heating accompanied by the stepwise formation of ‘Co(SPh)2’ and cobalt sulfide.
Introduction
Metal chalcogenolato complexes have attracted interest due to their rich structural chemistry,1–3 and their potential use as precursors for M/E (E = S, Se, Te) materials.4,5 New developments in the latter respect came from the utilization of small clusters as building blocks for the formation of nanoparticles with controllable size and shape through photolytic decomposition and solvothermal synthesis.6–10 For some time metal chalcogenolato complexes have also been investigated due to their relevance as models for active sites of chalcogen-containing metalloproteins.11,12 In this respect, recently nickel and cobalt nitrite complexes supported by thiolates like [Ni(NO)(SPh)3]2−, [Ni2(NO)2(μ-SPh)2(SPh)2]2−, [Co(NO)2(SPh)2]2− and [Co3(NO)6(μ-SPh)3] have been introduced as model complexes for physiological and pathophysiological processes in which nitric oxide plays an important role.13 In addition compounds with the general composition ‘MSPh2’ (M = Ni2+ and Pd2+) were for example found to display catalytic properties.14 In a different research direction anionic [Co(SPh)4]4− which is known for over 30 years has recently been shown to display interesting single ion magnetic behavior.15–17The build-up of the structures of homoleptic and neutral complexes of the general type [M(SR)n] (n = 1–3; M = transition metal; R = org. group) comprising the monodentate thiolato group SR− is mostly determined by the interplay of the steric demand of the organic ligands versus the tendency of the low coordinated metal ions to realize higher coordination modes. The recently published series of quasi-two-coordinate transition metal dithiolates [M(SR)2] (M = Cr, Mn, Fe, Co, Ni, Zn)18,19 with the very bulky organic ligand R = C6H3-2,6(C6H2-2,4,6-iPr3)2 represents the lowest limit with respect to the coordination number in homoleptic neutral chalcogenolato complexes of these elements. Decrease of the steric demand of the organic ligands should result in the formation of either oligomeric (e.g. ring-like) or polymeric structures. Examples for transition metals include the oligomeric ring structures of [{Ni(μ-SPh)2}n] (n = 9, 11),20 [{Ni(μ-SiPr)(μ-mtet)}6], [{Ni(μ-StBu)(μ-mtet)}10] (mtet = 2-methylthioethanethiolate)21 and [{Fe(SePh)2}12],22 the 1D chain structures of 1∞[M(SeR)2] (M = Mn, Fe; R = Ph, Mes; Mes = C6H2-2,4,6-(CH3)3)23–25 and the 3D adamantoid network structure of 3∞[Zn4(SPh)8CH3OH],263∞[Cd4(SR)8] (R = Ph, 4-CH3-C6H4)27 and 3∞[Cd4(SePh)8].28 In this respect dimeric [{Co(SR)2}2] (R = 2,4,6-tBu3C6H2) and hexameric [{Co(SEt)2}6] (Et = C2H5) are the only polynuclear examples for cobalt which have been characterized by single crystal X-ray diffraction.29
In contrast a few more homoleptic thiolato complexes of cobalt which are ionic have been structurally characterized including the above mentioned [Co(SPh)4]4−,30 the dinuclear anions [Co2(SEt)6]2− (ref. 31) and [Co2(SiPr)5]− (ref. 32) and the cluster anion [Co4(SPh)10]2−.33 The latter ones can be viewed as structural building blocks of oligomeric and polymeric structures mentioned above.
Amine ligated cobalt complexes with monodentate thiolato ligands SR− are rare and include for example [Co(S-2,4,6-iPr3C6H2)2(Py)2],34 [Co(S-2,6-i-Pr2C6H3)2(bpy)(CH3CN)], [{Co(S-2,3,5,6-Me,C6H)2(bpy)}2], [Co(S-2,6-iPr2C6H3)2(2,9-Me2phen)],35 [Co(SPh)2(p-Tol-NPMe3)2],36 [Co(SAr)2(tmeda)],37 (Ar = 2,4,6-tBu3C6H2, tmeda = tetramethylethylenediamine) and [Co(SPh)2(phen)]ClO4 (phen = phenanthroline).38 Only four examples of cobalt thiolato complexes with ammonia ligands have been characterized so far namely [{Co(SSi(OtBu)3)2(NH3)}2],39 [Co(SSi(OAr)3)2(NH3)2] (Ar = tBu,40 2,6-iPr2C6H3)41 and the cationic Co(III) complex [Co(SSi(OtBu)3)2(NH3)4]+.39
Herein we report on the synthesis and structural characterization of the first polynuclear thiolato complexes of Co(II) including characterization by UV-vis-NIR spectroscopy, magnetic measurements and thermal gravimetric analysis.
Results and discussion
Syntheses and structures
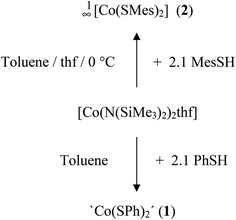
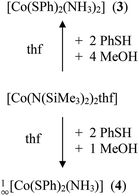
The cobalt(II) thiolato complexes of formal composition ‘Co(SR)2’ (R = Ph (1), R = Mes (2)) can be prepared by reaction of [Co(N(SiMe3)2)2thf] with 2.1 equivalents of RSH (Scheme 1). The mesityl complex 2 could be obtained from the reaction mixtures as a dark brown crystalline product 1∞[Co(SMes)2] whereas the dark powder of the phenyl-chalcogenolato complex 1a was found to be almost completely X-ray amorphous (Fig. S1, ESI†). The powder pattern of 1 changes if the reaction product is post annealed in solution at 105 °C for approximately 4 h to give 1b. Attempts to suggest a reasonable structural model for 1b based on the powder XRD pattern have so far not been successful.Upon addition of stoichiometric amounts of methanol to the reaction mixtures of [Co{N(Si(Me)3)2}2(thf)] and PhSH in thf one can isolate the two ammonia complexes [Co(SPh)2(NH3)2] (3) and 1∞[Co(SPh)2(NH3)] (4) (Scheme 2).
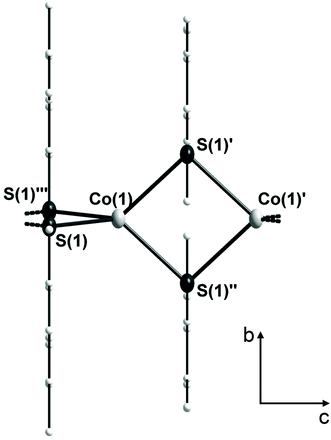
2 crystallizes in the tetragonal space group I4m (Table 1). In the crystal structure the cobalt atoms are μ2-bridged in one dimension by the two mesitylthiolato ligands to form infinite chains (Fig. 1). Thus 2 resembles the first structurally characterized polymeric cobalt thiolate complex. Four sulfur atoms (S(1), S(1′), S(1′′) and S(1′′′)) of the mesitylthiolato ligands build a distorted tetrahedral coordination environment around the cobalt atom with two smaller and four larger S–Co–S bond angles of about 86.50(3)° and 122.04(2)° respectively. The Co2S2 rings are planar and close to square shape with a S–Co–S angle of 86.50(3)° and a Co–S–Co angle of (93.50(3)°). Co–S distances amount to 233.89(6) pm and the non-bonding Co⋯Co distance was found to be 341.6(2) pm. If viewed along the chain (c axis) the mesityl groups are oriented in a staggered configuration so as to minimize steric interactions. The structure of 2 is strongly reminiscent of that of the selenolato complexes [M(SeC6H2-2,4,6-CH3)2] (M = Mn,23 Fe25). Although the build-up of the 1D chains is almost similar in all three complexes, 2 crystallizes in a different space group with a cell volume which is by 200 Å3 larger for 2 than in the mesityl selenolato complexes mentioned above comprising channels which are filled with solvent molecules (1 eq. due to elemental analysis; solvent potential area of 374 Å3).
| 2 | 3 | 4 | |
|---|---|---|---|
| a R 1 = ∑||Fo| − |Fc||/∑|Fo|. b wR2 = {∑[w(Fo2− Fc2)2]/∑[w(Fo2)2]}1/2. c Dataset was corrected for disordered solvent molecules by SQUEEZE. d Data refined as a crystal of two components (twin) with HKLF 5 which sets MERG 0. | |||
| Sum formula | C18H22CoS2 | C12H16CoN2S2 | C12H13CoNS2 |
| fw [g mol−1] | 361.4 | 311.32 | 294.28 |
| Crystal system | Tetragonal | Triclinic | Monoclinic |
| Space group | I4m |
P![[1 with combining macron]](https://www.rsc.org/images/entities/char_0031_0304.gif) |
Cc |
| Cell | |||
| a [Å] | 16.7784(8) | 6.8884(4) | 25.923(5) |
| b [Å] | 6.9907(4) | 6.9847(14) | |
| c [Å] | 6.8141(5) | 14.6692(10) | 7.2197(14) |
| α [°] | 98.926(5) | ||
| β [°] | 95.975(5) | 97.46(3) | |
| γ [°] | 92.474(5) | ||
| V [Å3] | 1918.3(2) | 692.78(7) | 1296.2(4) |
| Z | 4 | 2 | 4 |
| T [K] | 180(2) | 180(2) | 150(2) |
| λ [Å] | MoKα | MoKα | 0.8 |
| d c [g cm−3] | 1.251 | 1.492 | 1.508 |
| μ(λ) [mm−1] | 1.104 | 1.519 | 2.238 |
| F[000] | 756 | 322 | 604 |
| 2θmax [°] | 52 | 52 | 53.8 |
| Meas reflns | 3401 | 16![[thin space (1/6-em)]](https://www.rsc.org/images/entities/char_2009.gif) 154 154 |
5360 |
| Unique reflns | 1025 | —d | 2002 |
| R int | 0.0567 | — | 0.1224 |
| Reflns with I > 2σ(I) | 885 | 11![[thin space (1/6-em)]](https://www.rsc.org/images/entities/char_2009.gif) 492 492 |
1976 |
| Refined params | 66 | 178 | 147 |
| R 1 (I > 2σ(I))a | 0.0374 | 0.0624 | 0.0490 |
| wR2 (all data)b | 0.0925 | 0.1689 | 0.1309 |
| % 2nd component | 37.913 | ||
| Abs. struct. param. | 0.26(2) | ||
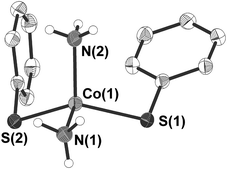
3 crystallises in the form of dark blue crystals in the triclinic space group P![[1 with combining macron]](https://www.rsc.org/images/entities/char_0031_0304.gif) (Table 1). The cobalt atom is coordinated by two phenylthiolate and two ammonia ligands in a distorted tetrahedral fashion (Fig. 2). Bond angles at the cobalt atom range from 104.56(10)–125.87(2)° with the smallest angle formed by the nitrogen atoms N(1) and N(2) of two ammonia ligands and the largest between the two thiolato ligands (S(1), S(2)). Values of the Co–N (204.6(2), 204.7(2) pm) as well as Co–S (230.25(6), 230.59(6) pm) bond distances are for example comparable to those found in the related mixed thiolato-/ammonia cobalt complex [Co(SSi(OAr)3)2(NH3)2] (Ar = 2,6-iPr2C6H3) (Co–N: 205.2(4); Co–S: 228.62(8) pm).40 The planes of the two phenyl rings are almost orthogonal to each other (angle: 87.2(2)°). Short intermolecular S⋯H distances of 259.4–267.7 pm between two of the hydrogen atoms of each ammonia ligand and the sulfur atoms of the phenyl thiolato ligands of neighboring molecules are indicative for hydrogen bonding in the crystal lattice (Fig. S2, ESI†). In addition the shortest intermolecular Co⋯Co distances amount to only 432.3 pm.
(Table 1). The cobalt atom is coordinated by two phenylthiolate and two ammonia ligands in a distorted tetrahedral fashion (Fig. 2). Bond angles at the cobalt atom range from 104.56(10)–125.87(2)° with the smallest angle formed by the nitrogen atoms N(1) and N(2) of two ammonia ligands and the largest between the two thiolato ligands (S(1), S(2)). Values of the Co–N (204.6(2), 204.7(2) pm) as well as Co–S (230.25(6), 230.59(6) pm) bond distances are for example comparable to those found in the related mixed thiolato-/ammonia cobalt complex [Co(SSi(OAr)3)2(NH3)2] (Ar = 2,6-iPr2C6H3) (Co–N: 205.2(4); Co–S: 228.62(8) pm).40 The planes of the two phenyl rings are almost orthogonal to each other (angle: 87.2(2)°). Short intermolecular S⋯H distances of 259.4–267.7 pm between two of the hydrogen atoms of each ammonia ligand and the sulfur atoms of the phenyl thiolato ligands of neighboring molecules are indicative for hydrogen bonding in the crystal lattice (Fig. S2, ESI†). In addition the shortest intermolecular Co⋯Co distances amount to only 432.3 pm.
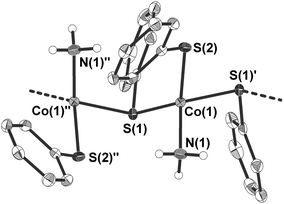
4 crystallises as a ‘hair-like’ green crystalline precipitate in the monoclinic space group Cc (Table 1 and Fig. 3). The crystal structure of the tiny crystals could only be determined by the help of the ANKA synchrotron source. In the crystal structure the cobalt atoms are μ2-bridged in one dimension by one of the two phenyl thiolato ligands to form infinite chains (Fig. 3). The distorted tetrahedral coordination sphere around the cobalt atoms is completed by two terminal ligands, one being ammonia and the other phenyl thiolato. Bond angles at the cobalt atom range from 94.46(6)–125.94(6)° with the smallest and largest angle formed by the sulfur atom S(2) of the terminal thiolato ligand with the two bridging sulfur atom S(1) and S(1)′. The Co–S–Co bridging angle at the sulfur atom amounts to 103.05(6)°. Values of the Co–N bond distances (205.3(5) pm) are similar to those observed in 3 whereas the Co–S bond length of the terminal thiolato ligand is only slightly shorter (227.68(15) pm) than the respective distances in the bridge (229.64(19) and 231.44(18) pm). Structures of comparable polymeric thiolato complexes of cobalt have so far not been reported.
A comparison of the measured and calculated X-ray powder diffraction patterns for 2, 3 and 4 reveals the crystalline purity with respect to the formation of other crystalline compounds (Fig. S3–S5, ESI†). Slightly increasing differences in the position of the peaks with increasing detection angle arise from the temperature difference of the data collections (single crystal XRD at 180 K and powder XRD at room temperature).
Optical properties
Electronic spectra of 2–4 have been measured in a region from 350 to 2250 nm (28![[thin space (1/6-em)]](https://www.rsc.org/images/entities/char_2009.gif) 571 to 4444 cm−1) as grindings of polycrystalline powders in mineral oil between two quartz plates (Fig. 4 and 5). All spectra can be roughly divided into a region with more and less intense bands, the former ones assigned to charge transfer bands and the latter ones most probably belonging to d–d transitions. However, due to the non-validity of the Lambert–Beer law for this kind of sample preparation this assignment has to be taken with care. For a free ion Co2+ the ground state is 4F9/2 which in a tetrahedral field of Td symmetry splits into 4A + 4T2 + 4T1. The first excited quartet term 4P correlates in a tetrahedral ligand field with 4T1. In the ideal symmetric tetrahedral Co2+ complexes one would therefore expect three d–d transitions. Complete removal of symmetry should lift the degeneracy of the T representations leading theoretically to a maximum of nine transitions which are expected to partially overlap and comprise different transition dipol moments. Usually the 4T1(4F) ← 4A(4F) and 4T1(4P) ← 4A(4F) transitions appear as multiple absorptions in the near infrared and visible regions respectively.42 A related recent detailed analysis of the UV-vis-NIR spectra of the complex anions [Co(EPh)4]2− (E = O, S, Se) can be found in ref. 17 and 43.
571 to 4444 cm−1) as grindings of polycrystalline powders in mineral oil between two quartz plates (Fig. 4 and 5). All spectra can be roughly divided into a region with more and less intense bands, the former ones assigned to charge transfer bands and the latter ones most probably belonging to d–d transitions. However, due to the non-validity of the Lambert–Beer law for this kind of sample preparation this assignment has to be taken with care. For a free ion Co2+ the ground state is 4F9/2 which in a tetrahedral field of Td symmetry splits into 4A + 4T2 + 4T1. The first excited quartet term 4P correlates in a tetrahedral ligand field with 4T1. In the ideal symmetric tetrahedral Co2+ complexes one would therefore expect three d–d transitions. Complete removal of symmetry should lift the degeneracy of the T representations leading theoretically to a maximum of nine transitions which are expected to partially overlap and comprise different transition dipol moments. Usually the 4T1(4F) ← 4A(4F) and 4T1(4P) ← 4A(4F) transitions appear as multiple absorptions in the near infrared and visible regions respectively.42 A related recent detailed analysis of the UV-vis-NIR spectra of the complex anions [Co(EPh)4]2− (E = O, S, Se) can be found in ref. 17 and 43.
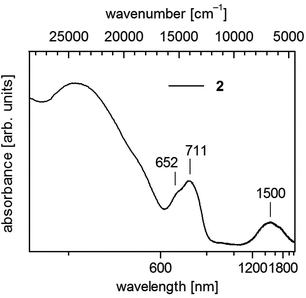 | ||
| Fig. 4 UV-vis-NIR spectrum of 1∞[Co(SMes)2] (2) in solid state (powder of microcrystals in mineral oil between quartz plates). | ||
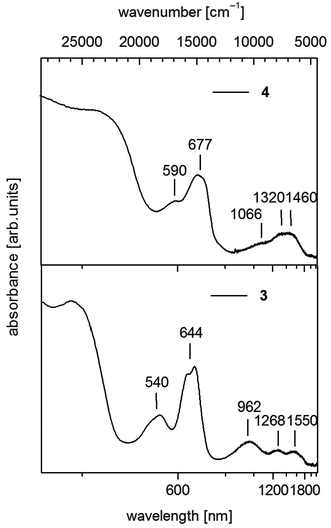 | ||
| Fig. 5 UV-vis-NIR spectra of [Co(SPh)2(NH3)2] (3) (down) and 1∞[Co(SPh)2(NH3)] (4) (up) in solid state (powder of microcrystals in mineral oil between quartz plates). | ||
Polymeric 2 displays below 600 nm a shoulder and a maximum centering around 680 nm (14![[thin space (1/6-em)]](https://www.rsc.org/images/entities/char_2009.gif) 700 cm−1) and further in the near infrared a broad band around 1500 nm (6670 cm−1) (Fig. 4). In accordance with spectra of homoleptic Co(II) complexes like [Co(SPh)4]2− (ref. 17 and 43) one can assign these bands to transitions to the 4T1(4P) and 4T1(F) states, respectively.
700 cm−1) and further in the near infrared a broad band around 1500 nm (6670 cm−1) (Fig. 4). In accordance with spectra of homoleptic Co(II) complexes like [Co(SPh)4]2− (ref. 17 and 43) one can assign these bands to transitions to the 4T1(4P) and 4T1(F) states, respectively.
For 3 we observe below 500 nm (20![[thin space (1/6-em)]](https://www.rsc.org/images/entities/char_2009.gif) 000 cm−1) a pair of two bands in the visible between 500 and 750 nm (20
000 cm−1) a pair of two bands in the visible between 500 and 750 nm (20![[thin space (1/6-em)]](https://www.rsc.org/images/entities/char_2009.gif) 000–13
000–13![[thin space (1/6-em)]](https://www.rsc.org/images/entities/char_2009.gif) 333 cm−1) and a group of three broad bands in the near infrared between 750 and 1850 nm (13
333 cm−1) and a group of three broad bands in the near infrared between 750 and 1850 nm (13![[thin space (1/6-em)]](https://www.rsc.org/images/entities/char_2009.gif) 333–5406 cm−1) (Fig. 5). In the case of CoL2X2 complexes with C2v symmetry three bands are usually seen in the near infrared if L and X differ significantly in ligand field strength. These bands are suggested to correspond in most cases with the three components of 4T1(F).42 Then the two bands in the visible at 540 nm (18
333–5406 cm−1) (Fig. 5). In the case of CoL2X2 complexes with C2v symmetry three bands are usually seen in the near infrared if L and X differ significantly in ligand field strength. These bands are suggested to correspond in most cases with the three components of 4T1(F).42 Then the two bands in the visible at 540 nm (18![[thin space (1/6-em)]](https://www.rsc.org/images/entities/char_2009.gif) 519 cm−1) and 644 nm (15
519 cm−1) and 644 nm (15![[thin space (1/6-em)]](https://www.rsc.org/images/entities/char_2009.gif) 528 cm−1) should originate from transitions to the split 4T1(4P) state.
528 cm−1) should originate from transitions to the split 4T1(4P) state.
Polymeric 4 displays a similar set of bands in the region above 500 nm comprising two bands in the visible at 590 nm (16![[thin space (1/6-em)]](https://www.rsc.org/images/entities/char_2009.gif) 949 cm−1) and 677 nm (14
949 cm−1) and 677 nm (14![[thin space (1/6-em)]](https://www.rsc.org/images/entities/char_2009.gif) 771 cm−1) (Fig. 5). However the maxima in the NIR region are not as distinct as in 3 and can roughly be estimated at 1066 nm (9380 cm−1), 1320 nm (7576 cm−1) and 1460 nm (6849 cm−1). These values indicate an increase of the ligand field splitting ongoing from 2 to 4 to 3 by exchange of one or two thiolato ligands with π-donor properties against the stronger σ-donor ligand NH3.
771 cm−1) (Fig. 5). However the maxima in the NIR region are not as distinct as in 3 and can roughly be estimated at 1066 nm (9380 cm−1), 1320 nm (7576 cm−1) and 1460 nm (6849 cm−1). These values indicate an increase of the ligand field splitting ongoing from 2 to 4 to 3 by exchange of one or two thiolato ligands with π-donor properties against the stronger σ-donor ligand NH3.
Magnetic properties
The magnetic behavior of polymeric 2 (Fig. 6) measured between 2 and 300 K in a field of 0.1 T displays a broad maximum in the temperature dependence of χ centered around 180 K which is characteristic for strong antiferromagnetic exchange in the chain. A similar behavior has been recently observed for the isostructural chain compounds 1∞[M(SeMes)2] (M = Mn, Fe).24,25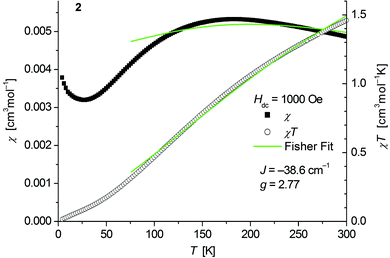 | ||
| Fig. 6 Temperature dependence of χ (filled squares) and χT (open circles) of 1∞[Co(SMes)2] (2). Solid green lines represent the results of the fitting to Fisher's equation (eqn (1)). | ||
In general the magnetic behavior of antiferromagnetic chain compounds has been extensively studied for many years.44 Ideal systems show a broad maximum in the temperature dependence of the magnetic susceptibility (χ) as a result of short range ordering. Long range order is not possible in a one-dimensional system. In general two approaches have been taken in order to derive mathematical models for idealized chains. For large moments, such as in our previous work on 1∞[M(SeR)2] (M = Mn, Fe; R = Ph, Mes),24,25 the classical approximation used by Fisher45 is expected to be very good, while for smaller, quantum spin systems, the approach of Bonner and Fisher,46 expanded by Weng,47 is more appropriate, though neither of these models introduce an anisotropy parameter.
For the spin Hamiltonian
 | (1) |
 .
.
Fits to the classical Fisher method of the χ vs. T curve of 2 for the data between 75 and 300 K (eqn (1)) yield J = −38.6(9) cm−1 suggesting a stronger coupling in 2 than in the related mesitylselenolato complexes 1∞[M(SeMes)2] (M = Mn: J = 11.2 cm−1; M = Fe: J = −16.2 cm−1).24,25
Deviation from the model at low temperatures which has been also observed for the complexes 1∞[M(SeMes)2] (M = Mn, Fe) could originate from an increasing influence of zero field splitting where states with low Jeff may be preferentially populated as the temperature decreases. A paramagnetic tail which is observed below ca. 25 K might be attributed to a small amount of paramagnetic impurities and/or contributions of paramagnetic ends of chains. Isothermal magnetization curves of 2 at 5 K show no saturation up to 4.5 T consistent with an antiferromagnetic behaviour (Fig. S6, ESI†).
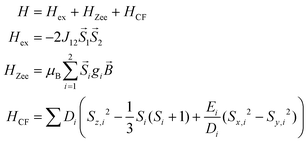
The static magnetic behavior of complex 3 was studied between 2 and 300 K in a field of 0.1 T and by magnetization measurements from 0 to 7 T at 2, 3, 4, 6, 10 and 25 K (Fig. 7 and S7, ESI†). A distinct maximum in the χ vs. T curve around 6 K is an indication for the presence of antiferromagnetic interactions in 3. The χT vs. T and M versus H curves at different temperatures calculated for a dinuclear unit of 3 were therefore simultaneously fitted using the PHI program48 by means of an isotropic spin Hamiltonian (SH) accounting for the exchange coupling (Heisenberg–Dirac–van Vleck Hamiltonian) and zero-field splitting (ZFS): (eqn (2)).
 | (2) |
 : spin vector;
  : magnetic field vector; g: g-factor; μB: Bohr magneton.
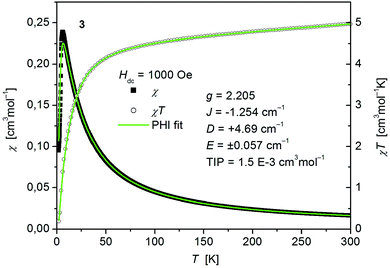 | ||
| Fig. 7 Temperature dependence of χ (filled squares) and χT (open circles) of [Co(SPh)2(NH3)2] (3). Solid green lines represent the results of the simultaneous fittings with the temperature dependent magnetization (Fig. S7, ESI†) according to a spin Hamiltonian (eqn (2)) by the PHI program. | ||
The fitted curves where found to describe the temperature dependent susceptibility quite well whereas they increasingly deviate for the magnetization curves below the antiferromagnetic transition point around 6 K (Fig. 7 and S7, ESI†). The parameters indicate a weak antiferromagnetic coupling (J = −1.254 cm−1) and the presence of magnetic anisotropy (g = 2.205, D = +4.69 cm−1, E = ±0.057 cm−1) as expected for tetrahedral Co2+.49 However, as both effects, antiferromagnetic coupling and ZFS, are known to have virtually the same effect on the temperature dependence of powder averaged data of χ, the absolute values of the fittings must be taken with care.
The magnetic behavior of polymeric 4 (Fig. 8) measured between 2 and 300 K in a field of 0.1 T displays, like polymeric 2, a broad maximum in the temperature dependence of χ centered around 135 K indicative for strong antiferromagnetic coupling. In main contrast 4 comprises one thiolato bridge with a Co–S–Co bridging angle of 103.5° instead of two in 2 (Co–S–Co: 93.54°). Fits to the classical Fisher method of the χ vs. T curve of 4 (eqn (1)) yield J = −27.1(2) cm−1. Magnetic data of comparable thiolato-bridged polymeric cobalt compounds have not been reported so far. In analogy to 2 the model deviates at low temperatures from the experimental curve for similar reasons given above. Isothermal magnetization curves of 4 at 4 K show no saturation up to 4.5 T consistent with an antiferromagnetic behaviour (Fig. S8, ESI†).
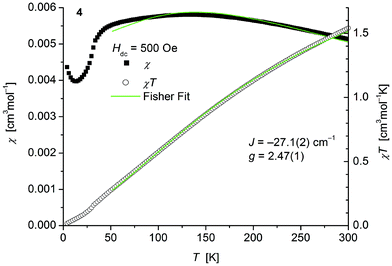 | ||
| Fig. 8 Temperature dependence of χ (filled squares) and χT (open circles) of 1∞[Co(SPh)2(NH3)] (4). Solid green lines represent the results of the fitting to Fisher's equation (eqn (1)). | ||
Thermal decomposition
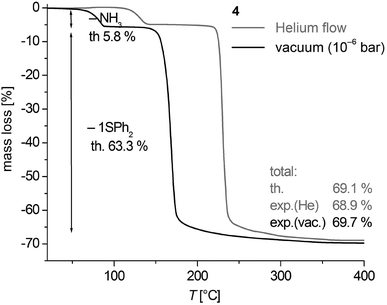
Thermogravimetric analysis (TGA) of 3 and 4 in a helium gas flow as well as under vacuum conditions (∼10−6 mbar) shows that the thermal decomposition occurs in well separated two-step processes in a temperature range between 35 and 255 °C (Fig. 9, S9, ESI† and Table 2). Under vacuum conditions the centers of the cleavage processes are shifted by 40–60 °C to lower temperatures. The mass change of the decomposition reactions corresponds to the calculated cleavage of two NH3 (calcd 10.9%) and one SPh2 (calcd 59.8%) for 3 and one NH3 (calcd 5.8%) and one SPh2 (calcd 63.3%) in case of 4. Thus the black solid residues of the TGA of 3 and 4 heated above 260 °C have the formal composition ‘CoS’. The XRD powder patterns of samples of 4 heated to 550 °C in vacuum (Fig. S10, ESI†) are in agreement with the theoretical peak pattern of the cobalt pentlandite structure with the formal composition ‘Co9S8’.50 It is presently not clear whether the sulphur (1.21 mass %) which should in theory be additionally cleaved is contained in the volatile decomposition products or as an amorphous product in the residue. Samples heated up to 260 °C are almost amorphous.Based on the fact that the cleavage of NH3 takes place in a well separated step from further decomposition to CoS we also investigated the intermediate product of polymeric 3 with the formal composition ‘Co(SPh)2’ with respect to its crystallinity by powder XRD. Powders from vacuum thermolysis up to 110 °C displayed after 1 h of isothermal treatment a pattern of an almost amorphous product with one broad reflection feature around 7° in 2θ (Fig. S11, ESI†). The pattern is similar to that obtained for 1 (Fig. S1, ESI†). Post annealing of this residue at 150 °C for 3–4 h under N2 atmosphere resulted in powders which display reasonable well-shaped reflection peaks (Fig. S11, ESI†). However, the pattern does not agree with the one obtained for 1b (Fig. S1, ESI†) and those simulated for the structures of the polymeric compounds 1∞[M(SePh)2] (M = Mn, Fe)24,25 or 3∞[Cd4(SPh)8].26 Attempts to suggest an appropriate structural model for subsequent refinement of the powder data proved to be not successful.
Conclusion
The first examples of polynuclear Co(II) thiolato complexes have been successfully synthesized and structurally characterized namely 1∞[Co(SMes)2] and 1∞[Co(SPh)2NH3]. Both complexes display strong antiferromagnetic coupling along the chains. In contrast [Co(SPh)2(NH3)2] consists of isolated distorted tetrahedral units which are stabilized in the crystal lattice by secondary S⋯H and Co⋯Co interactions giving rise to a weak antiferromagnetic coupling. The ammonia complexes [Co(SPh)2(NH3)2] and 1∞[Co(SPh)2NH3] were obtained in almost quantitative yields by in situ generation of NH3 in reactions of [Co(N(SiMe3)2)2thf] with 2 equiv. of HSPh upon addition of aliquots of CH3OH. Microcrystalline products of formal composition ‘Co(SPh)2’ can be obtained either from direct reactions of [Co(N(SiMe3)2)2thf] with 2 equiv. of HSPh in toluene at 105 °C or thermal cleavage of NH3 from 1∞[Co(SPh)2NH3]. However, attempts to solve the structure of them on the basis of the X-ray powder data were so far unsuccessful.Experimental section
Synthesis
Standard Schlenk techniques were employed throughout the syntheses using a double manifold vacuum line with high purity dry nitrogen (99.9994%) and a MBraun Glovebox with high purity dry argon (99.9990%). The solvent THF (tetrahydofuran), diethylether and toluene were dried over sodium-benzophenone, and distilled under nitrogen. CH3OH (H2O < 0.001%) obtained from Aldrich was degassed, freshly distilled and stored under nitrogen. HSPh was purchased from Aldrich and distilled prior to use. [Co(N(SiMe3)2)2(thf)] was prepared according to ref. 51.C12H15CoS2 (277.271): calcd C 52.0, H 3.6, S 23.1; found C 52.5, H 3.8, N 9.1, S 22.8.
In a second procedure the reaction mixture was heated before filtering for 4 hours to 105 °C to yield 98 mg (79%) of 1b (the ‘fluffy’ microcrystalline precipitate is statically charged and difficult to collect; the actual yield might be higher).
C12H15CoS2 (277.271): calcd C 52.0, H 3.6, S 23.1; found C 51.8, H 3.8, S 23.4.
![[thin space (1/6-em)]](https://www.rsc.org/images/entities/char_2009.gif) :
:![[thin space (1/6-em)]](https://www.rsc.org/images/entities/char_2009.gif) 1 mixture of toluene/thf and once with 10 ml of diethylether to give a total yield of 182 mg (92.8%).
1 mixture of toluene/thf and once with 10 ml of diethylether to give a total yield of 182 mg (92.8%).
C18H22CoS2 (361.43): calcd C 59.8, H 6.1, S 17.7; found C 61.4, H 6.6, S 14.6%.
C18H22CoS2·C4H8O (433.54): calcd C 61.0, H 7.0, S 14.8; found C 61.4, H 6.6, S 14.6%.
C12H18CoN2S2 (311.33): calcd C 46.3, H 5.2, N 9.0, S 20.6; found C 46.0, H 4.9, N 9.1, S 20.5.
C12H15CoNS2 (294.3): calcd C 49.0, H 4.5, N 4.8, S 21.8; found C 49.8, H 4.2, N 4.8, S 20.9%.
Crystallography
Crystals suitable for single crystal X-ray diffraction were taken directly from the reaction solution of the compound and then selected in perfluoroalkylether oil. Single-crystal X-ray diffraction data of 2 and 3 were collected using graphite-monochromatised MoKα radiation (λ = 0.71073 Å) on a STOE IPDS II (Imaging Plate Diffraction System). Single-crystal X-ray diffraction data of 4 were collected using synchrotron radiation (λ = 0.80 Å) on a STOE IPDS II (Imaging Plate Diffraction System) at the ANKA synchrotron source in Karlsruhe. Raw intensity data were collected and treated with the STOE X-Area software Version 1.39. All tested crystals of 3 were found to consist of intergrown species with nearly similar matrices. The data were therefore integrated as a twin that consists of two domains. The removal of overlapping reflections from the hkl file leads to a slightly reduced completeness of the data. Crystals of 4 consist of very tiny needles which diffract, although measured at a Synchrotron source, weekly at higher angles and were therefore measured only up to 2θ = 53.8°. The resulting R(int) is slightly enhanced. Data for all compounds were corrected for Lorentz and polarisation effects.Based on a crystal description numerical absorption corrections were applied for 2, 3 and 4.52 The structures were solved with the direct methods program SHELXS of the SHELXTL PC suite programs,53 and were refined with the use of the full-matrix least-squares program SHELXL. Twin Refinement of 3 with HKLF 5 sets MERG 0. Atomic form factors for λ = 0.80000 Å (15.510 keV) for 4 were obtained by the method of Brennan and Cowan54 as implemented on http://skuld.bmsc.washington.edu/scatter/AS_periodic.html. Molecular diagrams were prepared using Diamond.55
All Co, P, S, N and C atoms were refined in 2–4 with anisotropic displacement parameters whilst H atoms were placed in fixed positions. Lattice solvent molecules were identified within the structure of 2. These are located on a special position and could not be adequately refined due to disorder. The data were therefore corrected for these using the SQUEEZE option within the PLATON56 program package finding a total of 51 electrons in a potential solvent accessible area of ∼374 Å. Similarity restraints (for thermal parameters) were used for the hydrogen atoms H(13)–H(15) bonded to N(1) in 3. Also geometrical restraints (targeted bond distances) were used for H(13)–(15) bonded to N(1) in order to obtain a suitable model. H atoms of the NH3 group in 4 could not be localized in the difference Fourier map and were placed in fixed positions.
CCDC 1483692 (2), 1475643 (3) and 1475644 (4) contain the supplementary crystallographic data for this paper.
X-ray powder diffraction patterns (XRD) for 1–4 were measured on a STOE STADI MP diffractometer (Cu-Kα1 radiation, Germanium monochromator, Debye-Scherrer geometry, Mythen 1K detector) in sealed glass capillaries. X-ray powder diffraction patterns (XRD) of the products of the TGA of 4 were measured on a STOE STADI P diffractometer (Cu-Kα1 or Co-Kα1 radiation, Germanium monochromator, Debye-Scherrer geometry, Mythen 1K detector) in sealed glass capillaries. Theoretical powder diffraction patterns were calculated on the basis of the atom coordinates obtained from single crystal X-ray analysis by using the program package STOE WinXPOW.57
Physical measurements
C, H, S elemental analyses were performed on an ‘Elementar vario Micro cube’ instrument.Solid state UV-Vis spectra were measured as micron sized crystalline powders in mineral oil between quartz plates with a Labsphere integrating sphere.
Thermogravimetric analyses were run in Al2O3 crucibles on a thermobalance STA 409 from Netzsch in a dynamic helium gas flow (25 ml min−1) and under vacuum conditions 1.5 × 10⁻⁶ mbar at a heating rate of 2 °C min−1. The crucibles were filled (20–35 mg) inside an argon glove box, transferred in Schlenk tubes and mounted under a stream of argon to the balance. Caution should be taken with respect to the bad smelling volatile products formed in the TGA.
Zero–Field–Cooled (ZFC) temperature dependent susceptibilities were recorded for 2 in dc mode using a MPMS-III (Quantum Design) SQUID magnetometer over a temperature range from 2 to 300 K in a homogeneous 0.1 T external magnetic field. The magnetization curves were measured on the same instrument up to a dc field of 7 T. ZFC temperature dependent susceptibilities were recorded for 3 in RSO mode using a MPMS-5S (Quantum Design) SQUID magnetometer over a temperature range from 5 to 300 K in a homogeneous 0.1 T external magnetic field. The magnetization curves were measured on the same instrument up to a dc field of 4.5 T.
Ac susceptibility measurements of 3 have been performed at 2 K using a MPMS-XL (Quantum Design) SQUID magnetometer with an oscillating ac field of 3 Oe and ac frequencies ranging from 1 to 1500 Hz. There is no indication for a relevant signal of the out-of-phase component of the ac susceptibility (χ′′) even under applied dc fields up to 1000 Oe which indicates that under these conditions the spin lattice relaxation is faster than the timescale of the experiment.
The samples were contained in gelatine capsules filled in a glove box under argon atmosphere owing to the high degree of moisture and oxygen sensitivity of the compounds. The samples were transferred in sealed Schlenk tubes from the glove box to the magnetometer and then rapidly transferred to the helium-purged sample space of the magnetometer. The data were corrected for the sample holder including the gelatine capsule and for diamagnetism using Pascal's constants.58–60
Author contributions
A. Eichhöfer: synthesis, characterization, G. Buth: SCD beamline at ANKA synchrotron source.Conflict of interest
The authors declare no financial interests.Acknowledgements
This work was supported by the Karlsruhe Institut für Technologie (KIT, Campus Nord). The authors wish to thank A. K. Powell for generous support and S. Stahl for the performance of the elemental analysis.References
- I. Dance and K. Fisher, Prog. Inorg. Chem., 1994, 41, 637–803 CrossRef CAS.
- S. Dehnen, A. Eichhöfer and D. Fenske, Eur. J. Inorg. Chem., 2002, 279–317 CrossRef.
- M. W. DeGroot and J. F. Corrigan, in Comprehensive Coordination Chemistry II, ed. M. Fujita, A. Powell and C. Creutz, Pergamon, Oxford, UK, 2004, vol. 7, p. 57 Search PubMed.
- J. Arnold, Prog. Inorg. Chem., 1995, 43, 353–417 CrossRef CAS.
- M. Bochmann, Chem. Vap. Deposition, 1996, 2, 85–96 CrossRef CAS.
- N. F. Zheng, X. H. Bu, J. Lauda and P. Y. Feng, Chem. Mater., 2006, 18, 4307–4311 CrossRef CAS.
- M. Williams, R. M. Okasha, J. Nairn, B. Twamley, T. H. Afifi and P. J. Shapiro, Chem. Commun., 2007, 30, 3177–3179 RSC.
- J. Masnovi, K. K. Banger, P. E. Fanwick and A. F. Hepp, Polyhedron, 2015, 102, 246–252 CrossRef CAS.
- T. I. Levchenko, C. Kübel, D. Wang, B. Khalili Najafabadi, Y. Huang and J. F. Corrigan, Chem. Mater., 2015, 27, 3666–3682 CrossRef CAS.
- T. I. Levchenko, C. Kübel, Y. Huang and J. F. Corrigan, Chem. – Eur. J., 2011, 17, 14394–14398 CrossRef CAS PubMed.
- B. Krebs and G. Henkel, Angew. Chem., 1991, 103, 785–804 ( Angew. Chem., Int. Ed. Engl. , 1991 , 30(7) , 769–788 ) CrossRef CAS.
- B. Krebs and G. Henkel, Chem. Rev., 2004, 104(2), 801–824 CrossRef PubMed.
- A. G. Tennyson, A. Dhar and S. J. Lippard, J. Am. Chem. Soc., 2008, 130, 15087–15098 CrossRef CAS PubMed.
- V. P. Ananikov and I. P. Beletskaya, Dalton Trans., 2011, 40, 4011–4023 RSC.
- J. M. Zadrozny and J. R. Long, J. Am. Chem. Soc., 2011, 133, 20732–20734 CrossRef CAS PubMed.
- D. Maganas, S. Sottini, P. Kyritsis, E. J. J. Groenen and F. Neese, Inorg. Chem., 2011, 50, 8741–8754 CrossRef CAS PubMed.
- J. M. Zadrozny, J. Telser and J. R. Long, Polyhedron, 2013, 64, 209–217 CrossRef CAS.
- P. P. Power, Chem. Rev., 2012, 112, 3482–3507 CrossRef CAS PubMed.
- T. Nguyen, A. Panda, M. M. Olmstead, A. F. Richards, M. Stender, M. Brynda and P. P. Power, J. Am. Chem. Soc., 2005, 127, 8545–8552 CrossRef CAS PubMed.
- A. A. Ivanov, M. A. Kozee, W. A. Merrill, S. Agarwal and L. Dahl, J. Chem. Soc., Dalton Trans., 2002, 4105–4115 RSC.
- C. Zhang, S. Takada, M. Kölzer, T. Matsumoto and K. Tatsumi, Angew. Chem., Int. Ed., 2006, 45, 3768–3772 CrossRef CAS PubMed.
- D. Fenske and A. Fischer, Angew. Chem., Int. Ed. Engl., 1995, 34, 307–309 CrossRef CAS.
- M. Bochmann, A. K. Powell and X. Song, J. Chem. Soc., Dalton Trans., 1995, 1645–1648 RSC.
- A. Eichhöfer, P. T. Wood, R. N. Viswanath and R. A. Mole, Eur. J. Inorg. Chem., 2007, 4794–4799 CrossRef.
- A. Eichhöfer, G. Buth, F. Dolci, K. Fink, R. A. Mole and P. T. Wood, Dalton Trans., 2011, 40, 7022–7032 RSC.
- I. G. Dance, R. G. Garbutt and D. C. Craig, Inorg. Chem., 1987, 26, 3732–3740 CrossRef CAS.
- I. G. Dance, R. G. Garbutt, D. C. Craig and M. L. Scudder, Inorg. Chem., 1987, 26, 4057–4064 CrossRef CAS.
- K. S. Anjali and J. J. Vittal, Inorg. Chem. Commun., 2000, 3, 708–710 CrossRef.
- (a) P. P. Power and S. C. Shoner, Angew. Chem., Int. Ed. Engl., 1991, 30, 330–331 CrossRef; (b) J. Wang, F. Jian, B. Huang and Z. Bai, J. Solid State Chem., 2013, 204, 272–277 CrossRef CAS.
- D. Swenson, N. C. Baenziger and D. Coucouvanis, J. Am. Chem. Soc., 1978, 100, 1932–1934 CrossRef CAS.
- K. S. Hagen and R. H. Holm, Inorg. Chem., 1984, 23, 418–427 CrossRef CAS.
- G. Henkel and S. Weißgräber, Angew. Chem., Int. Ed. Engl., 1992, 31, 1368–1369 CrossRef.
- I. G. Dance, J. Am. Chem. Soc., 1979, 101, 6264–6273 CrossRef CAS.
- D. T. Corwin Jr., E. S. Gruf and S. A. Koch, J. Chem. Soc., Chem. Commun., 1987, 966–967 RSC.
- D. T. Corwin Jr., R. Fikar and S. A. Koch, Inorg. Chem., 1987, 26, 3080–3082 CrossRef.
- D. M. Hankin, A. A. Danopoulos, G. Wilkinson, T. K. N. Sweet and M. B. Hursthouse, Dalton Trans., 1996, 4063–4069 RSC.
- H. K. Lee, C. H. Lam, S.-L. Li, Z.-Y. Zhang and T. C. W. Mak, Inorg. Chem., 2001, 40, 4691–4695 CrossRef CAS PubMed.
- R. K. Chadra, R. Kumar, J. R. Lopez-Grado and D. G. Tuck, Can. J. Chem., 1988, 66, 2151–2156 CrossRef.
- B. Becker, A. Zalewska, A. Konitz and W. Wojnowski, Z. Anorg. Allg. Chem., 2001, 627, 271–279 CrossRef CAS.
- B. Becker, A. Pladzyk, A. Konitz and W. Wojnowski, Appl. Organomet. Chem., 2002, 16, 517–524 CrossRef CAS.
- A. Dołęga, A. Jabłońska, A. Pladzyk, L. Ponikiewski, W. Ferenc, J. Sarzyńskic and A. Herman, Dalton Trans., 2014, 43, 12766–12775 RSC.
- A. B. P. Lever, Inorganic Electronic Spectroscopy, Elsevier Science Publishing Co., Inc., New York, 2nd edn, 1984 Search PubMed.
- E. A. Suturina, D. Maganas, E. Bill, M. Atanasov and F. Neese, Inorg. Chem., 2015, 54(20), 9948–9961 CrossRef CAS PubMed.
- O. Kahn, Molecular Magnetism, Wiley-VCH, Weinheim, 1993 Search PubMed.
- M. E. Fisher, Am. J. Phys., 1964, 32, 343–346 CrossRef.
- J. C. Bonner and M. E. Fisher, Phys. Rev. A, 1964, 135, 640–658 CrossRef.
- C. Y. Weng, PhD Thesis, Carnegie Mellon University, Pittsburgh PA, USA, 1969.
- N. F. Chilton, R. P. Anderson, L. D. Turner, A. Soncini and K. S. Murray, J. Comput. Chem., 2013, 34, 1164–1175 CrossRef CAS PubMed.
- R. Boča, Coord. Chem. Rev., 2004, 248, 757–815 CrossRef.
- S. Geller, Acta Crystallogr., 1962, 15, 1195–1198 CrossRef CAS.
- A. Eichhöfer, Y. Lan, V. Mereacre, T. Bodenstein and F. Weigend, Inorg. Chem., 2014, 53, 1962–1974 CrossRef PubMed.
- X-RED32 1.01, Data Reduction Program, Stoe & Cie GmbH, Darmstadt, Germany, 2001 Search PubMed.
- G. M. Sheldrick, SHELXTL PC version 5.1 An Integrated System for Solving, Refining, and Displaying Crystal Structures from Diffraction Data, Bruker Analytical X-ray Systems, Karlsruhe, 2000 Search PubMed.
- S. Brennan and P. L. Cowan, Rev. Sci. Instrum., 1992, 63, 850–853 CrossRef.
- K. Brandenburg, Diamond Version 2.1d, Crystal Impact GbR, 1996–2000 Search PubMed.
- A. L. Spek, Acta Crystallogr., Sect. A: Fundam. Crystallogr., 1990, 46, C-34 Search PubMed.
- STOE, WinXPOW, STOE & Cie GmbH, Darmstadt, 2000 Search PubMed.
- O. Kahn, Molecular Magnetism, Wiley-VCH, Weinheim, 1993 Search PubMed.
- H. Lueken, Magnetochemie, B. G. Teubner, Stuttgart, Leibzig, 1999, p. 426 Search PubMed.
- W. Haberditzl, Angew. Chem., 1966, 78, 277–312 ( Angew. Chem., Int. Ed. Engl. , 1966 , 5 , 288–323 ) CrossRef CAS.
Footnote |
| † Electronic supplementary information (ESI) available: Measured and simulated X-ray powder patterns, UV-Vis-NIR solid state spectra, plots of magnetization M versus H (measured, fitted). CCDC 1483692, 1475643 and 1475644. For ESI and crystallographic data in CIF or other electronic format see DOI: 10.1039/c6dt03098j |
| This journal is © The Royal Society of Chemistry 2016 |

