 Open Access Article
Creative Commons Attribution 3.0 Unported Licence
Photodeposition as a facile route to tunable Pt photocatalysts for hydrogen production: on the role of methanol†
Zhi
Jiang
a,
ZheYu
Zhang
a,
Wenfeng
Shangguan
*a,
Mark A.
Isaacs
b,
Lee J.
Durndell
b,
Christopher M. A.
Parlett
b and
Adam F.
Lee
 *b
*b
aResearch Center for Combustion and Environment Technology, Shanghai Jiao Tong University, Shanghai, 200240, China. E-mail: shangguan@sjtu.edu.cn; Tel: +86 21 34206020
bEuropean Bioenergy Research Institute, Aston University, Birmingham, UK. E-mail: a.f.lee@aston.ac.uk; Tel: +44 (0)1204 4036
First published on 12th November 2015
Abstract
Photodeposition of H2PtCl6 in the presence of methanol promotes the formation of highly dispersed, metallic Pt nanoparticles over titania, likely via capture of photogenerated holes by the alcohol to produce an excess of surface electrons for substrate-mediated transfer to Pt complexes, resulting in a high density of surface nucleation sites for Pt reduction. Photocatalytic hydrogen production from water is proportional to the surface density of Pt metal co-catalyst, and hence photodeposition in the presence of high methanol concentrations affords a facile route to optimising photocatalyst design and highlights the importance of tuning co-catalyst properties in photocatalysis.
Introduction
Energy security and climate change represent key global challenges arising from historic reliance on fossil fuels.1–3 Artificial photosynthesis offers the possibility of clean energy through water photolysis and renewable chemicals through CO2 utilisation as a sustainable feedstock, commonly termed solar fuels and chemicals.4–7 Hydrogen production through photocatalytic water splitting over semiconductor nanomaterials represents one of the most promising routes for the conversion and storage of solar energy in a form amenable for transportation.8–11 Photoconversion efficiency is critically dependent upon the degree of charge separation and migration achievable in such semiconductors,12 as well as the rate of subsequent surface catalysed reactions, properties which may be strongly influenced by the introduction of co-catalysts to the semiconductor surface.13–16 Controlling the physicochemical properties of co-catalysts, and understanding how these impact upon subsequent photocatalytic reactions, is thus essential in order to advance the rational design of improved, high efficiency materials for water splitting. However, elucidating the key physicochemical properties of co-catalysts in water splitting and related photocatalytic transformations remains challenging. For example, metallic Pt nanoparticle co-catalysts have been previously reported as either inferior,17–20 or superior,21,22 to electron rich/deficient Pt counterparts. Such inconsistencies may arise from the many differences in catalyst synthesis, which in turn may result in diverse nanoparticle size, dispersion, oxidation state and morphology. It is therefore highly desirable to develop synthetic routes capable of independently tuning the chemical state or particle size of such co-catalysts in order to definitively determine the key factors influencing Pt co-catalyst promotion and thereby optimise photocatalyst performance.We recently demonstrated an in situ polyol method as one route to the preparation of well-defined hybrid photocatalysts,23,24 however removal of the resultant ligands, long timescale, and poor cost efficiency for such a process remain problematic. Photodeposition (PD) offers an atom efficient and energy efficient versatile alternative method to introduce noble metal co-catalysts to semiconductor surfaces,25 although to date it has afforded poor control over properties of the deposited co-catalyst.25,26 Previous studies on the photodeposition of Pt over titania have focused on the development of novel molecular precursors, such as Pt(dcbpy)Cl2,27 or the loading/time-dependent evolution of platinum species28–30 and their reactivity for hydrogen production or methanol oxidation. In all cases, PD was performed in the presence of a fixed alcohol concentration to assist platinum reduction, typically 5–20 vol% methanol, although Ma et al. noted small differences in the size of Pt nanoparticles between 2 M methanol, ethanol and isopropanol.28 However, the influence of alcohol concentration on the PD process and resulting photoactivity has never been explored to date. Here we demonstrate the critical role of methanol in tuning the oxidation state and dispersion of Pt nanoparticles during their PD from aqueous chloroplatinic acid over titania, and hence photocatalytic performance in hydrogen evolution from water.
Experimental
Photodeposition was conducted within a Pyrex topped reaction cell. In a typical process, 1 g of TiO2 powder (P25, Degussa) was suspended in 120 ml water at 25 °C. An appropriate amount of chloroplatinic acid (H2PtCl6, Sinoreagent) was added, mixed under ultrasonication and subsequent stirring for 30 min, and the reaction vessel subsequently purged prior to irradiation under a 300 W Xe lamp for 6 h. The photodeposited powders were washed and filtered (300 ml water) before drying at 80 °C for 12 h. A series of Pt/TiO2 catalysts were prepared using the preceding PD process with various concentrations of methanolic solution (MeOH, Sinoreagent) to form the chloroplatinic acid/titania slurry prior to irradiation, denoted X% MeOH where the percentage represents the volume ratio of MeOH.As-prepared Pt/TiO2 samples were characterized by ICP-AES with an iCAP 6000 Thermo instrument, wide angle and high resolution XRD on a Bruker D Advance diffractometer, and TEM using a JEOL 2010 microscope operated at 200 kV. STEM were recorded using a Cs aberration-corrected JEOL 2100F microscope at 200 kV. Images were collected using a Gatan Ultrascan 4000 digital camera operated by Digital Micrograph software. Samples were dispersed in ethanol and deposited on 300-mesh carbon-supported copper grids and dried under ambient conditions. Particle size distributions are based on analysis of 200 particles for all samples. X-ray photoelectron spectra were acquired on a Kratos AXIS HSi spectrometer equipped with a charge neutralizer and monochromated Al Kα excitation source (1486.7 eV), with energies referenced to adventitious carbon at 284.6 eV. Spectral fitting was performed using CasaXPS version 2.3.14. Pt 4f XP spectra were fitted using a common asymmetric peak shape. Errors were estimated by varying the Shirley background-subtraction procedure across reasonable limits and re-calculating the component fits. Fluorescence mode Pt LIII-edge X-ray absorption spectra (XAS) were acquired with a Lytle detector on the BL14W1 beamline of the Shanghai Synchrotron Radiation Facility, Shanghai Institute of Applied Physics, China, using a Si(111) double-crystal monochromator, and ring energy of 3.5 GeV and currents of 140–210 mA. Specific (BET) surface areas were measured on a TriStar II 3020 Micromeritics porosimeter via nitrogen physisorption. Pt metal dispersions were quantified by hydrogen isotherm adsorption using a Quantachrome Autosorb at 40 °C after the samples were reduced in hydrogen at 150 °C (2 h) and degassed under flowing He (20 cm3 min−1) (2 h).
Photocatalytic water splitting was conducted in the Pyrex topped reaction cell employing 50 mg of Pt/TiO2 catalyst dispersed in 120 ml of a 20 vol% methanolic aqueous solution at 25 °C for 30 min to equilibrate any adsorption processes in the dark and ensure a uniform catalyst suspension. The reaction cell was then evacuated and irradiated under a 300 W Xe lamp to provide an approximate flux of 124.6 mW cm−2 inside the photoreactor. Evolved gases were analyzed by gas chromatography (GC-9200 equipped with TCD, and 6 m × 2 mm × 250 μm MS-5A column).
Results and discussion
The photocatalytic activity of the PD samples over 1 wt% Pt/TiO2 (P25) is shown in Fig. 1 as a function of methanol concentration employed during the PD synthesis. H2 productivity increased monotonically with methanol concentration from 0 to 100 vol%, resulting in a net enhancement of 92% across this range. The striking influence of MeOH upon PD may originate from improvements in any one (or combination) of the following three distinct processes:8 (i) photon absorption by the titania semiconductor; (ii) charge separation and transport within (and/or between) the semiconductor (and/or Pt particles); (iii) and surface charge transfer to water and reactive intermediates. Structural evolution of the PD catalysts was undertaken to elucidate which of these processes is responsible for the enhanced photocatalytic water splitting. Wide angle powder XRD of the as-prepared PD samples (Fig. 2a) showed only the expected anatase and rutile crystallites, whose relative intensity and crystallite size were almost invariant with methanol across the catalyst series (Table 1). Surface areas also changed little with methanol concentration, with a common value ∼50 m2 g−1.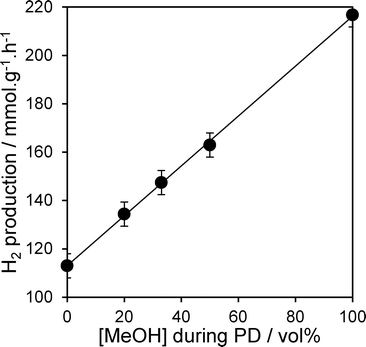 | ||
| Fig. 1 Photocatalytic hydrogen evolution over 1 wt% Pt/TiO2 catalysts as a function of methanol concentration during PD. | ||
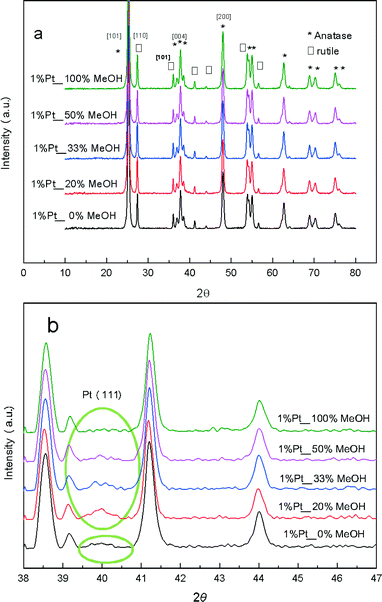 | ||
| Fig. 2 (a) Wide angle and (b) high resolution XRD patterns of 1 wt% Pt/TiO2 catalysts as a function of methanol concentration during PD. | ||
| Sample | Pt loadinga/wt% | BET surface areab/m2 g−1 | Anatase particle sizec/nm | Rutile particle sizec/nm |
|---|---|---|---|---|
| a ICP-AES elemental analysis. b N2 porosimetry. c XRD line broadening. | ||||
| P25 | — | 50 | 21.5 | 32.9 |
| 0% MeOH | 1.01 | 51 | 22.0 | 34.6 |
| 20% MeOH | 1.04 | 52 | 21.6 | 32.7 |
| 33% MeOH | 1.04 | 50 | 21.0 | 31.1 |
| 50% MeOH | 1.11 | 50 | 21.7 | 32.5 |
| 100% MeOH | 1.04 | 49 | 21.3 | 32.5 |
These observations indicate that methanol present during PD had negligible impact upon the composition or morphology of the titania component, or indeed the optical properties with band gaps for the 1 wt% Pt/TiO2 materials similar to the parent P25 titania (Fig. S1†).31,32 Since elemental analysis evidenced a common Pt loading, it is likely that methanol influenced either the physicochemical nature of the Pt co-catalyst species formed during PD, or associated interfacial interaction between co-catalyst and titania.
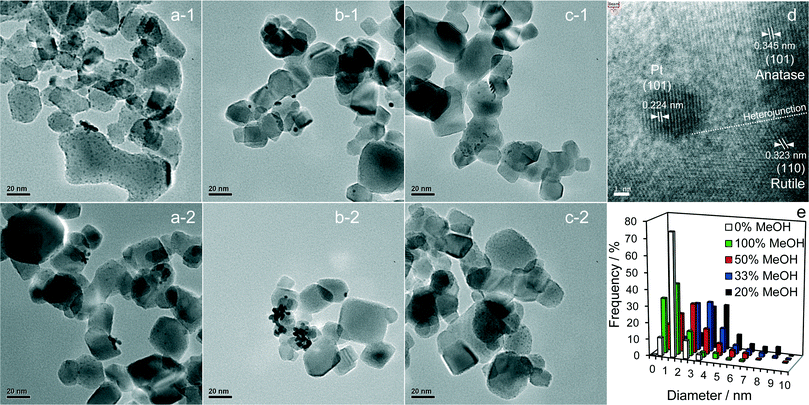
High resolution XRD of the PD synthesised catalysts revealed the presence of a weak, broad peak around 39.8° corresponding to fcc platinum metal for the MeOH-20% and MeOH-33% materials (Fig. 2b), whose intensity decreased with increasing MeOH concentration during PD. Surprisingly, this feature was absent for Pt/TiO2 prepared with pure water or pure methanol. Since all catalysts contained the same amount of platinum, and there was no evidence for crystalline Pt oxide phases, the loss of a metallic Pt feature with MeOH concentration could reflect a decrease in nanoparticle size, with the MeOH-0% and MeOH-100% materials containing either small metal (or potentially oxide or mononuclear Pt complexes) below the sensitivity limit. This hypothesis is supported by HRTEM (Fig. 3) and H2 chemisorption (Fig. S2†), which revealed highly dispersed Pt nanoparticles with diameters <2.5 nm for the MeOH-100% and MeOH-0% materials, in contrast to the MeOH-20% material which contained larger (>4 nm) Pt nanoparticles. Lattice fringes characteristic of fcc Pt metal were observable for all samples photodeposited in the presence of methanol. While a small number of Pt containing particles were observed at the interface of between titania crystallites (Fig. 3d), in general they appeared randomly distributed across the surfaces of both anatase and rutile crystallites (Fig. 3 and S3†). The Pt co-catalyst oxidation state was investigated by XPS (Fig. 4), with Pt 4f XP spectra revealing the co-existence of spin–orbit split doublets associated with Pt metal (4f7/2 = 70.4 eV binding energy), PtClx from the parent chloroplatinic acid (4f7/2 = 71.9 eV), and PtO2 (4f7/2 = 73.3 eV). The catalyst prepared in the absence of MeOH during PD comprised predominantly oxide and PtClx, the latter consistent with the presence of a Cl 2p peak (Fig. S4,† not observed for other catalysts) and the lack of Pt metal reflections by XRD. Corresponding O 1s XP spectra were dominated by the titania substrate, revealing only a single state at 529.8 eV (Fig. S5†) consistent with TiO2 independent of methanol concentration.33 Despite previous reports that photodeposition in the absence of an electron donor34 affords platinized-TiO2 containing mainly PtOx, we observe the co-existence of significant PtClx and (highly dispersed) PtO2 under such conditions (Fig. 5a). The proportion of Pt metal and PtClx precursor/PtO2 exhibit a striking switchover from electron-deficient → metallic platinum upon methanol introduction during PD. This is accompanied by an initial drop in the overall Pt![[thin space (1/6-em)]](https://www.rsc.org/images/entities/char_2009.gif) :
:![[thin space (1/6-em)]](https://www.rsc.org/images/entities/char_2009.gif) Ti surface atomic ratio between MeOH-0% and MeOH-20% (Fig. 5b) indicating a decrease in Pt dispersion, and subsequent monotonic rise associated with an increase in Pt dispersion. The Pt
Ti surface atomic ratio between MeOH-0% and MeOH-20% (Fig. 5b) indicating a decrease in Pt dispersion, and subsequent monotonic rise associated with an increase in Pt dispersion. The Pt![[thin space (1/6-em)]](https://www.rsc.org/images/entities/char_2009.gif) :
:![[thin space (1/6-em)]](https://www.rsc.org/images/entities/char_2009.gif) Ti surface atomic ratios also demonstrate that the surface coverage of Pt nanoparticles decorating the titania support varies between 0.33 and 0.5 of a monolayer with increasing methanol concentration. These observations are consistent with the presence of the parent PtClx precursor, and a high density of small oxidic Pt nanoparticles dispersed across titania when PD was conducted without methanol, and genesis of large metallic Pt particles on introducing a low concentration of methanol, which shrink but remain metallic as the methanol concentration rises. Methanol thus drives both platinum reduction and its subsequent redispersion, such that the surface density of Pt0 species increases continuously with the concentration of methanol during PD (Fig. 5b). It is important to note that this increase in surface metal occurs in parallel with the loss of corresponding XRD features, confirming that high methanol concentrations indeed promote Pt dispersion as small, metallic nanoparticles. The rise in surface Pt0 between M-20% and M-100% does not quantitatively match the associated 61% increase in H2 productivity, indicating a more significant role for co-catalyst particle size effects in photoactivity than previously reported.35
Ti surface atomic ratios also demonstrate that the surface coverage of Pt nanoparticles decorating the titania support varies between 0.33 and 0.5 of a monolayer with increasing methanol concentration. These observations are consistent with the presence of the parent PtClx precursor, and a high density of small oxidic Pt nanoparticles dispersed across titania when PD was conducted without methanol, and genesis of large metallic Pt particles on introducing a low concentration of methanol, which shrink but remain metallic as the methanol concentration rises. Methanol thus drives both platinum reduction and its subsequent redispersion, such that the surface density of Pt0 species increases continuously with the concentration of methanol during PD (Fig. 5b). It is important to note that this increase in surface metal occurs in parallel with the loss of corresponding XRD features, confirming that high methanol concentrations indeed promote Pt dispersion as small, metallic nanoparticles. The rise in surface Pt0 between M-20% and M-100% does not quantitatively match the associated 61% increase in H2 productivity, indicating a more significant role for co-catalyst particle size effects in photoactivity than previously reported.35
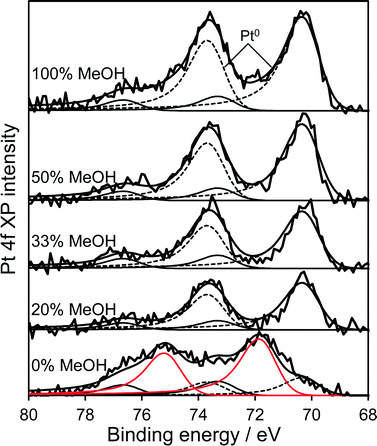 | ||
| Fig. 4 Pt 4f XP spectra of 1 wt% Pt/TiO2 catalysts as a function of methanol concentration during PD. | ||
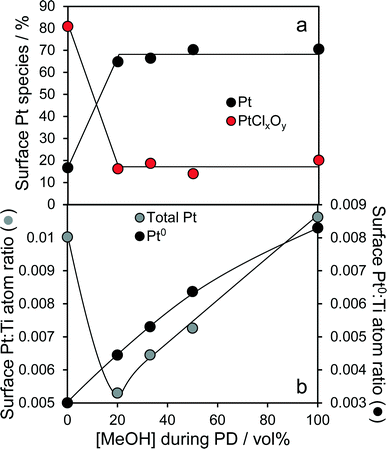 | ||
| Fig. 5 (a) Evolution of platinum surface oxidation state, and (b) relative dispersion of total and metallic platinum for 1 wt% Pt/TiO2 catalysts as a function of methanol concentration during PD. | ||
Pt LIII-edge XAS of the co-catalyst (Fig. 6a) reveal that normalised XANES spectra of MeOH-20% and MeOH-100% samples closely resemble bulk Pt metal, exhibiting smaller white lines than the methanol-free sample which exhibits features indicative of PtO2. Linear-combination fitting evidences a strong oxide → metal transition with increasing methanol concentration during PD (Fig. S6†), consistent with XPS. Corresponding EXAFS (Fig. S7†) and radial distribution functions (Fig. 6b) reveal a strong Pt–Pt scattering feature around 2.75 Å consistent with the formation of approximately 2.0 nm metal nanoparticles,36 again in accordance with XPS. In contrast, the sample prepared by PD without methanol exhibited both Pt–O (1.94 Å) and Pt–Pt (2.76 Å) scattering features, the latter weak, consistent with a majority of highly dispersed PtO2 nanoparticles and trace platinum metal (Table 2). It should also be noted that the 1 wt% Pt/TiO2 catalyst prepared via PD in the absence of methanol, which comprised predominantly electron deficient platinum, was also highly unstable during subsequent photocatalytic hydrogen production undergoing significant sintering as evidenced by post-reaction TEM and XRD (Fig. S8 and S10†); in situ Pt4+ reduction resulting from photocatalytic H2 generation provides a far more aggressive and undesirable route to metallic Pt co-catalysts than PD under methanol.
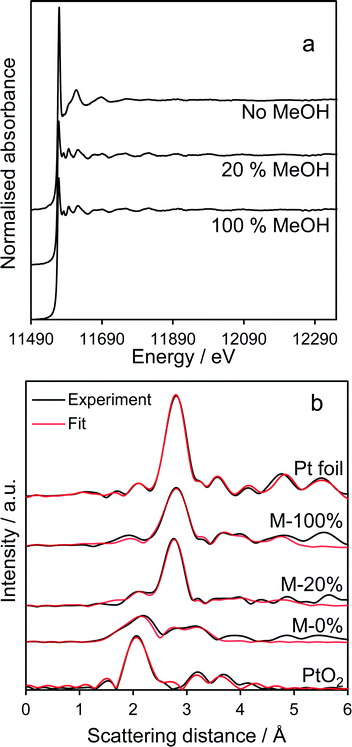 | ||
| Fig. 6 Fluorescence Pt LIII-edge (a) normalized XANES spectra and (b) radial distribution functions of Pt/TiO2 catalysts. Pt foil and oxide references shown for comparison. | ||
| Sample | CN1a Pt–Pt | CN2 Pt–Pt | CN3 Pt–Pt | CN1 Pt–O | CN2 Pt–O | CN3 Pt–Pt | Amplitude factor |
|---|---|---|---|---|---|---|---|
| Pt foil | 12 | 6 | 24 | — | — | — | 0.9037 |
| 100% MeOH | 7.6 | 1.0 | 3.1 | — | — | — | 0.9037/0.7933 |
| 20% MeOH | 8.5 | 1.7 | 3.6 | — | — | — | 0.9037/0.7933 |
| 0% MeOH | 1.5 | — | — | 1.2 | 2.1 | 1.3 | 0.9037/0.7933 |
| PtO2 | — | — | — | 2 | 4 | 2 | 0.7933 |
| Sample | R1b Pt–Pt | R2 Pt–Pt | R3 Pt–Pt | R1 Pt–O | R2 Pt–O | R1 Pt–Pt |
|---|---|---|---|---|---|---|
| Pt foil | 2.76 | 3.91 | 4.79 | — | — | — |
| 100% MeOH | 2.75 | 3.89 | 4.77 | — | — | — |
| 20% MeOH | 2.76 | 3.91 | 4.78 | — | — | — |
| 0% MeOH | 2.76 | — | — | 1.94 | 2.05 | 3.15 |
| PtO2 | — | — | — | 1.92 | 2.02 | 3.14 |
| Sample | σ1c Pt–Pt | σ2 Pt–Pt | σ3 Pt–Pt | σ2 Pt–O | σ2 Pt–O | R-factor % |
|---|---|---|---|---|---|---|
| a Coordination number. b Interatomic scattering distance. c Debye–Waller factor. | ||||||
| Pt foil | 0.005 | 0.006 | 0.007 | — | — | 3.18 |
| 100% MeOH | 0.005 | 0.005 | 0.006 | — | — | 4.09 |
| 20% MeOH | 0.005 | 0.006 | 0.006 | — | — | 3.57 |
| 0% MeOH | 0.004 | — | — | 0.007 | 0.007 | 6.19 |
| PtO2 | — | — | — | 0.006 | 0.003 | 4.78 |
In light of the above, we propose that methanol (present in solution and adsorbed at the surface of titania nanoparticles during platinum PD from chloroplatinic acid) acts as a surface hole accepter under UV-vis irradiation, facilitating the accumulation of a high density of electron-rich nucleation sites across the titania surface for the subsequent reduction of incident PtClx complexes to metallic nanoparticles (Fig. 7).
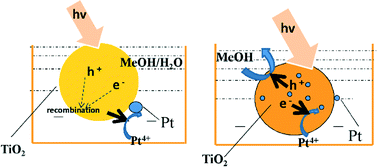 | ||
| Fig. 7 Schematic of the proposed mechanism for methanol-promoted PD of highly dispersed platinum nanoparticles over titania. | ||
Our route to a high density of metallic platinum nanoparticles in contact with titania is significant since photoexcited TiO2 is known to undergo charge equilibration through such a metal–oxide interface.12,37 Late transition metals favour the formation of a Schottky barrier with TiO2, enabling the trapping of photoexcited electrons.8,24 The correlation between photocatalytic H2 evolution (greatest for M-100%) and corresponding surface Pt metal coverage can therefore be rationalised. It is important to note that heterojunctions formed between anatase and rutile crystallites present in P25 may also serve to enhance charge separation via electron transfer from anatase to rutile, and the reverse transport of photoexcited holes, due to the higher conduction band edge of anatase.38–41 The Pt/titania heterojunction band structure and associated spatial separation of charge carriers is illustrated in Fig. 8.
 | ||
| Fig. 8 Schematic of photocatalytic hydrogen production via exciton creation and charge separation between highly dispersed platinum nanoparticles and titania. | ||
The loading dependence of Pt/TiO2 catalysts prepared via PD with identical methanol concentrations was also explored for hydrogen production (Fig. 9). Comparing 0.25, 0.5 and 2 wt% Pt/TiO2 photodeposited under methanol-free, or 20% and 100% methanol conditions, with our preceding 1 wt% Pt/TiO2 photocatalysts reveals that H2 productivity is loading dependent, passing through a maximum for the 1 wt% Pt/TiO2 catalyst. This can be readily rationalised in terms of the balance between optimising individual nanoparticle dispersion, and the absolute number of surface Pt sites. Dispersion is well-established to decrease with metal loading over any support (no XRD reflections were observable for the 0.25 or 0.5 wt% samples, Fig. S9,† consistent with diameters <2 nm), while the latter always increases with the number/size of individual nanoparticles and hence loading. Higher Pt loadings are not therefore cost-effective, with a small rate decrease observed above 1 wt% Pt. Importantly, the two lower loading catalysts exhibited a similar strong sensitivity to [MeOH] during photodeposition, confirming that methanol-induced photoreduction of H2PtCl6 is a general phenomenon over titania.
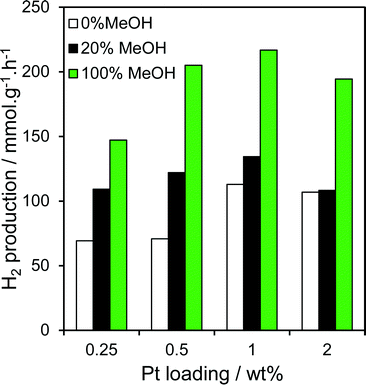 | ||
| Fig. 9 Photocatalytic hydrogen evolution over Pt/TiO2 catalysts as a function of Pt loading and methanol concentration during PD. | ||
Oxidation state and nanoparticle dispersion of the platinum co-catalyst emerge as key factors regulating photocatalytic water splitting. Indeed, the origin of the linear relationship between [MeOH] during PD and photoactivity observed in Fig. 1 appears related to the surface Pt0![[thin space (1/6-em)]](https://www.rsc.org/images/entities/char_2009.gif) :
:![[thin space (1/6-em)]](https://www.rsc.org/images/entities/char_2009.gif) Ti atomic ratio (from XPS) shown in Fig. 5b, indicating that hydrogen production scales with the interfacial contact area between titania and Pt metal. This relationship is highlighted in Fig. 10 and appears loading independent, offering a simple spectroscopic method by which to quantitatively predict the photocatalytic performance of Pt/TiO2 in hydrogen production.
Ti atomic ratio (from XPS) shown in Fig. 5b, indicating that hydrogen production scales with the interfacial contact area between titania and Pt metal. This relationship is highlighted in Fig. 10 and appears loading independent, offering a simple spectroscopic method by which to quantitatively predict the photocatalytic performance of Pt/TiO2 in hydrogen production.
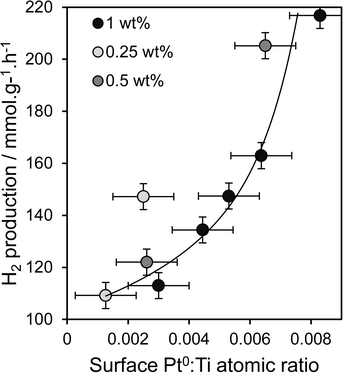 | ||
| Fig. 10 Relationship between the rate of photocatalytic hydrogen production and dispersion of metallic Pt metal for Pt/TiO2 catalysts prepared via PD. | ||
Considering that the co-catalyst physical and electronic properties are so important in this reaction, one must consider whether conventional methods of quantifying photocatalytic performance, such as the calculation of the quantum efficiency (η) or turnover frequency, which relate photoactivity to the number of incident photons which are incorporated into product molecules, are best suited to evaluating the impact of co-catalyst. Most water splitting photocatalysts are able to absorb incident photons but cannot split water without co-catalysts, hence it is difficult to decouple the absolute contributions of each component to hydrogen production.
Conclusions
Methanol plays a critical role in controlling platinum PD over titania through promoting the formation of highly dispersed metallic Pt nanoparticles at the titania interface via increasing the density of surface electrons available for reduction of the Pt4+ precursor. Pt nanoparticle size is inversely proportional to the concentration of methanol during catalyst synthesis by PD, affording a simple method by which to achieve high densities of metallic platinum over titania surfaces for low precious metal loadings. This discovery affords a simple and low cost means to improve the charge transport characteristics of semiconductor photocatalysts, through tunable Pt co-catalysts, and attendant performance in hydrogen evolution from water splitting.Acknowledgements
This work was supported by the financial support from Shanghai Natural Science Foundation (14ZR1421900), National Science Foundation of China (50906050). This research has been supported [in part] by EU Marie-Curie IRSES EU-China Cooperation for Liquid Fuels from Biomass Pyrolysis (FP7-PEOPLE-2009-IRSES Grant 246772). We thank the EPSRC (EP/K021796/1, EP/K029525/2 and EP/G007594/4) for financial support and a Leadership Fellowship (AFL).Notes and references
- J. A. Turner, Science, 2004, 305, 972–974 CrossRef CAS PubMed.
- N. Armaroli and V. Balzani, Angew. Chem., Int. Ed., 2007, 46, 52–66 CrossRef CAS PubMed.
- N. A. Owen, O. R. Inderwildi and D. A. King, Energy Policy, 2010, 38, 4743–4749 CrossRef.
- J. Barber, Chem. Soc. Rev., 2009, 38, 185–196 RSC.
- D. Gust, T. A. Moore and A. L. Moore, Acc. Chem. Res., 2009, 42, 1890–1898 CrossRef CAS PubMed.
- T. Faunce, S. Styring, M. R. Wasielewski, G. W. Brudvig, A. W. Rutherford, J. Messinger, A. F. Lee, C. L. Hill, H. deGroot, M. Fontecave, D. R. MacFarlane, B. Hankamer, D. G. Nocera, D. M. Tiede, H. Dau, W. Hillier, L. Wang and R. Amal, Energy Environ. Sci., 2013, 6, 1074–1076 Search PubMed.
- D. Chen, X. Zhang and A. F. Lee, J. Mater. Chem. A, 2015, 3, 14487–14516 CAS.
- A. Kudo, Catal. Surv. Asia, 2003, 7, 31–38 CrossRef CAS.
- K. Maeda and K. Domen, J. Phys. Chem. Lett., 2010, 1, 2655–2661 CrossRef CAS.
- D. Y. C. Leung, X. Fu, C. Wang, M. Ni, M. K. H. Leung, X. Wang and X. Fu, ChemSusChem, 2010, 3, 681–694 CrossRef CAS PubMed.
- X. Chen, S. Shen, L. Guo and S. S. Mao, Chem. Rev., 2010, 110, 6503–6570 CrossRef CAS PubMed.
- A. Kubacka, M. Fernández-García and G. Colón, Chem. Rev., 2012, 112, 1555–1614 CrossRef CAS PubMed.
- J.-M. Herrmann, Catal. Today, 1999, 53, 115–129 CrossRef CAS.
- J. S. Lee, Catal. Surv. Asia, 2005, 9, 217–227 CrossRef CAS.
- R. Abe, J. Photochem. Photobiol., C, 2010, 11, 179–209 CrossRef CAS.
- J. Yang, D. Wang, H. Han and C. Li, Acc. Chem. Res., 2013, 46, 1900–1909 CrossRef CAS PubMed.
- J. S. Jang, S. H. Choi, H. G. Kim and J. S. Lee, J. Phys. Chem. C, 2008, 112, 17200–17205 CAS.
- H. Wang, Z. Wu, Y. Liu and Y. Wang, Chemosphere, 2009, 74, 773–778 CrossRef CAS PubMed.
- R. M. Navarro, J. Arenales, F. Vaquero, I. D. González and J. L. G. Fierro, Catal. Today, 2013, 210, 33–38 CrossRef CAS.
- J. Xing, Y. H. Li, H. B. Jiang, Y. Wang and H. G. Yang, Int. J. Hydrogen Energy, 2014, 39, 1237–1242 CrossRef CAS.
- W. Y. Teoh, L. Mädler and R. Amal, J. Catal., 2007, 251, 271–280 CrossRef CAS.
- C.-H. Lin, J.-H. Chao, C.-H. Liu, J.-C. Chang and F.-C. Wang, Langmuir, 2008, 24, 9907–9915 CrossRef CAS PubMed.
- Z. Jiang, H. Guo, Z. Jiang, G. Chen, L. Xia, W. Shangguan and X. Wu, Chem. Commun., 2012, 48, 9598–9600 RSC.
- Z. Jiang and W. Shangguan, Catal. Today, 2015, 242, 372–380 CrossRef CAS.
- B. Kraeutler and A. J. Bard, J. Am. Chem. Soc., 1978, 100, 4317–4318 CrossRef CAS.
- H. Einaga and M. Harada, Langmuir, 2005, 21, 2578–2584 CrossRef CAS PubMed.
- R. S. Khnayzer, L. B. Thompson, M. Zamkov, S. Ardo, G. J. Meyer, C. J. Murphy and F. N. Castellano, J. Phys. Chem. C, 2012, 116, 1429–1438 CAS.
- J. Ma, E. Valenzuela, A. S. Gago, J. Rousseau, A. Habrioux and N. Alonso-Vante, J. Phys. Chem. C, 2014, 118, 1111–1117 CAS.
- L. M. Ahmed, I. Ivanova, F. H. Hussein and D. W. Bahnemann, Int. J. Photoenergy, 2014, 2014, 9 CrossRef.
- M. Kim, A. Razzaq, Y. K. Kim, S. Kim and S.-I. In, RSC Adv., 2014, 4, 51286–51293 RSC.
- M. D. Driessen and V. H. Grassian, J. Phys. Chem. B, 1998, 102, 1418–1423 CrossRef CAS.
- W. Zhao, C. Chen, X. Li, J. Zhao, H. Hidaka and N. Serpone, J. Phys. Chem. B, 2002, 106, 5022–5028 CrossRef CAS.
- V. N. I. o. S. a. T., NIST X-ray Photoelectron Spectroscopy Database, Gaithersburg, 2012, http://srdata.nist.gov/xps/ Search PubMed.
- T. Sano, N. Negishi, K. Uchino, J. Tanaka, S. Matsuzawa and K. Takeuchi, J. Photochem. Photobiol., A, 2003, 160, 93–98 CrossRef CAS.
- J. Lee and W. Choi, J. Phys. Chem. B, 2005, 109, 7399–7406 CrossRef CAS PubMed.
- A. I. Frenkel, C. W. Hills and R. G. Nuzzo, J. Phys. Chem. B, 2001, 105, 12689–12703 CrossRef CAS.
- A. L. Linsebigler, G. Lu and J. T. Yates, Chem. Rev., 1995, 95, 735–758 CrossRef CAS.
- D. C. Hurum, A. G. Agrios, K. A. Gray, T. Rajh and M. C. Thurnauer, J. Phys. Chem. B, 2003, 107, 4545–4549 CrossRef CAS.
- G. Li, S. Ciston, Z. V. Saponjic, L. Chen, N. M. Dimitrijevic, T. Rajh and K. A. Gray, J. Catal., 2008, 253, 105–110 CrossRef CAS.
- M. A. Henderson, Surf. Sci. Rep., 2011, 66, 185–297 CrossRef CAS.
- H. Xu, G. Li, G. Zhu, K. Zhu and S. Jin, Catal. Commun., 2015, 62, 52–56 CrossRef CAS.
Footnote |
| † Electronic supplementary information (ESI) available: Details of experimental, data of XRD, XPS, TEM, XAFS. See DOI: 10.1039/c5cy01364j |
| This journal is © The Royal Society of Chemistry 2016 |

