
 Open Access Article
 This Open Access Article is licensed under a
 Creative Commons Attribution 3.0 Unported Licence
In situ spectroscopic investigations of MoOx/Fe2O3 catalysts for the selective oxidation of methanol†
Catherine
Brookes
*ab,
Michael
Bowker
ab,
Emma K.
Gibson
ac,
Diego
Gianolio
d,
Khaled M. H.
Mohammed
ace,
Stephen
Parry
d,
Scott M.
Rogers
ac,
Ian P.
Silverwood
ac and
Peter P.
Wells
*ac
aUK Catalysis Hub, Research Complex at Harwell, Rutherford Appleton Laboratory, Harwell, Oxon OX11 0FA, UK. E-mail: catherine.brookes@rc-harwell.ac.uk; peter.wells@rc-harwell.ac.uk
bCardiff Catalysis Institute, School of Chemistry, Cardiff University, Park Place, Cardiff, CF10 3AT, UK
cDepartment of Chemistry, University College London, 20 Gordon St., London, WC1H 0AJ, UK
dDiamond Light Source, Harwell Science and Innovation Campus, Didcot, Oxon OX11 0DE, UK
eChemistry Department, Faculty of Science, Sohag University, Sohag, P.O.B 82524, Egypt
First published on 24th August 2015
Abstract
Multicomponent oxide shell@core catalysts have been prepared, affording overlayers of MoOx on Fe2O3. This design approach allows bulk characterization techniques, such as X-ray Absorption Fine Structure (XAFS), to provide surface sensitive information. Coupling this approach with in situ methodologies provides insights during crucial catalytic processes. Calcination studies were followed by a combination of XAFS and Raman, and demonstrate that amorphous multi-layers of MoOx are first converted to MoO3 before formation of Fe2(MoO4)3. However, a single overlayer of Oh Mo units remains at the surface at all times. In situ catalysis studies during formaldehyde production identified that Mo6+ was present throughout, confirming that gas phase oxygen transfer to molybdenum is rapid under reaction conditions. Reduction studies in the presence of MeOH resulted in the formation of reduced Mo–Mo clusters with a bonding distance of 2.6 Å. It is proposed that the presence of the clusters indicates that the selective conversion of MeOH to formaldehyde requires multiple Mo sites.
Introduction
Multi-component oxides have a wide range of catalytic applications, including selective alcohol oxidation and oxidative dehydrogenation of small chain alkanes.1–4 The activity of these heterogeneous catalysis materials is determined by the structural properties of their uppermost layer, which often vary considerably from the bulk structure.5,6 It has recently been demonstrated that the surface layer of Fe2(MoO4)3 is significantly different to the bulk structure; the surface layer is composed of Oh Mo units, compared to the Td Mo centres found in Fe2(MoO4)3.6,7 This is a key finding, as Fe2(MoO4)3 is a catalyst of significant industrial importance, being widely used in the selective oxidation of methanol to formaldehyde.5,8–12 Formaldehyde synthesis is a crucial industrial process, producing in excess of 6 million tonnes annually, and widely used as a building block to higher value products, e.g. resins, and adhesives.Unravelling the nature of the active site in commercial Fe2(MoO4)3 catalysts has always proved challenging, as excess Mo is incorporated into the synthesis procedure.13–15 Any Mo lost through sublimation has the potential to leave a vacant, unselective Fe site,16 and so the excess Mo is present to counter this eventuality.17 However, this approach is shown to leave a system containing multiple distinct phases including both MoO3 and Fe2(MoO4)3, with MoO3 shown to be present as particles that segregate to the surface.18 With a multitude of phases, this makes it difficult to assess the nature of the active site, with any in situ spectroscopic study probing a variety of surfaces and many spectator species. Conventional in situ X-ray diffraction (XRD) or X-ray absorption fine structure (XAFS) studies of bulk Fe2(MoO4)3 catalysts are unable to identify how the surface layer changes during important catalytic processes,19,20 as the surface layer makes up only a small proportion of the overall Mo sites. Our recent study7 on single MoOx overlayers on Fe2O3 demonstrate a comparable performance to Fe2(MoO4)3 catalysts. XAFS studies are element specific and provide a per atom average of all environments. However, when Mo is exclusively at the surface, XAFS is able to provide surface-sensitive information. Subsequently, when XAFS is applied under relevant in situ/operando conditions, it can provide accurate information about the nature of the active site in MoOx/Fe2O3 catalysts. The work herein demonstrates how model MoOx/Fe2O3 catalysts can be studied in situ for their preparation, reaction and deactivation, in order to shed light on how the same processes occur in conventional iron molybdate catalysts. More specifically, we address how the reaction mechanism proceeds at the surface, and how the catalyst is able to regenerate for further reaction and maintained selectivity.
Experimental
Catalyst preparation
MoOx/Fe2O3 was prepared using the incipient wetness technique. Commercial Fe2O3 (Sigma Aldrich, <50 nm) was first calcined at 500 °C for 3 hours, before adding the desired amount of aqueous ammonium heptamolybdate for 1, 3 or 6 monolayers (MLS) MoOx/Fe2O3. The samples were dried at 120 °C for 24 hours, before being calcined at 500 °C for 24 hours in a muffle furnace. For subsequent reduction studies, the calcined materials were reduced in a tube furnace under a methanol/He flow at 350 °C for three hours. Bulk phase samples were synthesised to be used as reference standards in the analysis. Stoichiometric Fe(NO3)3·9H2O (Fe(III), Sigma Aldrich >98%) was added drop wise to a stirring solution of (NH4)6Mo7O24·4H2O (Fluka Analytical, >99%) previously acidified to pH 2 with dilute HNO3. The resulting mixture was heated to 90 °C for ~1 hour until a yellow sludge remained. This was left to air dry overnight, after which it was dried at 120 °C for 24 hours, followed by calcination at 500 °C for 48 hours.Physical characterization
BET measurements were taken for the commercial Fe2O3 and prepared catalysts using a Micromeritics Gemini surface area analyzer. Raman measurements were carried out using a Renishaw Raman microscope with an 830 nm laser, over a wavenumber range of 100–1200 cm−1. Typical measurements used a 0.1% laser power, with 4 accumulations at 10 s exposure time for each. XRD of reference standards were performed on a Panalytical X'pert pro analyser with Cu Kα radiation. The IR data were recorded using a Thermo Scientific Nicolet iS10 FT-IR Spectrometer using an ATR accessory in the range of 500–2500 cm−1. Catalyst morphology and homogeneity were examined by both TEM (JEOL JEM 2100 EM) and SEM (JEOL JSM- 6610LV).Catalytic testing
Reactor data were obtained by use of a CATLAB reactor (Hiden Ltd, Warrington UK). For the catalytic reaction, 1 μl of liquid methanol was injected every 2 minutes into a flow of 10% O2/He, at a flow rate of 30 ml min−1. The products were determined by the online mass spectrometer integrated into the CATLAB system. For the TPD, approximately 6 injections of 1 μl methanol were dosed onto the catalyst, at ambient temperature in a flow of 30 ml min−1of He. This was followed by ramping the temperature to 400 °C at a rate of 8 °C min−1, whilst simultaneously monitoring the products formed by mass spectrometry.XAFS measurements
Mo k-edge XAFS studies were carried out on the B18 beamline at the Diamond Light Source, Didcot, UK. Measurements were performed using a QEXAFS set-up with a fast-scanning Si(III) double crystal monochromator. The time resolution of the spectra reported herein was 5 min per spectrum (kmax = 14), on average three scans were acquired to improve the signal to noise level of the data. Ex situ measurements were performed for the samples of Fe2(MoO4)3, MoO3 and dried 3 and 6 ML MoOx/Fe2O3, to be used as reference standards for linear combination analysis in XANES interpretations. All ex situ samples were diluted with cellulose and pressed into pellets to optimise the effective edge-step of the XAFS data and measured in transmission mode using ion chamber detectors. All transmission XAFS spectra were acquired concurrently with a Mo foil placed between It and Iref. XAS data processing and EXAFS analysis were performed using IFEFFIT21 with the Horae package22 (Athena and Artemis). The amplitude reduction factor, s20, was derived from EXAFS data analysis of a known Mo reference compound, MoO3, (with known coordination numbers which were fixed during analysis) to be 0.82, which was used as a fixed input parameter.In situ calcination and reduction studies were performed in transmission mode with a quartz capillary (OD 6 mm, wall thickness 250 μm) microreactor (Fig. 1). The microreactor is equipped with a gas supply system, integrated heating system and a Cirrus 100 quadrupole mass spectrometer to monitor the outlet gas composition online under various conditions. For the calcination studies, approximately 0.5 g of dried MoOx/Fe2O3 was heated using a staircase heating procedure with a ramp rate of 12 °C min−1 between 20 °C increments. The temperature was held for ten minutes at each increment point to 650 °C. XAFS data were recorded throughout the experiment, at a typical rate of 1 min per scan. On reaching the maximum temperature, the sample was held isothermally for 30 minutes to ensure no further changes occurred in the structure, after which it was cooled to room temperature. In addition to the in situ calcination described, the catalyst was ramped in temperature and held isothermally for 120 minutes at 250 °C. XAFS was monitored as MeOH in O2/He was passed over the catalyst bed, inducing a reaction at the surface.
 | ||
| Fig. 1 In situ quartz capillary microreactor for XAFS studies. (A) Hot air blower, (B) I0, (C) It, and (D) fluorescence detector. | ||
Reduction studies were carried out in a MeOH/He flow whilst heating to 350 °C at a rate of 12 °C min−1. XAFS spectra were collected throughout (~1 min per scan). Upon reaching 350 °C, the gas flow mixture was switched to pure He, and the sample cooled to room temperature.
Combined in situ XAFS/Raman studies
XAFS/Raman studies were performed using the same microreactor described, coupled with a custom-built optic-fibre-coupled, confocal Raman probe system (Fig. 2). The system uses a Renishaw RA100 spectrometer, with a Peltier cooled CCD detector and 1200 line grating, and a 300 mW, 785 nm diode laser (Renishaw HP785NIR). Laser light from the diode source was directed into the Raman probe using a multimode fibre optic, where lenses expanded and collimated the light. A ×20 magnification lens at the exit aperture of the probe focused the laser light to a ~500 μm spot at the sample. Edge filters (cut-off 100 nm above the laser line wavelength) were used to reject the laser light in the back reflected signal into the probe, and a condensing lens was used to focus this signal into a second multimode fibre optic which directed the signal into the RA100 spectrometer. Slits were used to attenuate the laser power on the sample to ~15 mW, to prevent sample damage and saturation of the detector. The spectrometer was calibrated using the emission lines from a Ne lamp, and checked using the main Raman band from a silicon wafer, setting the centre of this peak to 520 cm−1. Spectra were collected for 20 × 1 second scans using ‘static’ mode, with the grating angle fixed to illuminate the Raman spectrum across the CCD. The techniques were combined to follow the calcination study (as described previously) with the XAFS geometry adjusted to fluorescence mode. The change in acquisition mode to fluorescence allowed for undiluted materials to be used, in order to maximise Raman signal from the sample.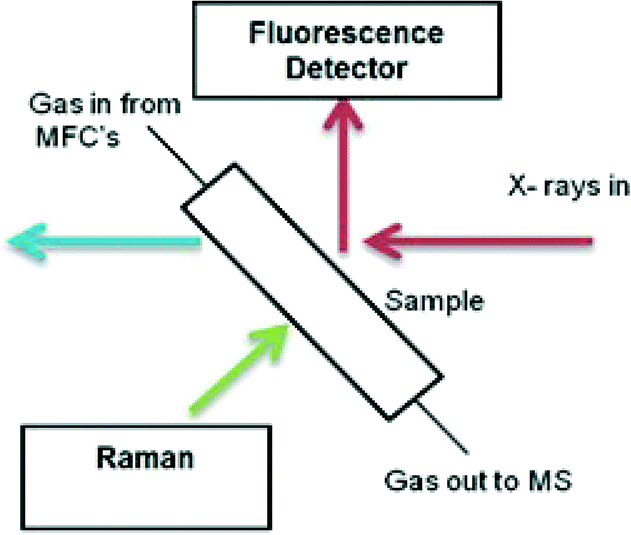 | ||
| Fig. 2 Schematic representation of the in situ XAFS/Raman set up performed in fluorescence mode. | ||
Results and discussion
In situ calcination studies
Prior to any experiments performed on the beamline, all catalysts were characterized by a variety of techniques. SEM-EDX mapping was performed to confirm the Mo loading, and to show that the molybdenum was well-dispersed across the entire catalyst (Fig. S1†). TEM analysis established the Mo to be present at the surface through EDX line scans (Fig. S2†). With knowledge of catalyst composition and homogeneity, vibrational studies were then able to provide insight into the oxide phases present with varying calcination temperature ex situ. Fig. S3–4† detail Raman spectroscopic studies for the 3 and 6 ML MoOx/Fe2O3 catalysts. Both show an obvious change from a MoO3 phase formed at elevated temperatures (>300 °C) to Fe2(MoO4)3 by 500 °C.The Mo K-edge XAFS data of the 3 and 6 ML MoOx/Fe2O3 samples calcined to 120, 300, 400, 500 and 600 °C have been previously measured ex situ and reported elsewhere.7 Although ex situ analysis provides a good indication of the catalyst composition at various pre-defined temperatures, it is limited in that it is unable to detect any transient phases formed prior to those identified at the selected set points. In situ studies enable the observation of successive changes within the catalyst structure under variable experimental conditions. The interpretation of features in the Mo XANES spectra involves the assignment of the pre-edge peak at ~19![[thin space (1/6-em)]](https://www.rsc.org/images/entities/char_2009.gif) 995 eV and the absorption edge at 20010 eV. The pre-edge peak is for the dipole forbidden/quadrupole allowed 1s–4d transition,23 and is most intense for tetrahedral Mo. However, it is also evident, but less intense, for structures with distorted octahedral geometry.24,25 The absorption edge at 20010 eV is assigned to the dipole allowed 1s–5p transition, and is a characteristic feature of Mo species with octahedral/distorted octahedral geometry. Results for the in situ calcination study are presented in Fig. 3–5. Data for the 3 and 6 ML MoOx/Fe2O3 catalysts are conclusive, with both showing a substantial enhancement of the Mo pre-edge with temperature increase. This is indicative of a transition from Oh to Td geometry. The effect was most pronounced for the 6 ML MoOx/Fe2O3 catalyst, as expected for the higher weight loading of Mo, which forms the greatest fraction of the Fe2(MoO4)3Td phase. The experiments involved steadily increasing the temperature until no further changes were observed in the XANES. LCA were performed to assess the amount of MoOx, MoO3 and Fe2(MoO4)3 present within the sample upon varying the temperature, with results presented in Fig. 4–5.
995 eV and the absorption edge at 20010 eV. The pre-edge peak is for the dipole forbidden/quadrupole allowed 1s–4d transition,23 and is most intense for tetrahedral Mo. However, it is also evident, but less intense, for structures with distorted octahedral geometry.24,25 The absorption edge at 20010 eV is assigned to the dipole allowed 1s–5p transition, and is a characteristic feature of Mo species with octahedral/distorted octahedral geometry. Results for the in situ calcination study are presented in Fig. 3–5. Data for the 3 and 6 ML MoOx/Fe2O3 catalysts are conclusive, with both showing a substantial enhancement of the Mo pre-edge with temperature increase. This is indicative of a transition from Oh to Td geometry. The effect was most pronounced for the 6 ML MoOx/Fe2O3 catalyst, as expected for the higher weight loading of Mo, which forms the greatest fraction of the Fe2(MoO4)3Td phase. The experiments involved steadily increasing the temperature until no further changes were observed in the XANES. LCA were performed to assess the amount of MoOx, MoO3 and Fe2(MoO4)3 present within the sample upon varying the temperature, with results presented in Fig. 4–5.
 | ||
| Fig. 3 Normalised XANES data for 6 ML MoOx/Fe2O3in situ calcination study. Approximately 0.5 g of the dried material for 6 ML MoOx/Fe2O3 was mixed with BN and loaded into the sample capillary. A 10% O2/He mixture was passed over the catalyst whilst heating to 640 °C at a ramp rate of 12 °C min−1. Temperatures from 300 °C to 640 °C are shown at 20 °C intervals. No changes were seen in the XANES below 300 °C. | ||
 | ||
| Fig. 4 Phase composition of MoOx, MoO3, Fe2(MoO4)3 with increasing calcination temperature, for 3 ML MoOx/Fe2O3. The calcination was performed as in Fig. 3, and the phase compostions were determined using linear combination analysis of MoO3 and Fe2(MoO4)3 (Sigma Aldrich) and the dried 3 ML MoOx/Fe2O3. | ||
 | ||
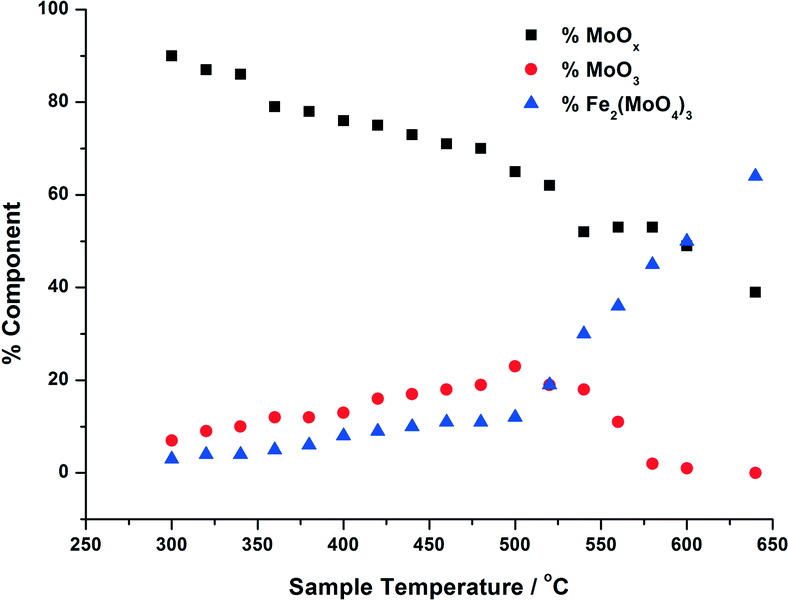
| Fig. 5 Phase composition of MoOx, MoO3, Fe2(MoO4)3 with increasing calcination temperature, for 6 ML MoOx/Fe2O3. The calcination was performed as in Fig. 3, and the phase compostions were determined using linear combination analysis of MoO3 and Fe2(MoO4)3 (Sigma Aldrich) and the dried 6 ML MoOx/Fe2O3. | ||
For the calcination study of 3 ML MoOx/Fe2O3 (Fig. 4), upon ramping from 300 °C, there is an immediate and steady decrease in the MoOx phase initially dosed at the surface. Parallel to this, there is also a slow but steady rise in MoO3 formation. At this point, the amount of Fe2(MoO4)3 within the fit does not rise significantly. By 520 °C, a discernible loss of MoO3 occurs, dropping by 6%. This point marks the onset of Fe2(MoO4)3 formation. The results imply that formation of MoO3 and the reaction with the Fe2O3 core is responsible for the formation of Td Fe2(MoO4)3. At the highest temperature of 650 °C there is no evidence of MoO3, and Fe2(MoO4)3 dominates with 64% of the total Mo dosed. It is important to note, that even at this temperature LCA demonstrates a 1 ML equivalent of surface MoOx still present, which fails to be incorporated into the Fe2(MoO4)3 phase. The stability of this overlayer has previously been established,7,26 as it still remains after calcination at 600 °C for 24 hours. A complementary study was performed for the 6 ML MoOx/Fe2O3 catalyst. It is important to highlight that a relative comparison could not be made to the 1 ML case since here we see no change in phase across the calcination range (Fig. S5†). The trends observed for the 6 ML catalyst (Fig. 5) are similar in nature to those discussed for 3 ML MoOx/Fe2O3, however, there are subtle variations. Again, the MoO3 is seen to primarily form, but in this case develops more rapidly at lower temperatures, with significant formation at 300 °C. For the 6 ML coverage there is double the amount of Mo dosed, therefore the proportion of MoO3 formed is higher than that in the 3 ML catalyst. By 360 °C, XANES analysis demonstrates 20% MoO3, with only 8% Fe2(MoO4)3 formed. The amount of Fe2(MoO4)3 is nearly constant between 300 and 500 °C, and only begins to sharply increase after 500 °C, and coincides with the decrease in MoO3 as it reacts with bulk Fe2O3. As was noted for the 3 ML sample, at the end of the calcination, we are left with a resultant 1 ML equivalent of MoOx, remaining segregated at the surface of the Fe2O3.
Fig. 6 presents the Raman data obtained from the in situ XAFS/Raman set up. Results reiterate the changes seen through XANES for the 6 ML MoOx/Fe2O3. For the purpose of this work, the 6 ML loading is discussed due to its higher Raman signal, however, results were also consistent for the 3 ML MoOx/Fe2O3 catalyst. MoO3 can be observed through the presence of bands at 820 and 990 cm−1, assigned to the Mo–O–Mo bridge and Mo![[double bond, length as m-dash]](https://www.rsc.org/images/entities/char_e001.gif) O terminal stretch, respectively.5 On increasing the temperature these bands diminish above 500 °C, which is in agreement with the results seen in the XANES analysis. By 540 °C, a new band appears at 780 cm−1, indicative of asymmetric MoO stretching in isolated MoO4 sites in Fe2(MoO4)3.5 The intensity of this band increases with further rises in temperature, with the bands at 820 and 990 cm−1 (corresponding to MoO3) decreasing. This is as a result of the conversion of MoO3 to Fe2(MoO4)3, through reaction with the Fe2O3 support. Above 600 °C, the peak intensity readily diminishes. These effects can be ascribed to the increased mobility of cationic species at higher temperature. On cooling, the bands associated with Fe2(MoO4)3 were visible once again as order within the sample is regained.
O terminal stretch, respectively.5 On increasing the temperature these bands diminish above 500 °C, which is in agreement with the results seen in the XANES analysis. By 540 °C, a new band appears at 780 cm−1, indicative of asymmetric MoO stretching in isolated MoO4 sites in Fe2(MoO4)3.5 The intensity of this band increases with further rises in temperature, with the bands at 820 and 990 cm−1 (corresponding to MoO3) decreasing. This is as a result of the conversion of MoO3 to Fe2(MoO4)3, through reaction with the Fe2O3 support. Above 600 °C, the peak intensity readily diminishes. These effects can be ascribed to the increased mobility of cationic species at higher temperature. On cooling, the bands associated with Fe2(MoO4)3 were visible once again as order within the sample is regained.
 | ||
| Fig. 6 Raman data collected in situ with combined XAFS/Raman for 6 ML MoOx/Fe2O3. The catalyst was ramped to 640 °C at a rate of 12 °C min−1. Spectra were collected for 20 × 1 second scans using ‘static’ mode, with the grating angle fixed to illuminate the Raman spectrum across the CCD. Temperatures from 300 °C to 620 °C are shown, those labelled (a) are the initial heating ramp, those labelled (b) represent the cooling cycle. | ||
The combined XAFS/Raman experiment was able to provide the following information, which the ex situ experiments alone were unable to provide:
i) The production of MoO3 progressively forms with rising calcination temperature. This was seen in both XANES and Raman spectra for the catalysts studied. Only once the levels of MoO3 plateau, does Fe2(MoO4)3 production commence. This would infer that MoO3 is a prerequisite to Fe2(MoO4)3 formation.
ii) The onset of substantial MoO3 formation occurs significantly earlier in 6 ML MoOx/Fe2O3 than 3 ML MoOx/Fe2O3, however both catalysts could not form any Fe2(MoO4)3 until 500 °C. It is believed therefore, that this is the thermal input required to form the mixed oxide.
The Raman studies were supported by complimentary in situ DRIFTS measurements of the 6 ML MoOx/Fe2O3 during calcination. Results can be referred to in Fig. S6†. With these studies, we have been able to demonstrate the use of combined in situ techniques to observe changes in catalyst structure under preparation conditions.
In situ catalysis studies
The nature of Mo during methanol oxidation was assessed with an in situ XAFS investigation. Fig. 7 shows the data obtained throughout a 120 minute time period, for the 6 ML MoOx/Fe2O3 catalyst. No obvious changes were observed in the absorption edge position, whilst Td co-ordination was maintained during the course of the reaction. The XAFS investigations found that the Mo environment was preserved under reaction conditions, enabling the sustained production of formaldehyde, as shown through the mass spectrometer data collected online for the duration of the experiment (Fig. 8). This is a direct consequence of the catalysts ability in maintaining its Mo(VI) state,10,27,28 through re-oxidation from gas phase oxygen. Mo(IV) may exist momentarily, but is unable to be seen due to the time scale of these studies. | ||
| Fig. 7 XANES data over a 90 minute period for 6 ML MoOx/Fe2O3 when reacted isothermally at 250 °C under a continuous flow of MeOH/O2. XAFS data was collected continuously using 1 minute scans, whilst Mass Spectrometer data was recorded simultaneously, to ensure a reaction was occurring. | ||
 | ||
| Fig. 8 Online Mass Spectrometry data for 6 ML MoOx/Fe2O3, when reacted isothermally in continuous flow under MeOH/O2 at 250 °C (see Fig. 7 for details). Selectivity to formaldehyde was 90%. The data has not been normalised to the fragmentation pattern of products produced. | ||
In situ reduction-oxidation studies
Although highly regarded for its efficiency in the reaction of methanol to formaldehyde, there is a somewhat limited knowledge regarding the reaction mechanisms involved at the catalyst surface of iron molybdate. It is agreed that during the reaction, partial reduction of the surface occurs, which is then counteracted by a quick regeneration through gas phase oxygen.29,30 It could be that Mo(IV) exists temporarily, however, it has not been possible to isolate this species under normal reaction conditions. A reduction study would be able to provide further information about the redox cycling of the Mo species.On bulk Fe2(MoO4)3,29 the reduction mechanism has been reported to occur as follows, resulting in a mixed phase catalyst:
| CH3OH + Fe2(MoO4)3 → 2β-FeMoO4 + MoO3 + HCHO + H2O | (1) |
| 4FeMoO4 + 2MoO3 + O2 → 2Fe2(MoO4)3 | (2) |
Zhang et al.31 used TPR to study the reduction process on Fe2(MoO4)3 with excess MoO3. They define peaks ascribed to the transformation of Fe2(MoO4)3 to β-FeMoO4 and Mo4O11, MoO3 to MoO2 and β-FeMoO4 to Fe2Mo3O8 and Fe3O4. Beale et al. enforce this idea, using combined in situ techniques,29 specifically WAXS, XANES and UV-Vis, to investigate Fe2(MoO4)3 in more detail. Under redox conditions, they were able to confirm the reduction to β-FeMoO4 and MoO3, which can further reduce to MoO2.
With a multitude of different phases forming under reduction, characterisation becomes complicated. Further to this, bulk techniques such as Raman spectroscopy are limited due a number of reasons;
i) They are unable to explicitly characterise the surface layer.
ii) Problems arise in studying many of the reduced phase catalysts by spectroscopy, as a result of their dark colour and absorbing characteristics.
iii) Previous characterisation performed ex situ has revealed that catalysts re-oxidise when left under atmospheric conditions. UV-Vis studies (Fig. S7†) of the post reacted and reduced samples show a mixed Mo5+/6+ oxidation state, an indication that the catalyst has partially re-oxidised back to its original state. This is further accelerated under the heat of the focussed Raman laser.
In this section we investigate the mechanisms occurring at the surface of FeMo based catalysts under reaction with MeOH/He. Initial ex situ studies probed the reduction process in bulk Fe2(MoO4)3. Data presented through XAFS analysis (Fig. S10†) clearly evidenced the formation of MoO2 and FeMoO4. This was also ascertained through a variety of techniques, including Raman and XRD. (Fig. S8–9†).
In studying MoOx/Fe2O3 catalysts, this allows us to exclusively probe the active topmost layer, without the added complication of secondary phases such as MoO2 and β-FeMoO4, which we have shown arise through the reduction of bulk Fe2(MoO4)3. 1, 3 and 6 ML MoOx/Fe2O3 catalysts have been investigated under reduction with MeOH/He. Fig. 9 details the extent of reduction as a function of temperature for each of these monolayer coverages, acquired through XANES analysis. Since it was not possible to source appropriate references to perform satisfactory LCA, results were ascertained through observing the shift in edge position between Mo(VI) from the original post reduced catalyst, to Mo(IV) referenced from MoO2. Based on these results, we demonstrate an edge shift of approximately 70% towards Mo(IV) for all coverages. Further characterization through Raman and XRD analysis, was unable to establish isolated MoO2, as is the case for bulk Fe2(MoO4)3 (Fig. S8–9†).
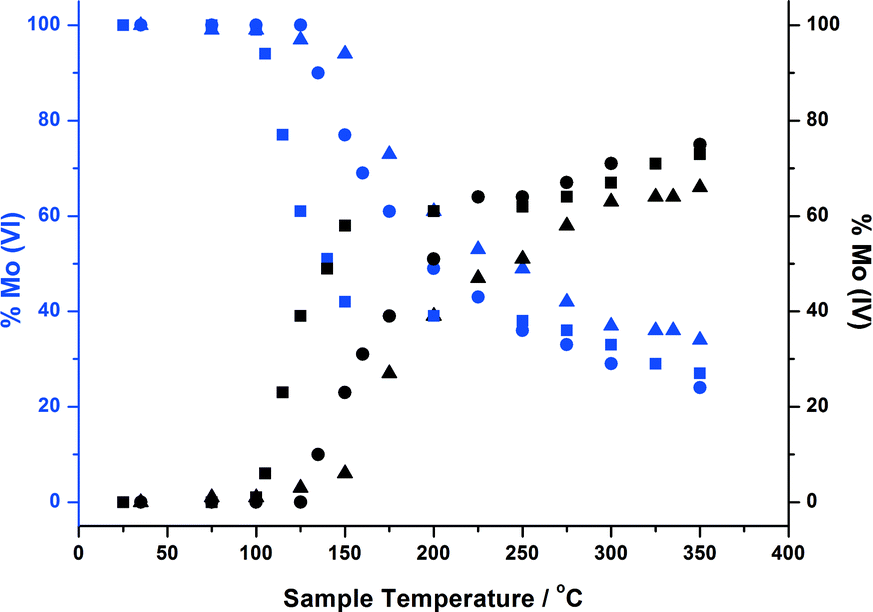 | ||
| Fig. 9 Oxidation state changes during in situ reduction of 1, 3 and 6 ML MoOx/Fe2O3 ascertained through monitoring the change in absorption edge position from Mo(VI) to Mo(IV). Reduction studies were carried out in a methanol/He flow whilst heating to 350 °C at a rate of 12 °C min−1. XAFS spectra were collected throughout (~1 min per scan). 1 ML = squares, 3 ML = circles, 6 ML = triangles. | ||
To elucidate this reduction process further, EXAFS analysis has played a key role. The end state k2-weighted Fourier transform data for the reduced samples of the 1 and 6 ML MoOx/Fe2O3 catalysts are shown in Fig. 10. Results for the 3 ML MoOx/Fe2O3 catalyst were in accordance with those seen for 6 ML MoOx/Fe2O3 (Fig. S11†), so comparisons herein will be made between the 1 and 6 ML MoOx/Fe2O3 catalysts for clarity. The obtained fits for all catalysts are comprised of 5 scattering paths; 2 Mo–O, Mo–Mo and 2 Mo–M, where MFe or Mo. Two oxygen scattering paths feature at 1.78 and 2.02 Å, indicative of reduced forms of Mo, as well as the distorted nature of the Mo octahedra. In addition to this, all monolayers have a significant contribution from Mo–Mo at 2.6 Å (Table 1). Literature indicates that this could be a bonded distance indicating a Mo5+ dimer or Mo4+ trimer.32 MoO2 also contains a Mo–Mo bonding contribution (Fig. 11), however, at a shorter distance of 2.5 Å and with a reduced average co-ordination number.33 Previous work of Kikutani et al.34 has established a 2.6 Å Mo–Mo bond in fixed dimer catalysts, as the most distinctive feature for unique dimeric active sites. The dark brown colour of the catalyst as opposed to the black colour seen for Fe2(MoO4)3 has been suggested to be due to an excitation to the energy levels of the 2.6 Å Mo–Mo bonds, a result of mixing of the energy levels in the molybdenum atoms. Simple d-electron transitions of isolated molybdenum would have a much weaker absorbance.
 | ||
| Fig. 10 Magnitude component of the k2 weighted Fourier transform for the EXAFS data of the 1 and 6 ML MoOx/Fe2O3 catalyst reduced (procedure as in Fig. 9), and the associated simulated fit performed in Artemis. | ||
| Sample | Abs-Sc | N | R/Å | 2σ2/Å2 | E f/eV |
|---|---|---|---|---|---|
| 1 ML MoOx/Fe2O3 | Mo–O | 2(2) | 1.76(5) | 0.012(1) | −1(6) |
| Mo–O | 4.0(1) | 2.02(2) | 0.003 | ||
| Mo–Mo | 1.3 | 2.68(3) | 0.007(2) | ||
| Mo–Fe | 2(2) | 3.05(6) | 0.007 | ||
| Mo–Fe | 2(1) | 3.36(2) | 0.007 | ||
| 6 ML MoOx/Fe2O3 | Mo–O | 1.5(1) | 1.78(2) | 0.007(7) | 0(2) |
| Mo–O | 3.4(3) | 2.03(1) | 0.003 | ||
| Mo–Mo | 1.3 | 2.62(2) | 0.003(1) | ||
| Mo–Mo | 2.5(1) | 2.82(2) | 0.01(1) | ||
| Mo–Mo | 4.0(2) | 3.37(2) | 0.01(1) |
 | ||
| Fig. 11 Magnitude component of the k2 weighted Fourier Transform data for MoO2 and Fe2(MoO4)3 (Sigma Aldrich). | ||
The Mo–M paths are difficult to assign with confidence due to their out of phase nature, however, obvious contribution from metal scatterers is apparent (Table 1). For the 1 ML MoOx/Fe2O3 sample, the required fit was achieved with 2 Mo–Fe contributions at 3.07 and 3.55 Å, which corresponds well with previous studies of the group, in which we demonstrate the interaction between Mo and Fe.7,26 The 3 ML MoOx/Fe2O3 and 6 ML MoOx/Fe2O3 samples are dominated by Mo–Mo contributions, with Mo–Fe distances being difficult to establish.
The EXAFS spectra support the XANES, in which we see a change of structure of the molybdena species under reduction. Fig. S12† and Table S2†, enable comparison to the original catalysts prior to reduction. In studying these ML dosed MoOx/Fe2O3 catalysts, the results are representative of the surface layers. Information obtained through EXAFS alludes to the presence of reduced clusters of Mo after reduction. The reduced molybdenum species may be considered to have molybdenum units with 2.6 Å Mo–Mo bonds, but the extent of aggregation of the Mo units is not clear. Catalytic testing and BET (Fig. S13–15 and Table S3†) have been performed to give an indication of this. TPD was performed on each of the ML MoOx/Fe2O3 catalysts post reduction, along with that of reduced Fe2O3 and reduced Fe2(MoO4)3. The spectra all show a strong resemblance to one another, all producing significant amounts of H2 and CO2 indicative of formate adsorption. In light of this, it would suggest that there is a large proportion of reduced Fe2O3 at the surface (shown to be Fe3O4 through XRD (Fig. S9†)), and therefore also significant clustering of Mo. The overall surface area of the catalysts do not change substantially after reduction (Table S3†), as expected since the catalyst composition is dominated by Fe2O3.
The significance of these Mo clusters, is that the possible dimer/trimer unit suggests a multi-centered Mo reaction site, which momentarily forms on reaction with methanol. Current research is limited with regards to the catalytic mechanisms involved in the selective dehydrogenation reaction to methanol. The majority have identified MoO sites as possible dehydrogenation centres for the mild oxidation.10,35–37 Initial steps involve dissociative adsorption of methanol to yield surface methoxy and hydroxyl species. The subsequent step, the rate-determining step, is commonly considered to be the C–H38–43 cleavage of the surface methoxy. The cleaved H will react with the adsorbed hydroxyl to yield water, and consequently the aldehyde will be lost. A study by Allison et al.32 uses ab initio quantum mechanics to examine the reaction mechanisms of methanol on MoO3. It was discovered that dioxo sites were essential for methanol activation, with the single site single step proposal unfavorable. It was concluded that the catalytic active site involves two adjacent dioxo units of MoO. Chemisorption of methoxy occurs at one of the MoO units, which then places a C–H bond in close enough proximity to one of the oxo bonds of the second dioxo unit. Cleavage of the C–H bond occurs with the second unit to yield a hydroxyl, which will likely bridge to an adjacent Mo centre. Succeeding steps involve formaldehyde desorption, with associated H2O release. Gaseous oxygen initiates surface regeneration to enable the catalyst to continually perform. The (010) surface in MoO3 has the exact configuration required for these proposed steps, whilst also possessing the lowest free energy, lying parallel to the double layers of MoO6 octahedra, forming MoO3. However, later adsorption studies have revealed that a single crystal of MoO3 favouring the (010) plane, exhibits low saturation coverage. For this reason this face has been excluded from studies. Focus has turned to studying the reaction at the edge facets and defects sites within MoO3, since here the saturation uptake of methanol correlates well with the number of active centres exposed on non-basal planes. These faces present dual acid-base sites; an unsaturated Mo cation (O–Mo–O) and an adjacent terminal MoO.36 Methanol adsorption occurs readily at these bi-functional sites. The oxygen deficient Mo acts as a Lewis acid centre, binding the methoxy,40,44 whilst the basic MoO serves to abstract a proton.
A more recent paper by Bowker et al.45 studied the behaviour of bi-cationic oxide catalysts, with specific focus on the mechanism which dominates in the selective oxidation of methanol to formaldehyde. It was discovered that on increasing the amount of Mo added to Fe2O3, the product selectivity was determined by the distribution of the dual and single sites of each species. With increased loading, the product detected transitioned from CO under single Mo sites, to formaldehyde with sufficient Mo dosed for dual site activity. This would fit appropriately with our discovered 2.6 Å Mo–Mo distance, supporting the suggestion of a 2 site adsorption centre responsible for the dehydrogenation of methanol.
Conclusions
This work has yielded crucial insights into the structural properties of MoOx/Fe2O3 catalysts and by extension to bulk Fe2(MoO4)3. The in situ XAFS investigations detail the evolution the active phase of the catalysis during the pre-catalysis activation of calcination. The activation procedure for the multi-layer systems show that the formation of the Td Fe2(MoO4)3 phase is preceded by the formation of MoO3, however, an active Oh Mo overlayer remains at all times. These MoOx/Fe2O3 systems allow us to probe how the active surface of the catalyst changes under relevant reaction conditions, when coupled with in situ XAFS measurements. Indeed, during formaldehyde production no change in Mo speciation is observed although previous studies have identified that surface oxygen is consumed in the reaction.7,26 It is therefore apparent that any removal of surface oxygen through extensive reduction of Mo, is followed by rapid re-oxidation by gas phase oxygen. To assess the nature of the Mo when surface oxygen is consumed, in situ XAFS measurements in flowing MeOH/He were performed. The reduced state of these systems indicate a significant contribution in the EXAFS data at 2.6 Å, which can be assigned to Mo4+–Mo4+ or Mo5+–Mo5+ units. From this, it can be inferred that multiple Mo sites are involved in the selective oxidation of methanol to formaldehyde.Acknowledgements
UK Catalysis Hub is kindly thanked for resources and support provided via our membership of the UK Catalysis Hub Consortium and funded by EPSRC (portfolio grants EP/K014706/1, EP/K014668/1, EP/K014854/1 and EP/K014714/1). We would like to thank the EPSRC for supporting the activities of the UK Catalysis Hub at RCaH and the grant for funding Dr P. P. Wells (Catalytic Science in the Harwell Research Centre EP/I019693/1). We would also like to thank Diamond Light Source and the Cardiff Catalysis Institute (CCI) for funding the studentship of Catherine Brookes. The authors wish to acknowledge the Diamond Light Source for provision of beamtime (SP8071). The RCaH are also acknowledged for use of facilities and support of their staff.References
- U. R. Pillai and E. Sahle-Demessie, Appl. Catal., A, 2004, 276, 139–144 CrossRef CAS.
- F. Wang and W. Ueda, Catal. Today, 2009, 144, 358–361 CrossRef CAS.
- Y. Meng, T. Wang, S. Chen, Y. Zhao, X. Ma and J. Gong, Appl. Catal., B, 2014, 160–161, 161–172 CrossRef CAS.
- K. Van Der Wiele and P. J. Van Den Berg, in Comprehensive Chemical Kinetics, ed. C. H. Bamford and C. F. H. Tipper, Elsevier, 1978, vol. 20, pp. 123–262 Search PubMed.
- J. J. Uhlrich, J. Sainio, Y. Lei, D. Edwards, R. Davies, M. Bowker, S. Shaikhutdinov and H. J. Freund, Surf. Sci., 2011, 605, 1550–1555 CrossRef CAS.
- K. Routray, W. Zhou, C. J. Kiely, W. Gruenert and I. E. Wachs, J. Catal., 2010, 275, 84–98 CrossRef CAS.
- C. Brookes, P. P. Wells, G. Cibin, N. Dimitratos, W. Jones, D. J. Morgan and M. Bowker, ACS Catal., 2014, 4, 243–250 CrossRef CAS.
- G. Jin, W. Weng, Z. Lin, N. F. Dummer, S. H. Taylor, C. J. Kiely, J. K. Bartley and G. J. Hutchings, J. Catal., 2012, 296, 55–64 CrossRef CAS.
- M. Bowker, C. Brookes, A. F. Carley, M. P. House, M. Kosif, G. Sankar, I. Wawata, P. P. Wells and P. Yaseneva, Phys. Chem. Chem. Phys., 2013, 15, 12056–12067 RSC.
- M. Bowker, R. Holroyd, M. House, R. Bracey, C. Bamroongwongdee, M. Shannon and A. Carley, Top. Catal., 2008, 48, 158–165 CrossRef CAS.
- K. H. Hassan and P. C. H. Mitchell, in Scientific Bases for the Preparation of Heterogeneous Catalysts: Proceedings of the 10th International Symposium, ed. E. M. Gaigneaux, M. Devillers, S. Hermans, P. A. Jacobs, J. A. Martens and P. Ruiz, 2010, vol. 175, pp. 475–478 Search PubMed.
- B. Ramachandra, J. S. Choi, K. Y. Choo, J. S. Sung, S. D. Song and T. H. Kim, Catal. Lett., 2005, 105, 23–27 CrossRef CAS.
- M. P. House, A. F. Carley, R. Echeverria-Valda and M. Bowker, J. Phys. Chem. C, 2008, 112, 4333–4341 CAS.
- A. P. S. Dias, F. Montemor, M. F. Portela and A. Kiennemann, J. Mol. Catal. A: Chem., 2015, 397, 93–98 CrossRef CAS.
- A. P. Vieira Soares, M. Farinha Portela and A. Kiennemann, Catal. Commun., 2001, 2, 159–164 CrossRef.
- M. P. House, A. F. Carley and M. Bowker, J. Catal., 2007, 252, 88–96 CrossRef CAS.
- N. Pernicone, Catal. Today, 1991, 11(1), 85–91 CrossRef CAS.
- M. P. House, M. D. Shannon and M. Bowker, Catal. Lett., 2008, 122, 210–213 CrossRef CAS.
- A. M. Beale, S. D. M. Jacques, E. Sacaliuc-Parvalescu, M. G. O'Brien, P. Barnes and B. M. Weckhuysen, Appl. Catal., A, 2009, 363, 143–152 CrossRef CAS.
- A. M. Beale and G. Sankar, Nucl. Instrum. Methods Phys. Res., Sect. B, 2003, 199, 504–508 CrossRef CAS.
- M. Newville, J. Synchrotron Radiat., 2001, 8, 322–324 CrossRef CAS PubMed.
- B. Ravel and M. Newville, J. Synchrotron Radiat., 2005, 12, 537–541 CrossRef CAS PubMed.
- T. Ressler, O. Timpe, T. Neisius, J. Find, G. Mestl, M. Dieterle and R. Schlogl, J. Catal., 2000, 191, 75–85 CrossRef CAS.
- M. Massa, R. Haggblad, S. Hansen and A. Andersson, Appl. Catal., A, 2011, 408, 63–72 CrossRef CAS.
- R. Radhakrishnan, C. Reed, S. T. Oyama, M. Seman, J. N. Kondo, K. Domen, Y. Ohminami and K. Asakura, J. Phys. Chem. B, 2001, 105, 8519–8530 CrossRef CAS.
- C. Brookes, P. P. Wells, N. Dimitratos, W. Jones, E. K. Gibson, D. J. Morgan, G. Cibin, C. Nicklin, D. Mora-Fonz and D. O. Scanlon, J. Phys. Chem. C, 2014, 118, 26155–26161 CAS.
- S. D. M. Jacques, O. Leynaud, D. Strusevich, A. M. Beale, G. Sankar, C. M. Martin and P. Barnes, Angew. Chem., Int. Ed., 2006, 45, 445–448 CrossRef CAS PubMed.
- M. Bowker, A. F. Carley and M. House, Catal. Lett., 2008, 120, 34–39 CrossRef CAS.
- M. O'Brien, A. Beale, S. M. Jacques and B. Weckhuysen, Top. Catal., 2009, 52, 1400–1409 CrossRef.
- A. P. V. Soares, M. F. Portela and A. Kiennemann, Catal. Rev.: Sci. Eng., 2005, 47, 125–174 CAS.
- H. Zhang, J. Shen and X. Ge, J. Solid State Chem., 1995, 117, 127–135 CrossRef CAS.
- J. N. Allison and W. A. Goddard Iii, J. Catal., 1985, 92, 127–135 CrossRef CAS.
- T. Ressler, J. Wienold and R. E. Jentoft, Solid State Ionics, 2001, 141–142, 243–251 CrossRef CAS.
- Y. Kikutani, J. Mol. Catal. A: Chem., 1999, 142, 247–263 CrossRef CAS.
- J. M. Tatibouët and J. E. Germain, J. Catal., 1981, 72, 375–378 CrossRef.
- J. M. Tatibouet, Appl. Catal., A, 1997, 148, 213–252 CrossRef.
- M. G. O'Brien, A. M. Beale, S. D. M. Jacques, T. Buslaps, V. Honkimaki and B. M. Weckhuysen, J. Phys. Chem. C, 2009, 113, 4890–4897 Search PubMed.
- R. L. Smith and G. S. Rohrer, J. Catal., 1998, 180, 270–278 CrossRef CAS.
- A. Goodrow and A. T. Bell, J. Phys. Chem. C, 2008, 112, 13204–13214 CAS.
- W. L. Holstein and C. J. Machiels, J. Catal., 1996, 162, 118–124 CrossRef CAS.
- W. E. Farneth, F. Ohuchi, R. H. Staley, U. Chowdhry and A. W. Sleight, J. Phys. Chem. C, 1985, 89, 2493–2497 CrossRef CAS.
- J. S. Chung, R. Miranda and C. O. Bennett, J. Catal., 1988, 114, 398–410 CrossRef CAS.
- E. M. McCarron and A. W. Sleight, Polyhedron, 1986, 5, 129–139 CrossRef CAS.
- N. Pernicone, F. Lazzerin, G. Liberti and G. Lanzavecchia, J. Catal., 1969, 14, 293–302 CrossRef CAS.
- A. A. M. Bowker, C. Brookes, E. Gibson, M. House and P. Wells, Catal. Struct. React., 2015, 1, 95–100 CrossRef.
Footnote |
| † Electronic supplementary information (ESI) available. See DOI: 10.1039/c5cy01175b |
| This journal is © The Royal Society of Chemistry 2016 |