 Open Access Article
Towards efficient catalysts for the oxidative dehydrogenation of propane in the presence of CO2: Cr/SiO2 systems prepared by direct hydrothermal synthesis†
M. A.
Botavina
a,
Yu. A.
Agafonov
b,
N. A.
Gaidai
b,
E.
Groppo
a,
V.
Cortés Corberán
c,
A. L.
Lapidus
b and
G.
Martra
*a
aDepartment of Chemistry and “Nanostructured Interfaces and Surfaces – NIS” Interdepartmental Centre, Torino, University of Torino,
via P.Giuria, 7, 10125, Italy. E-mail: gianmario.martra@unito.it; Fax: +39 011 6707855; Tel: +39 011 6707538
bN.D. Zelinsky Institute of Organic Chemistry, Russ. Acad. Sci., Leninskii pr, 47, 117991 Moscow, Russia
cInstitute of Catalysis and Petroleum Chemistry, CSIC, Calle Marie Curie 2, 28049 Madrid, Spain
First published on 25th August 2015
Abstract
Cr/SiO2 catalysts (Cr loading in the 0.25–2.0 wt% range) have been prepared by direct hydrothermal synthesis in the presence of templating agents, in order to attain porous systems with high specific surface area (in the 600–1000 m2 g−1 range), and then characterized and tested in the oxidative dehydrogenation of propane in the presence of CO2 or CO2 + O2 as an oxidant. The extent and regularity of mesopores decreased significantly by increasing the Cr content (X-ray diffraction, N2 adsorption, transmission electron microscopy), but this did not limit the catalytic performances of the catalysts with higher Cr loadings. In all cases, the only chromium species found were surface chromates (diffuse reflectance electronic spectroscopy and X-ray absorption near edge spectroscopy), accompanied by Brønsted acid centres (infrared spectra of adsorbed NH3). All catalysts appeared stable towards irreversible deactivation, even after ca. 900 min of testing, and propene yields as high as 40% were attained. The combination of spectroscopic and catalytic results allowed us to rationalize, at least in part, the role of different oxidants in defining the chromium oxidation state, and a tentative correlation of the oxidation state of Cr species during the reaction (Cr2+/Cr3+) with selectivity to propene is suggested.
1. Introduction
Propene (C3H6) is among the foundation feedstocks for large volume commodities and specialty chemicals, such as cumene, acrylonitrile, propylene oxide and high-purity polypropylene, and its demand is expected to increase significantly in the near future.1 At present, its industrial production is based on non-oxidative processing of petroleum-based materials, via steam cracking, fluid catalytic cracking and catalytic dehydrogenation.2 As far as catalytic dehydrogenation is concerned, commercial processes use Cr2O3/Al2O3 (18–20 Cr wt%, Catofin process) or Pt (<1 wt%), Sn (1–2 wt%)/Al2O3 (Oleflex process).3 Possible replacements with lower costs and sustainable alternatives have received increasing interest for many years, and the oxidative dehydrogenation (ODH) of propane appeared to be among the most promising, because of the higher energy efficiency (ODH is exothermic, while dehydrogenation and cracking are endothermic processes) and process simplicity. A review on the catalysts for propane ODH was compiled by Cavani et al. in 2007,2 who considered the performances of almost 100 catalysts, with different active phases, in ODH of propane with O2 as the oxidant, reported in the literature over the period 2000–2006, and concluded that the best propylene yields resulting from propane ODH (ca. 30%) were still far from being interesting for industrial implementation, and the information concerning the catalyst lifetime appeared quite limited. Moreover, in that review, the set-up of catalytic materials and/or reactor configurations capable of maintaining high selectivity to propylene under conditions leading to high propane conversion was addressed as the main direction for future development. Later on, an initial yield of C3H6 as high as ca. 47%, decreasing to ca. 33% after 8 h on-stream, was reported for propane dehydrogenation over GaOx-based catalysts.4 More recently, the kinetics for the ODH of C3H8 on VOx catalysts was reviewed by Carrero et al., and for the systems considered, the combination of reported conversions and selectivities resulted in yields of C3H6 not exceeding 30%.5 Conversely, Ovsitser et al. reported the attainment of a propene yield of ca. 40% for the oxidative dehydrogenation of C3H8 under O2 lean conditions over VOx/SiO2 catalysts, even at a quite long reaction time.6 Similar results were obtained by these authors for the oxidative dehydrogenation of iso-C4H10 to iso-C4H8.7In this respect, the attainment of high selectivity to olefins via ODH of alkanes is basically limited, from a chemical point of view, by the use of O2 as an oxidant, because of the occurrence of over-oxidation to carbon oxides of both feed paraffins and produced olefins. On such a basis, the use of CO2 as a mild oxidant has attracted attention after its successful use in other partial oxidation reactions such as dry reforming8,9 and oxidative coupling of methane.10,11 Although ODH of propane in the presence of CO2 is an endothermic process (ΔH298K = +166.6 kJ mol−1), the addition of a small amount of oxygen can turn this process into an exothermic one, and additional positive effects on catalyst coking might be expected.
Among the heterogeneous catalysts tested in processes involving CO2 as an oxidant, materials based on chromium supported on silica exhibited the most promising performance.12–19 Thus, in a previous study, we investigated the performances of a series of CrOx/SiO2 catalysts in the ODH of propane carried out in a regime of high conversion (≥40%), similar to that required in industrial processes.20 Satisfactory results were obtained for the material with a 5.00 wt% chromium loading that, however, suffered an irreversible deactivation due to the agglomeration of surface chromium species. To overcome this problem, we turned our interest towards the dispersion of chromium species on high specific surface area silicas, typically of the mesoporous type, via a direct hydrothermal synthesis (DHS) in the presence of structure directing agents, as reported in the literature.18,19,21–28 Wang et al.18 provided evidence for the resistance to irreversible deactivation of Cr/MCM-41 catalysts (3.4 wt% Cr) during the ODH of C3H8 with O2, in which under the reaction conditions, a maximum C3H8 conversion of ca. 30% and a propene yield of 26% were obtained, and the stability of the catalyst was monitored for a period not longer than 300 min.
Here, we report the results of physical–chemical characterization and catalytic testing of a series of Cr/SiO2 materials prepared by DHS (Cr loadings in the 0.25–2.00 wt% range) targeting ODH conditions (using both CO2 and a CO2 + O2 mixture as oxidants) as closest as possible to industrial applications.
2. Experimental
2.1. Catalyst preparation and treatments
The investigated materials were prepared by direct hydrothermal synthesis, following the protocol usually employed to obtain mesoporous structures of the MCM-41 type.18 Cetyltrimethylammonium bromide (Sigma-Aldrich), pure fumed silica (Aerosil 300, Degussa) and chromium nitrate (Sigma-Aldrich) were used as structure directing agent, silica and chromium source, respectively. Tetramethylammonium hydroxide (Sigma-Aldrich) was used to maintain a pH of ca. 11.0. The relative amount of Cr(NO3)3 varied among the series of preparations, in order to attain chromium loadings ranging from 0.25 to 2.00 wt%. For the sake of comparison, bare MCM-41 silica was also prepared. Moreover catalysts with Cr loadings of 3.00 and 5.50 wt% were prepared. However, in the preliminary tests they exhibited a slightly lower catalytic activity than the catalyst with 2.00 wt% Cr content (see ESI,† Fig. S1), and thus they were no longer considered. The synthesis gels were stirred at 308 K (water bath) for 2 h, transferred into a Teflon-lined autoclave and kept at 373 K for 48 h. The obtained powder/liquid mixtures were filtered at room temperature and carefully washed with distilled water (three doses of 50 mL). The samples were then dried at 373 K and placed in a gas-flow furnace, where the temperature was raised to 873 K (heating rate: 2 K min−1) under flowing N2 (1 atm, 2 L min−1). The flow was then switched to O2 (1 atm, 2 L min−1) for calcination for 8 h. The final cooling to room temperature occurred under O2 flow. The codes, chromium content and textural features of the various catalysts are listed in Table 1.| Entry | Catalyst | Cr loading (wt%) | Specific surface area (m2 g−1) | Specific Cr loading (at.Cr nm−2) | Total pore volume (cm3 g−1) | 2–3 nm pore volume (cm3 g−1) | Pore diameter (nm) | Wall thickness (nm) |
|---|---|---|---|---|---|---|---|---|
| a Coked sample. | ||||||||
| 1 | MCM-41 | — | 1273 | — | 0.79 | 0.74 | 2.5 | 0.19 |
| 2 | 0.25-Cr/DHS | 0.25 | 960 | 0.03 | 0.56 | 0.50 | 2.6 | 0.15 |
| 3 | 0.5-Cr/DHS | 0.5 | 957 | 0.06 | 0.61 | 0.50 | 2.7 | 0.13 |
| 4 | 1.0-Cr/DHS | 1.0 | 910 | 0.14 | 0.55 | 0.42 | 2.8 | — |
| 5 | 2.0-Cr/DHS | 2.0 | 663 | 0.35 | 0.41 | 0.29 | 2.9 | — |
| 6a | 2.0-Cr/DHSc | 2.0 | 493 | 0.35 | 0.22 | 0.11 | 2.4 | — |
For characterization, fresh catalysts underwent the following treatments:
i) Dehydration/dehydroxylation, keeping chromium in the +6 oxidation state: the materials were re-calcined at 873 K (2 h) and subsequently cooled down to r.t. under dry O2 (1 atm, 2 L min−1). Samples treated in such a way will be hereafter referred to as “dehydr/ox”. This treatment was also carried out on aliquots of used catalysts (regenerated as reported at the end of section 2.3, “Catalytic tests”) which were analysed by DR UV-Vis-NIR spectroscopy.
ii) Reduction of surface chromium species: a typical protocol for the conversion of Cr6+ into Cr2+ was followed.29 Hence, samples were calcined in O2 (100 Torr) at 873 K for 1 h, cooled (in O2) to 623 K, then treated in CO (40 Torr) and outgassed at the same temperature (30 min each step) and finally cooled to room temperature. The treatment in CO was repeated three times, with intermediate outgassing. Samples treated in such a way will be hereafter referred to as “dehydr/red”.
Moreover, a catalyst, the 1.0-Cr/DHS one, was treated in situ in the cell used for XANES measurements in the presence of various reaction mixtures. The selection of this catalyst, a representative of the series of materials tested (see below), is based on the sample availability and Cr content high enough to obtain XANES spectra with a satisfactory signal-to-noise ratio in the presence of carbonaceous deposits, resulting in a further dilution of Cr content. For these measurements, the catalyst was activated at 873 K (2 h) in static O2 (100 Torr) and then exposed to different reaction mixtures (40 Torr): C3H8![[thin space (1/6-em)]](https://www.rsc.org/images/entities/char_2009.gif) :
:![[thin space (1/6-em)]](https://www.rsc.org/images/entities/char_2009.gif) N2 = 15
N2 = 15![[thin space (1/6-em)]](https://www.rsc.org/images/entities/char_2009.gif) :
:![[thin space (1/6-em)]](https://www.rsc.org/images/entities/char_2009.gif) 85, C3H8
85, C3H8![[thin space (1/6-em)]](https://www.rsc.org/images/entities/char_2009.gif) :
:![[thin space (1/6-em)]](https://www.rsc.org/images/entities/char_2009.gif) CO2
CO2![[thin space (1/6-em)]](https://www.rsc.org/images/entities/char_2009.gif) :
:![[thin space (1/6-em)]](https://www.rsc.org/images/entities/char_2009.gif) N2 = 15
N2 = 15![[thin space (1/6-em)]](https://www.rsc.org/images/entities/char_2009.gif) :
:![[thin space (1/6-em)]](https://www.rsc.org/images/entities/char_2009.gif) 30
30![[thin space (1/6-em)]](https://www.rsc.org/images/entities/char_2009.gif) :
:![[thin space (1/6-em)]](https://www.rsc.org/images/entities/char_2009.gif) 55, C3H8
55, C3H8![[thin space (1/6-em)]](https://www.rsc.org/images/entities/char_2009.gif) :
:![[thin space (1/6-em)]](https://www.rsc.org/images/entities/char_2009.gif) O2
O2![[thin space (1/6-em)]](https://www.rsc.org/images/entities/char_2009.gif) :
:![[thin space (1/6-em)]](https://www.rsc.org/images/entities/char_2009.gif) N2 = 15
N2 = 15![[thin space (1/6-em)]](https://www.rsc.org/images/entities/char_2009.gif) :
:![[thin space (1/6-em)]](https://www.rsc.org/images/entities/char_2009.gif) 3
3![[thin space (1/6-em)]](https://www.rsc.org/images/entities/char_2009.gif) :
:![[thin space (1/6-em)]](https://www.rsc.org/images/entities/char_2009.gif) 82, and C3H8
82, and C3H8![[thin space (1/6-em)]](https://www.rsc.org/images/entities/char_2009.gif) :
:![[thin space (1/6-em)]](https://www.rsc.org/images/entities/char_2009.gif) CO2
CO2![[thin space (1/6-em)]](https://www.rsc.org/images/entities/char_2009.gif) :
:![[thin space (1/6-em)]](https://www.rsc.org/images/entities/char_2009.gif) O2
O2![[thin space (1/6-em)]](https://www.rsc.org/images/entities/char_2009.gif) :
:![[thin space (1/6-em)]](https://www.rsc.org/images/entities/char_2009.gif) N2 = 15
N2 = 15![[thin space (1/6-em)]](https://www.rsc.org/images/entities/char_2009.gif) :
:![[thin space (1/6-em)]](https://www.rsc.org/images/entities/char_2009.gif) 30
30![[thin space (1/6-em)]](https://www.rsc.org/images/entities/char_2009.gif) :
:![[thin space (1/6-em)]](https://www.rsc.org/images/entities/char_2009.gif) 3
3![[thin space (1/6-em)]](https://www.rsc.org/images/entities/char_2009.gif) :
:![[thin space (1/6-em)]](https://www.rsc.org/images/entities/char_2009.gif) 52 at 873 K for 2 h.
52 at 873 K for 2 h.
2.2. Characterization methods
X-ray diffraction (XRD) patterns were collected using a Philips PW 1850 powder diffractometer (Co Kα radiation, 40 kV with 20 mA current) and indexed by using Philips X'pert High score software.Specific surface areas (SSA) were measured with a Micromeritics ASAP 2010 by nitrogen adsorption at 77 K using the BET model for data analysis, while pore volume and size were calculated by using the BJH model (adsorption branch). Before measurements, all samples were outgassed at 473 K to a residual pressure of 1.0 × 10⁻⁴ Torr (1 Torr = 133.33 Pa).
Observations and chemical analysis of the samples by transmission electron microscopy coupled with energy dispersive X-ray spectroscopy (TEM-EDS) were performed with a JEOL 3010-UHR instrument (acceleration potential of 300 kV) equipped with an Oxford Inca Energy TEM 200 EDS X-ray analyzer. To obtain a good dispersion on the sample holder and avoid any contamination, Lacey carbon Cu grids were briefly brought into contact with the powders, resulting in the adhesion of some particles to the sample holders by electrostatic interactions. Quantitative compositional studies were carried out using the Oxford INCA Microanalysis Suite software. The mean composition resulted from the average of 7 measurements in different regions. The Cr Kα emission at 5.4 keV was selected for EDS mapping of this element.
Diffuse reflectance (DR) UV-Vis-NIR spectroscopy measurements were performed with a VARIAN Cary 5000 UV-Vis-NIR spectrophotometer, equipped with an integrating sphere coated with Spectralon®. The powders (gently ground in an agate mortar to disrupt agglomerates) were placed in a flow reactor with a side branch equipped with an optical quartz window, where the powders were transferred for spectroscopic measurements. The spectra, initially collected in reflectance mode, were converted to the Kubelka–Munk (K–M) function. To avoid exceeding the limit of validity of such a function (K–M values ≤1), all samples were diluted with the bare MCM-41 silica (ground in a similar way) in a 1![[thin space (1/6-em)]](https://www.rsc.org/images/entities/char_2009.gif) :
:![[thin space (1/6-em)]](https://www.rsc.org/images/entities/char_2009.gif) 7 ratio by weight. UV-Vis spectroscopy was also employed in transmission mode for checking the possible presence of chromium in the filtrate when the catalysts were recovered from the powder/liquid synthesis mixtures.
7 ratio by weight. UV-Vis spectroscopy was also employed in transmission mode for checking the possible presence of chromium in the filtrate when the catalysts were recovered from the powder/liquid synthesis mixtures.
X-ray absorption spectroscopy (XAS) measurements at the Cr K-edge (5989 eV) were performed at the BM23 beamline of the European Synchrotron Radiation Facility (ESRF, Grenoble, France). The white beam was monochromatized using a Si(111) double crystal. Harmonic rejection was performed by using silicon mirrors. Due to Cr dilution, XAS spectra were collected in fluorescence mode, by means of a Vortex detector. The intensity of the incident beam was monitored by using an ionization chamber filled with 1 bar of 20% N2–80% He. The beam transmitted through the sample passed further through a second ionization chamber, a Cr foil and a third ionization chamber to ensure the correct energy calibration for any acquisition. The samples were measured in the form of pressed pellets inside the cryostat available on BM23, which is small enough to fit in a glove box. Pellets of the samples treated under different conditions were analyzed directly inside the glove box and transferred in the cryostat. Measurements were performed close to liquid He temperature and in dynamic vacuum (pressure lower than 1.0 × 10⁻⁶ Torr, 1 Torr = 133.33 Pa) in order to avoid contamination of the samples. XANES spectra were acquired with an energy step of 0.4 eV and an integration time of 2 s per point.
Infrared spectra were collected using a Bruker IFS 28 spectrometer (MCT detector; resolution: 4 cm−1). The samples were pressed into self-supported pellets and placed in a quartz cell with KBr windows that, once connected to conventional vacuum lines (residual pressure lower than 1.0 × 10⁻⁵ Torr), allowed all thermal treatments and adsorption/desorption experiments of ammonia to be carried out in situ. Before IR measurements, the samples were subjected to treatment (i) of the previous section (dehydrated and oxidized states). The spectra of adsorbed NH3 were reported in absorbance mode, having subtracted the spectra of the samples before adsorption as a background. High purity ammonia (Praxair) was used, without any further purification except water trapping at ca. 243 K (cooling medium: solid/liquid ethanol).
Thermogravimetric analyses (TGA) were carried out with a TAQ 600 TGA instrument. Samples were heated at a rate of 20 K min−1 from room temperature to 1073 K under air flow (6 L h−1).
2.3. Catalytic tests
Catalytic tests were carried out in a flow reactor, under atmospheric pressure. All the tests were conducted at 873 K since non-catalytic conversion of C3H6 can occur to a slight extent only at T ≥ 923 K, as reported in previous work.20 A volume space velocity (w) of 200 h−1 was adopted to obtain a high propane conversion.The feed composition was C3H8![[thin space (1/6-em)]](https://www.rsc.org/images/entities/char_2009.gif) :
:![[thin space (1/6-em)]](https://www.rsc.org/images/entities/char_2009.gif) CO2
CO2![[thin space (1/6-em)]](https://www.rsc.org/images/entities/char_2009.gif) :
:![[thin space (1/6-em)]](https://www.rsc.org/images/entities/char_2009.gif) N2 = 15
N2 = 15![[thin space (1/6-em)]](https://www.rsc.org/images/entities/char_2009.gif) :
:![[thin space (1/6-em)]](https://www.rsc.org/images/entities/char_2009.gif) 30
30![[thin space (1/6-em)]](https://www.rsc.org/images/entities/char_2009.gif) :
:![[thin space (1/6-em)]](https://www.rsc.org/images/entities/char_2009.gif) 55 or C3H8
55 or C3H8![[thin space (1/6-em)]](https://www.rsc.org/images/entities/char_2009.gif) :
:![[thin space (1/6-em)]](https://www.rsc.org/images/entities/char_2009.gif) CO2
CO2![[thin space (1/6-em)]](https://www.rsc.org/images/entities/char_2009.gif) :
:![[thin space (1/6-em)]](https://www.rsc.org/images/entities/char_2009.gif) O2
O2![[thin space (1/6-em)]](https://www.rsc.org/images/entities/char_2009.gif) :
:![[thin space (1/6-em)]](https://www.rsc.org/images/entities/char_2009.gif) N2 = 15
N2 = 15![[thin space (1/6-em)]](https://www.rsc.org/images/entities/char_2009.gif) :
:![[thin space (1/6-em)]](https://www.rsc.org/images/entities/char_2009.gif) 30
30![[thin space (1/6-em)]](https://www.rsc.org/images/entities/char_2009.gif) :
:![[thin space (1/6-em)]](https://www.rsc.org/images/entities/char_2009.gif) 3
3![[thin space (1/6-em)]](https://www.rsc.org/images/entities/char_2009.gif) :
:![[thin space (1/6-em)]](https://www.rsc.org/images/entities/char_2009.gif) 52 (in mol%). The initial partial pressures were P0C3H8 = 0.15 atm and P0CO2 = 0.30 atm (1 atm = 101.33 kPa); the relative amount of O2 used in the second case was the same as that in our previous work devoted to catalysts prepared by wet impregnation.20 Prior to the tests, all catalysts were activated under air flow at T = 873 K (heating rate: 10 K min−1) for at least 1 h. The reaction products were analyzed by GC methods (instrumental error: ±4%) using two columns: molecular sieve 5A (H2, O2, N2, CH4, CO,) and Porapak Q (CO2, H2O, hydrocarbons). The first analyses, providing data assumed as initial conversion and selectivity, were carried out after 20 min of reaction. After each run, the catalysts were treated under air flow at T = 873 K (heating rate: 10 K min−1) for 6 h, and then tested in the next run. The yield and selectivity values were calculated on the basis of the concentrations of the gas phase components. The formulae used for the calculation of conversion, selectivity and yield are reported in the ESI.†
52 (in mol%). The initial partial pressures were P0C3H8 = 0.15 atm and P0CO2 = 0.30 atm (1 atm = 101.33 kPa); the relative amount of O2 used in the second case was the same as that in our previous work devoted to catalysts prepared by wet impregnation.20 Prior to the tests, all catalysts were activated under air flow at T = 873 K (heating rate: 10 K min−1) for at least 1 h. The reaction products were analyzed by GC methods (instrumental error: ±4%) using two columns: molecular sieve 5A (H2, O2, N2, CH4, CO,) and Porapak Q (CO2, H2O, hydrocarbons). The first analyses, providing data assumed as initial conversion and selectivity, were carried out after 20 min of reaction. After each run, the catalysts were treated under air flow at T = 873 K (heating rate: 10 K min−1) for 6 h, and then tested in the next run. The yield and selectivity values were calculated on the basis of the concentrations of the gas phase components. The formulae used for the calculation of conversion, selectivity and yield are reported in the ESI.†
3. Results and discussion
3.1. Composition, structural and textural features of the catalysts
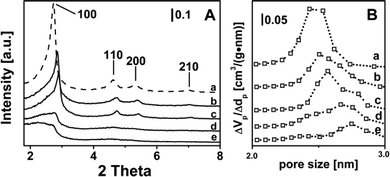
At the end of the syntheses in the autoclave, no chromium was found in the aqueous phases separated by filtration (analyzed by UV-Vis spectroscopy), indicating that the actual Cr content of the catalysts corresponded to the nominal one (Table 1, column 3).XRD patterns (Fig. 1A) typical of regular mesoporous structures of the MCM-41 type, exhibiting 100, 110 and 200 diffraction peaks, were obtained for the bare silica reference material (curve a) and, with some decrease in intensity, for catalysts with Cr loading ≤0.5 wt% (curves b and c). Furthermore, in the latter two cases the presence of chromium resulted in a shift of the (100) peak to larger angles, due to a decrease in the pore wall thickness (Table 1, last column). Higher Cr loading resulted in an almost complete decomposition of the MCM-41 structure, and only traces were still present for 2.0-Cr/DHS (Fig. 1, curves d and e). Such a trend is in agreement with literature data, although the persistence of the MCM-41 mesoporous structure for a Cr content of ca. 1.0 wt%18,27,30 and, by keeping the nascent materials under autogenous pressure at ca. 373 K for 8 days, also for a Cr content of 6.0 wt% was reported.25
The loss of the ordered mesoporous structure resulted in a decrease in SSA, of the order of ca. 24–30% for a Cr content up to 1 wt%, and of ca. 50% for 2.0-Cr/DHS. As a consequence, the theoretical surface dispersion of Cr ions increased to more than 10 times passing from 0.03 (for 0.25-Cr/DHS) to 0.35 at.Cr nm−2 (2.0-Cr/DHS), which, nevertheless, is still a quite low surface density (Table 1, column 5). As expected, the decrease in SSA was accompanied by a significant decrease in porosity (Table 1, columns 4 and 6, respectively). It is worth noting that the mesopore size distribution (Fig. 1B) evolved from monomodal for the bare MCM-41 silica (centered at ca. 2.5 nm, curve a) to bimodal for Cr loadings up to 1.0 wt% (curves b–d), becoming again monomodal for 2.0-Cr/DHS (curve e), but with a larger mean pore size (centered at 2.7 nm). At the same time for all Cr loadings, some larger pores (up to 100 nm) were detected, likely due to an interparticle porosity associated with the presence of a disordered mesoporous silica phase (will be discussed below).
Such textural evolution was accompanied by parallel changes in the structure and morphology observed by TEM. All materials, including the bare MCM-41 silica, appeared to be constituted by two types of particles, namely large grains with a regular porous structure (Fig. 2A) and aggregates of small particles, a fraction of which still exhibits randomly arranged mesopores (Fig. 2B). Grains of the first type were predominant for bare silica, 0.25-Cr/DHS and 0.5-Cr/DHS, i.e. the materials exhibiting a typical MCM-41 XRD pattern, whereas the disordered phase prevailed by far for the remaining 1.0-Cr/DHS and 2.0-Cr/DHS catalysts.
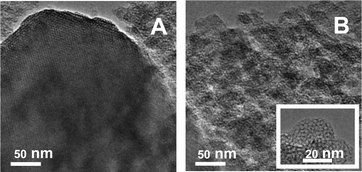 | ||
| Fig. 2 TEM images of 2.00-Cr/DHS, representative of the size and morphology of the ordered (panel A) and disordered (panel B) porous phases observed in all samples. | ||
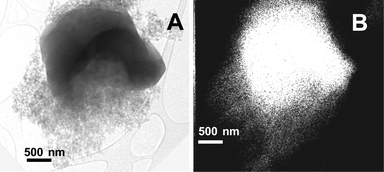
Mapping of the location of Cr was carried out by EDS, and the contours of the obtained maps appeared almost coincident with the borders of the particle aggregates, observed in the corresponding TEM images, independent of the ordered or disordered porous structure (Fig. 3). Nevertheless, the Cr loading measured by EDS on regions with an MCM-41 pore structure was, on average, slightly higher than for those with a disordered arrangement of pores (e.g. 2.5 ± 0.5 wt% and 2.0 ± 0.7 wt%, respectively, in the case of 2.0-Cr/DHS).
XRD, volumetric and TEM/EDS measurements were repeated for the catalysts regenerated after the first catalytic run, and essentially the same results were obtained (see ESI,† Table S1 and Fig. S2), demonstrating that neither the textural properties nor the Cr distribution changed during the catalytic reaction.
3.2. Nature and structure of supported Cr species
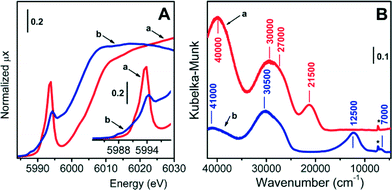
The oxidation and coordination states as well as the speciation and accessibility of supported chromium species in the whole series of Cr/DHS catalysts were evaluated by DR UV-Vis-NIR spectroscopy and, for the 0.5-Cr/DHS catalyst, also by XANES. The results obtained with both methods on this latter sample are shown in Fig. 4 and discussed below, while the electronic spectra of the full series of catalysts are reported in Fig. S4 and S5 in the ESI.†The XANES spectrum of the dehydr/ox 0.5-Cr/DHS sample (Fig. 4A, curve a) is very similar to those reported in the literature for analogous Cr6+/SiO2 catalysts, employed for both propane ODH reactions16,18 and ethylene polymerization (Phillips catalyst).31–36 In particular: i) the edge value, evaluated at the maximum of the derivative curve, is at 6007 eV (i.e. ca. 17 eV lower than that of Cr foil, consistent with the XANES spectra of Cr6+ compounds); ii) the intense pre-edge peak centered at 5994 eV (normalized intensity = 0.74, FWHM = 2.1 eV) is characteristic of Cr6+ species in a nearly perfect tetrahedral symmetry and assigned to the transition of the excited 1s electron to the hybrid p–d orbitals of Cr.24,31–37
The corresponding DR UV-Vis-NIR spectrum (Fig. 4B, curve a) exhibits three main components, at ca. 40![[thin space (1/6-em)]](https://www.rsc.org/images/entities/char_2009.gif) 000, 30
000, 30![[thin space (1/6-em)]](https://www.rsc.org/images/entities/char_2009.gif) 000 (with a shoulder at 27
000 (with a shoulder at 27![[thin space (1/6-em)]](https://www.rsc.org/images/entities/char_2009.gif) 000) and 21
000) and 21![[thin space (1/6-em)]](https://www.rsc.org/images/entities/char_2009.gif) 500 cm−1.
500 cm−1.
On the basis of the works of Weckhuysen et al.,36–40 these could be attributed to ligand-to-metal charge transfer transitions from oxygen to Cr6+ in surface chromate species, ranging from monochromates to polychromates. The two bands at ca. 21![[thin space (1/6-em)]](https://www.rsc.org/images/entities/char_2009.gif) 500 and 40
500 and 40![[thin space (1/6-em)]](https://www.rsc.org/images/entities/char_2009.gif) 000 cm−1 are not structured enough to recognize specific sub-bands due to chromate species with a different speciation, whilst the components at ca. 27
000 cm−1 are not structured enough to recognize specific sub-bands due to chromate species with a different speciation, whilst the components at ca. 27![[thin space (1/6-em)]](https://www.rsc.org/images/entities/char_2009.gif) 000 cm−1 and 30
000 cm−1 and 30![[thin space (1/6-em)]](https://www.rsc.org/images/entities/char_2009.gif) 000 cm−1 can be attributed to monochromates and di- and/or polychromates, respectively. However, the possibility that these two components might be both due to monochromate species with different local structures cannot be ruled out.39 As for polychromates, if present, they should account for a minor part of the spectrum, because the high SSA should have favoured a high dispersion of Cr species during the synthesis. Furthermore, their relative amount is expected to increase by increasing the Cr content; conversely, all bands present in the spectrum exhibited a proportional increase in intensity ranging along the whole series of catalysts (see Fig. S3 in the ESI†). It is worth noticing that the band at 21
000 cm−1 can be attributed to monochromates and di- and/or polychromates, respectively. However, the possibility that these two components might be both due to monochromate species with different local structures cannot be ruled out.39 As for polychromates, if present, they should account for a minor part of the spectrum, because the high SSA should have favoured a high dispersion of Cr species during the synthesis. Furthermore, their relative amount is expected to increase by increasing the Cr content; conversely, all bands present in the spectrum exhibited a proportional increase in intensity ranging along the whole series of catalysts (see Fig. S3 in the ESI†). It is worth noticing that the band at 21![[thin space (1/6-em)]](https://www.rsc.org/images/entities/char_2009.gif) 500 cm−1 is attributed to an oxygen-to-chromium CT transition involving the double bonded oxygen ligands of chromates; its low wavenumber position makes this band a valuable fingerprint of the presence of chromates.
500 cm−1 is attributed to an oxygen-to-chromium CT transition involving the double bonded oxygen ligands of chromates; its low wavenumber position makes this band a valuable fingerprint of the presence of chromates.
The possibility that some chromium species were embedded into the silica matrix during the synthesis, and thus not available for the catalytic reaction, should not be excluded a priori. For this reason, catalysts underwent a thermal treatment in the presence of CO (see the Experimental section), in which all chromium species actually exposed at the surface were expected to convert to Cr2+, leaving those embedded within the silica framework untouched, if any. The XANES spectrum of 0.5-Cr/DHS treated in such a way (Fig. 4A, curve b) appeared then very similar to that reported in the literature for a Cr2+/SiO2 Phillips catalyst having the same Cr loading.34,36,41,42 In particular: i) the edge is downward shifted (6002 eV) with respect to the oxidized sample, confirming that the treatment in CO caused a reduction of Cr6+ sites; ii) two weak pre-edge features are observed at 5988 and 5990 eV, due to Cr1s → (Cr3d + O2p) dipole-forbidden transitions;31,41,42 iii) an intense and well-resolved pre-edge peak is observed at 5994.2 eV, assigned to a Cr1s → Cr4p transition and considered the fingerprint of isolated Cr2+ sites.31,41,42 Hence, in the following the XANES spectrum of 0.5-Cr/DHS treated in CO at 623 K will be considered as representative of isolated, highly uncoordinated, Cr2+ sites. Accordingly, the corresponding DR UV-Vis-NIR spectrum (Fig. 4B, curve b) no longer contains any trace of the band at 21![[thin space (1/6-em)]](https://www.rsc.org/images/entities/char_2009.gif) 500 cm−1 characteristic of chromate species. The spectrum is dominated by intense bands at ca. 41
500 cm−1 characteristic of chromate species. The spectrum is dominated by intense bands at ca. 41![[thin space (1/6-em)]](https://www.rsc.org/images/entities/char_2009.gif) 000 and 30
000 and 30![[thin space (1/6-em)]](https://www.rsc.org/images/entities/char_2009.gif) 500 cm−1, due to O2− → Cr2+ charge transfer transitions,29,34,40 and shows two very weak signals at ca. 12
500 cm−1, due to O2− → Cr2+ charge transfer transitions,29,34,40 and shows two very weak signals at ca. 12![[thin space (1/6-em)]](https://www.rsc.org/images/entities/char_2009.gif) 500 and 7000 cm−1, due to Cr2+ d–d transitions typical for Cr2+ ions in (pseudo)tetrahedral coordination.34,41
500 and 7000 cm−1, due to Cr2+ d–d transitions typical for Cr2+ ions in (pseudo)tetrahedral coordination.34,41
The same evolution occurred for the DR UV-Vis-NIR spectra of all other samples (Fig. S4 in the ESI†). In summary, XANES and DR UV-Vis-NIR data provided evidence that all the Cr/DHS catalysts contained well-dispersed and fully accessible Cr species, which can contribute to the functional behaviour of the catalysts.
3.3. Brønsted and Lewis surface acidity
The assessment of the presence of Brønsted acid sites is of interest in the elucidation of the surface properties of catalysts used for paraffin dehydrogenation, because such centres can promote the transformation of the produced olefins in carbonaceous species,43 finally responsible for reversible deactivation by coking.The IR spectra of NH3 dosed onto the dehydr/ox catalysts were then recorded. The whole set of data is reported in Fig. S5 in the ESI,† while here, only the result of their quantitative analysis is reported, for the sake of brevity. Briefly, other than the bands due to ammonia molecules in interaction with silanols and Cr6+ centres (acting as Lewis acid sites), signals typical of ammonium species were also detected, except for the bare MCM-41 silica, as expected. The formation of ammonium ions clearly monitored the occurrence of proton transfer from surface Brønsted acid centers, as reported also for other Cr-MCM-41 catalysts.25 This kind of surface site was also found to appear, with respect to the bare silica supports, as a consequence of the dispersion on SiO2 of Ti4+ (ref. 44) and V5+ (ref. 45–47) ions. However, an explanation for their appearance has not been provided yet.
The spectra were normalized to both the optical thickness (see Fig. S4A† and related comments) and SSABET of the samples, and then differences in the integrated intensity of the IR bands among the various catalysts became dependent only on differences in the amount of surface sites adsorbing ammonia. On such a basis, the integrated area of signals typical for NH3 molecules probing the Lewis acid sites (i.e. Cr6+ centres) and for NH4+ species, monitoring the presence of Brønsted acid sites, was plotted against the Cr content of the catalysts (Fig. 5). An almost linear relationship was obtained in the case of probe molecules on Lewis acid sites, whilst a concave trend appeared in the case of ammonium species, indicating that the formation of Brønsted acid sites was favored at high Cr loading (Fig. 5).
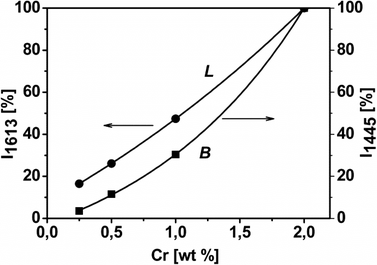 | ||
| Fig. 5 Relative integrated intensity of the IR absorption bands of NH3 adsorbed on Cr/DHS samples, due to Lewis (L, band at 1613 cm−1) and Brønsted (B, band at 1445 cm−1) acidity vs. chromium content. Original spectral data are shown in Fig. S5A in the ESI.† | ||
3.4. Catalytic tests
Moreover, all other catalysts were tested by using the CO2 + O2 oxidant mixture, and the results obtained are reported in Fig. S6 in the ESI.†
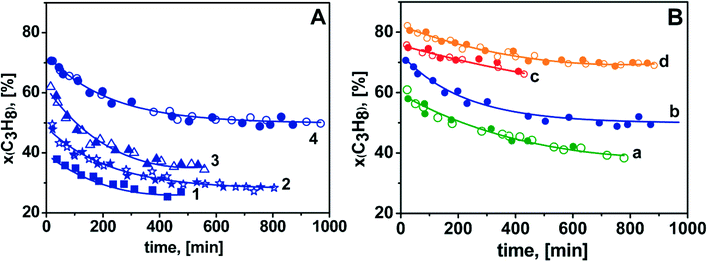
Focussing on the data in panel A, it can be observed that the initial C3H8 conversion in ODH with CO2 as the oxidant increased from ca. 40% for 0.25-Cr/DHS to ca. 70% for 2.0-Cr/DHS (curves 1–4). Thermodynamic calculations indicated that the equilibrium conversion of propane in the reaction C3H8 + CO2 ![[left over right harpoons]](https://www.rsc.org/images/entities/char_21cb.gif) C3H6 + CO + H2O carried out at 873 K is ca. 67%.20 However, it must be considered that parallel reactions also contributed to C3H8 conversion. Actually, some H2 (<0.5 mol%) was found among the products when CO2 alone was used as the oxidant, likely resulting in the occurrence to some extent of both propane direct dehydrogenation and water gas shift reaction. By increasing the reaction time, propane conversion decreased, monitoring the occurrence of some catalyst deactivation, but it remained as high as ca. 50% in the case of 2.0-Cr/DHS (curve 4). However, the coincidence between the behaviour exhibited by each catalyst in the first (open symbols) and subsequent (full symbols) 5–8 runs is clear evidence that no irreversible deactivation occurred. In fact, the DR UV-Vis-NIR spectra of the catalysts after the first run and then the treatment in flowing O2 at 873 K appeared almost coincident (not shown) with those recorded for the fresh form (Fig. S3 in the ESI†), monitoring the invariance of the speciation of surface chromium after the reactivation treatment.
C3H6 + CO + H2O carried out at 873 K is ca. 67%.20 However, it must be considered that parallel reactions also contributed to C3H8 conversion. Actually, some H2 (<0.5 mol%) was found among the products when CO2 alone was used as the oxidant, likely resulting in the occurrence to some extent of both propane direct dehydrogenation and water gas shift reaction. By increasing the reaction time, propane conversion decreased, monitoring the occurrence of some catalyst deactivation, but it remained as high as ca. 50% in the case of 2.0-Cr/DHS (curve 4). However, the coincidence between the behaviour exhibited by each catalyst in the first (open symbols) and subsequent (full symbols) 5–8 runs is clear evidence that no irreversible deactivation occurred. In fact, the DR UV-Vis-NIR spectra of the catalysts after the first run and then the treatment in flowing O2 at 873 K appeared almost coincident (not shown) with those recorded for the fresh form (Fig. S3 in the ESI†), monitoring the invariance of the speciation of surface chromium after the reactivation treatment.
The observed decrease in propane conversion should be attributed to coke formation, which affected in a different way the activity of the various catalysts, likely resulting from the combination of different textural features (e.g., porous structures could be more easily blocked by coke) and different amounts of Brønsted acid sites (increasing as the Cr content increased), as well as reversible changes in the speciation of supported Cr species (see below).
Details on the initial performances of the catalysts are listed in Table 2. Yields of both C3H6 and total olefins (just +3–5%) exhibited a similar trend by increasing the Cr loading, indicating that basic and side reactions were affected in a similar way by this parameter. It is noteworthy that in the case of 2.0-Cr/DHS, a YC3H6 of ca. 47% was attained using CO2 as the oxidant, which is significantly higher than the performance of the best catalyst reviewed by Cavani et al.2 Moreover, such an initial YC3H6 corresponded to those obtained by Chen et al. for GaOx-based materials,4 and by Ovsitser et al. for VOx supported catalysts.6 In addition, we confirmed the repeatability of these performances over several reaction runs. The mass balance for C, H and O was calculated for each point of each run. A maximum discrepancy of ca. 7% was obtained only for C and ascribed to coke formation.
| Entry | Cr, % | X C3H8, % | X CO2, % | S C3H6, % | S C2H4, % | S C2H6, % | S CH4, % | Y C3H6, % | Y C2H6+C2H4, % |
|---|---|---|---|---|---|---|---|---|---|
a The sum of all selectivities was never equal to 100%, as C atoms were also involved in the formation of coke. At the beginning of the process ∑SC3 + C2 + C1 for 2.0-Cr/DHS was ca. 80% and only after ca. 10 h did it approach 100%, due to the stabilization of the coke formation, accompanied by a significant increase in propene selectivity and some decrease in the activity of the cracking processes.
b Selectivity to “excess” methane, i.e. methane formed in the process of ethane cracking, as methane was formed in the cracking of both propane (1![[thin space (1/6-em)]](https://www.rsc.org/images/entities/char_2009.gif) : :![[thin space (1/6-em)]](https://www.rsc.org/images/entities/char_2009.gif) 1) and ethane (1 1) and ethane (1![[thin space (1/6-em)]](https://www.rsc.org/images/entities/char_2009.gif) : :![[thin space (1/6-em)]](https://www.rsc.org/images/entities/char_2009.gif) 2).
c O2 conversion was ca. 95% for all runs. 2).
c O2 conversion was ca. 95% for all runs.
|
|||||||||
Part A: C3H8![[thin space (1/6-em)]](https://www.rsc.org/images/entities/char_2009.gif) : :![[thin space (1/6-em)]](https://www.rsc.org/images/entities/char_2009.gif) CO2 CO2![[thin space (1/6-em)]](https://www.rsc.org/images/entities/char_2009.gif) : :![[thin space (1/6-em)]](https://www.rsc.org/images/entities/char_2009.gif) N2 = 15 N2 = 15![[thin space (1/6-em)]](https://www.rsc.org/images/entities/char_2009.gif) : :![[thin space (1/6-em)]](https://www.rsc.org/images/entities/char_2009.gif) 30 30![[thin space (1/6-em)]](https://www.rsc.org/images/entities/char_2009.gif) : :![[thin space (1/6-em)]](https://www.rsc.org/images/entities/char_2009.gif) 55, after 20 min of the reaction 55, after 20 min of the reaction |
|||||||||
| 1 | 0.25 | 38 | 4 | 81 | 11 | 7 | 0 | 31 | 35 |
| 2 | 0.5 | 50 | 9 | 75 | 9 | 8 | 0.5 | 37 | 41 |
| 3 | 1.0 | 62 | 16 | 73 | 8 | 8 | 2.8 | 45 | 50 |
| 4 | 2.0 | 71 | 19 | 66 | 7 | 13 | 2.5 | 47 | 50 |
Part Bc: C3H8![[thin space (1/6-em)]](https://www.rsc.org/images/entities/char_2009.gif) : :![[thin space (1/6-em)]](https://www.rsc.org/images/entities/char_2009.gif) CO2 CO2![[thin space (1/6-em)]](https://www.rsc.org/images/entities/char_2009.gif) : :![[thin space (1/6-em)]](https://www.rsc.org/images/entities/char_2009.gif) O2 O2![[thin space (1/6-em)]](https://www.rsc.org/images/entities/char_2009.gif) : :![[thin space (1/6-em)]](https://www.rsc.org/images/entities/char_2009.gif) N2 = 15 N2 = 15![[thin space (1/6-em)]](https://www.rsc.org/images/entities/char_2009.gif) : :![[thin space (1/6-em)]](https://www.rsc.org/images/entities/char_2009.gif) 30 30![[thin space (1/6-em)]](https://www.rsc.org/images/entities/char_2009.gif) : :![[thin space (1/6-em)]](https://www.rsc.org/images/entities/char_2009.gif) 3 3![[thin space (1/6-em)]](https://www.rsc.org/images/entities/char_2009.gif) : :![[thin space (1/6-em)]](https://www.rsc.org/images/entities/char_2009.gif) 52, after 20 min of the reaction 52, after 20 min of the reaction |
|||||||||
| 5 | 0.25 | 57 | — | 56 | 19 | 11 | 0.3 | 32 | 43 |
| 6 | 0.5 | 70 | — | 53 | 18 | 15 | 1.2 | 37 | 50 |
| 7 | 1.0 | 77 | — | 46 | 18 | 9 | 3.6 | 35 | 49 |
| 8 | 2.0 | 82 | — | 43 | 18 | 14 | 7.3 | 35 | 50 |
Of course, the switch from direct to oxidative propane dehydrogenation was expected to affect also the formation of coke.
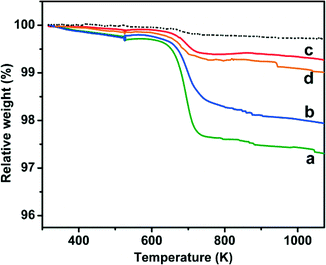
Accordingly, TGA data (Fig. 7) indicated that the weight loss assignable to coke removal by heating in air decreased from ca. 3 wt% for the catalyst tested in direct hydrogenation (curve a) to ca. 2 wt% when it was used for ODH in the presence of CO2 (curve b), and to ca. 1–0.5 wt% when the oxidant for ODH was O2 or the O2 + CO2 mixture (curves c and d, respectively).
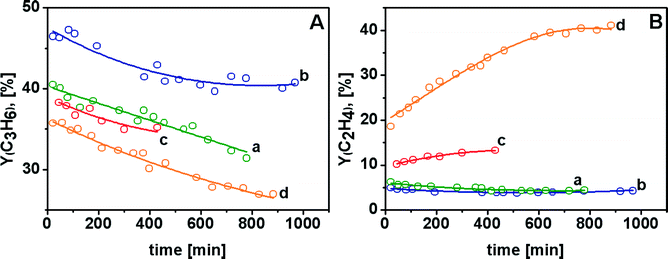
The most important result is represented by the yield of the two olefins resulting from ODH in the presence of CO2 as the oxidant (panel A, curve b); the initial C3H6 yield was ca. 47% (see also Table 2 and related comment), and remained as high as ca. 40% after 1000 min of reaction. Noticeably, these performances were reproduced after each catalyst's regeneration. To the best of our knowledge, this C3H6 yield for propane ODH processes on Cr/SiO2 catalysts operated for such a long time is equivalent to that reported for ODH of propane on VOx/SiO2 catalysts.6 Moreover, the C2H4 yield remained quite low (Y ≤ 5%) throughout the duration of the test (panel B, curve b), suggesting that propane ODH with CO2 as the oxidant on Cr/SiO2 catalysts can be of actual interest for the production of C2 and C3 olefin mixtures highly rich in C3H6.
Also, direct dehydrogenation resulted in a quite low (and constant) yield of ethene (Y ≤ 5%, panel B, curve a), but accompanied by a yield of C3H6 significantly lower than that of the previous case, ranging from ca. 40 down to ca. 32% (panel A, curve a). Passing to ODH processes carried out using O2, or O2 + CO2, even lower C3H6 yields were obtained (panel A, curves c and d). However, in these cases this behaviour was accompanied by higher C2H4 yields. For ODH with O2 + CO2 as oxidant ethylene became the main product after ca. 300 min of reaction (panel B, curves b and c). The higher production of C2H4 might be the result of the enhanced cracking of propane in the presence of O2,52 also responsible for the production of a larger excess of CH4 (reported in Fig. S8 in the ESI†). Hence, the results obtained in propane ODH using O2 or O2 + CO2 suggest that it could be worthwhile to investigate the possibility of tuning the O2/CO2 ratio in order to obtain a desired composition of the olefin mixture to obtain tailored feeds for C2H4/C3H6 copolymerization.
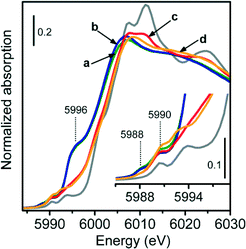
Fig. 9 shows the XANES spectra of 1.0-Cr/DHS samples treated under various model reaction conditions, compared with the spectral profile of Cr2O3 as the reference compound (grey curve).
The data can be straightforwardly divided into two groups. One is constituted by the spectra of the catalysts used in direct dehydrogenation and in ODH with CO2 as the oxidant (curves a and b); both spectra have the edge (evaluated at the maximum of the derivative curve) at 6002 eV, accompanied by an intense and broad pre-edge peak centred around 5996 eV, and by two weak pre-edge peaks at 5988 and 5990 eV. All these signals show the presence of Cr2+ species, as previously discussed for 0.5-Cr/DHS reduced in CO (Fig. 4A, curve b). The higher intensity of the white line feature suggests that the Cr2+ sites obtained during the propane ODH reaction have a higher number of ligands.
Conversely, the spectra of the catalyst used for ODH with O2 or O2 + CO2 as the oxidant (curves c and d) exhibited a double edge at higher energy (5999 and 6003 eV) and two weak pre-edge peaks at 5990 and 5993 eV. These three features appeared very similar to those present in the spectrum of the Cr2O3 reference compound. Moreover, the spectrum of the catalyst used for ODH with O2 + CO2 as the oxidant was characterized, in the white-line region, by a weak, ill-resolved doublet at 6008 and 6010 eV, which can result from multiple-scattering contributions of Cr2O3-like particles. The aggregation of Cr species under reaction conditions was proposed to occur in propane ODH with O2 as the oxidant,16 then reversed by subsequent catalyst reactivation in oxygen.
Thereby, the in situ XANES measurements provided evidence that during direct dehydrogenation or ODH in the presence of CO2 the average oxidation state of the active chromium species is +2, whereas when O2 was used for ODH (alone or mixed with CO2) their average oxidation state should be +3.
Conclusions
The DHS method can be successfully employed to obtain Cr/SiO2 catalysts with high specific surface area and a texture characterized by the co-presence of ordered mesoporous, disordered mesoporous and non-porous particles, with their relative amount depending on the Cr content. However, (ordered) porosity did not appear to be a requisite to have highly active catalysts. All chromium species were present as highly dispersed surface chromate species, and the amount of Cr sites (evaluated in terms of their behaviour as Lewis acid centres towards NH3) was found to be linearly proportional to the Cr loading. The formation of surface chromate species was accompanied by the appearance of Brønsted acid sites, which were relatively more abundant for higher Cr contents.All the investigated catalysts appeared stable towards possible irreversible deactivation in the ODH of propane, under reaction conditions as close as possible to industrial applications, and allowed the attainment of propene yields (and total olefins) among the highest reported in the literature, in particular by using CO2 alone as the oxidant, where YC3H6 still remained as high as 40% after 1000 min of reaction at a very low space velocity, in order to attain conversion of industrial interest.
Finally, the XANES data of the reacted catalyst indicated that when CO2 is used as the oxidant in ODH, the average oxidation state of Cr sites can be as low as +2, whereas it can be as low as 3+ in the presence of (also) O2 as the oxidant. It seems reasonable to propose that these possible differences in the oxidation state of Cr sites might contribute to the origin of differences in selectivity, and thus C3H6 and C2H4 yields, dependent on the oxidation agent.
Acknowledgements
The authors are grateful to Olivier Mathon (BM23 at ESRF) and to Giovanni Agostini and Caterina Barzan for their friendly assistance during the XAS experiments. University of Torino, Compagnia di San Paolo (project ORTO11RRT5) and RFBF-ASP (grant no. 07-03-951581) are acknowledged for the funding.References
- http://pubs.acs.org/cen/coverstory/83/8312petrochemicals.html.
- F. Cavani, N. Ballarini and A. Cericola, Catal. Today, 2007, 127, 113–131 CrossRef CAS.
- J. J. H. B. Sattler, J. Ruiz-Martinez, E. Santillan-Jimenez and B. M. Weckhuysen, Chem. Rev., 2014, 114, 10613–10653 CrossRef CAS PubMed.
- M. Chen, J. Xu, F. Z. Su, Y. M. Liu, Y. Cao, H. Y. He and K. N. Fan, J. Catal., 2008, 256, 293–300 CrossRef CAS.
- C. A. Carrero, R. Schloegl, I. E. Wachs and R. Schomaecker, ACS Catal., 2014, 4, 3357–3380 CrossRef CAS.
- O. Ovsitser, R. Schomaecker, E. V. Kondratenko, T. Wolfram and A. Trunschke, Catal. Today, 2012, 192, 16–19 CrossRef CAS.
- O. Ovsitser and E. V. Kondratenko, Chem. Commun., 2010, 46, 4974–4976 RSC.
- F. A. F. Frusteri, G. Calogero, T. Torre and A. Parmaliana, Catal. Commun., 2001, 2, 49–56 CrossRef CAS.
- A. I. Tsyganok, T. Tsunoda, S. Hamakawa, K. Suzuki, K. Takehira and T. Hayakawa, J. Catal., 2003, 213, 191–203 CrossRef CAS.
- Y. Wang, Q. L. Zhuang, Y. Takahashi and Y. Ohtsuka, Catal. Lett., 1998, 56, 203–206 CrossRef CAS.
- H. L. Wan, X. P. Zhou, W. Z. Weng, R. Q. Long, Z. S. Chao, W. D. Zhang, M. S. Chen, J. Z. Luo and S. Q. Zhou, Catal. Today, 1999, 51, 161–175 CrossRef CAS.
- N. Mimura, M. Okamoto, H. Yamashita, S. T. Oyama and K. Murata, J. Phys. Chem. B, 2006, 110, 21764–21770 CrossRef CAS PubMed.
- Y. Ohishi, T. Kawabata, T. Shishido, K. Takaki, Q. H. Zhang, Y. Wang and K. Takehira, J. Mol. Catal. A: Chem., 2005, 230, 49–58 CrossRef CAS.
- J. Santamaria-Gonzalez, J. Merida-Robles, M. Alcantara-Rodriguez, P. Maireles-Torres, E. Rodriguez-Castellon and A. Jimenez-Lopez, Catal. Lett., 2000, 64, 209–214 CrossRef CAS.
- I. Takahara and M. Saito, Chem. Lett., 1996, 25, 973–974 CrossRef.
- K. Takehira, Y. Ohishi, T. Shishido, T. Kawabata, K. Takaki, Q. H. Zhang and Y. Wang, J. Catal., 2004, 224, 404–416 CrossRef CAS.
- S. B. Wang, K. Murata, T. Hayakawa, S. Hamakawa and K. Suzuki, Appl. Catal., A, 2000, 196, 1–8 CrossRef CAS.
- Y. Wang, Y. Ohishi, T. Shishido, Q. H. Zhang, W. Yang, Q. Guo, H. L. Wan and K. Takehira, J. Catal., 2003, 220, 347–357 CrossRef CAS.
- H. Yang, L. Liu, L. Y. Xu, S. J. Xie, Q. X. Wang and L. W. Lin, in Natural Gas Conversion, ed. X. Bao and Y. Xu, Elsevier, Amsterdam, 2004, vol. 147, pp. 697–702 Search PubMed.
- M. A. Botavina, G. Martra, Y. A. Agafonov, N. A. Gaidai, N. V. Nekrasov, D. V. Trushin, S. Coluccia and A. L. Lapidus, Appl. Catal., A, 2008, 347, 126–132 CrossRef CAS.
- V. C. Corberán, Catal. Today, 2005, 99, 33–41 CrossRef.
- T. Kamegawa, J. Morishima, M. Matsuoka, J. M. Thomas and M. Anpo, J. Phys. Chem. C, 2007, 111, 1076–1078 CAS.
- H. L. L. Liu and Y. Zhang, Catal. Commun., 2007, 8, 565–570 CrossRef.
- S. C. Laha and R. Glaser, Microporous Mesoporous Mater., 2007, 99, 159–166 CrossRef CAS.
- M. Lezanska, G. S. Szymanski, P. Pietrzyk, Z. Sojka and J. A. Lercher, J. Phys. Chem. C, 2007, 111, 1830–1839 CAS.
- C. S. S. Shylesh, A. P. Singh and B. G. Anderson, Microporous Mesoporous Mater., 2007, 99, 334–344 CrossRef.
- S. H. Shen and L. J. Guo, Catal. Today, 2007, 129, 414–420 CrossRef CAS.
- C. Subrahmanyam, B. Louis, F. Rainone, B. Viswanathan, A. Renken and T. K. Varadarajan, Appl. Catal., A, 2003, 241, 205–215 CrossRef CAS.
- E. G. A. Zecchina, G. Ghiottl, C. Morterra and E. Borello, J. Phys. Chem., 1975, 79, 966–972 CrossRef.
- S. Samanta, N. K. Mal and A. Bhaumik, J. Mol. Catal. A: Chem., 2005, 236, 7–11 CrossRef CAS.
- S. Bordiga, E. Groppo, G. Agostini, J. A. van Bokhoven and C. Lamberti, Chem. Rev., 2013, 113, 1736–1850 CrossRef CAS PubMed.
- C. A. Demmelmaier, R. E. White, J. A. van Bokhoven and S. L. Scott, J. Catal., 2009, 262, 44–56 CrossRef CAS.
- C. A. Demmelmaier, R. E. White, J. A. van Bokhoven and S. L. Scott, J. Phys. Chem. C, 2008, 112, 6439–6449 CAS.
- E. Groppo, C. Lamberti, S. Bordiga, G. Spoto and A. Zecchina, Chem. Rev., 2005, 105, 115–183 CrossRef CAS PubMed.
- E. Groppo, C. Prestipino, F. Cesano, F. Bonino, S. Bordiga, C. Lamberti, P. C. Thune, J. W. Niemantsverdriet and A. Zecchina, J. Catal., 2005, 230, 98–108 CrossRef CAS.
- B. M. Weckhuysen, R. A. Schoonheydt, J. M. Jehng, I. E. Wachs, S. J. Cho, R. Ryoo, S. Kijlstra and E. Poels, J. Chem. Soc., Faraday Trans., 1995, 91, 3245–3253 RSC.
- B. M. Weckhuysen, A. A. Verberckmoes, A. L. Buttiens and R. A. Schoonheydt, J. Phys. Chem., 1994, 98, 579–584 CrossRef CAS.
- R. L. Puurunen, B. G. Beheydt and B. M. Weckhuysen, J. Catal., 2001, 204, 253–257 CrossRef CAS.
- B. M. Weckhuysen, I. E. Wachs and R. A. Schoonheydt, Preparation of Catalysts VI, ed. G. Poncelet, J. Martens, B. Delmon, P. A. Jacobs and P. Grange, Elsevier, Amsterdam, 1995, vol. 91, pp. 151–158 Search PubMed.
- B. M. Weckhuysen, I. E. Wachs and R. A. Schoonheydt, Chem. Rev., 1996, 96, 3327–3349 CrossRef CAS PubMed.
- D. Gianolio, E. Groppo, J. G. Vitillo, A. Damin, S. Bordiga, A. Zecchina and C. Lamberti, Chem. Commun., 2010, 46, 976–978 RSC.
- E. Groppo, K. Seenivasan and C. Barzan, Catal. Sci. Technol., 2013, 3, 858–878 CAS.
- G. Bellussi, G. Centi, S. Perathoner and F. Trifiro, in Catalytic Selective Oxidation, ed. S. T. Oyama and J. W. Hightower, American Chemical Society, Washington, ACS Symposium Series, 1993, vol. 523, ch. 21, pp. 281–297 Search PubMed.
- Y. Hu, S. Higashimoto, G. Martra, J. L. Zhang, M. Matsuoka, S. Coluccia and M. Anpo, Catal. Lett., 2003, 90, 161–163 CrossRef CAS.
- G. Busca, L. Marchetti, G. Centi and F. Trifiro, J. Chem. Soc., Faraday Trans. 1, 1985, 81, 1003–1014 RSC.
- G. Martra, F. Arena, S. Coluccia, F. Frusteri and A. Parmaliana, Catal. Today, 2000, 63, 197–207 CrossRef CAS.
- H. Miyata, K. Fujii and T. Ono, J. Chem. Soc., Faraday Trans. 1, 1988, 84, 3121–3128 RSC.
- O. F. Gorriz and L. E. Cadus, Appl. Catal., A, 1999, 180, 247–260 CrossRef CAS.
- B. M. Weckhuysen and R. A. Schoonheydt, Catal. Today, 1999, 51, 223–232 CrossRef CAS.
- K. Nakagawa, C. Kajita, N. Ikenaga, M. Nishitani-Gamo, T. Ando and T. Suzuki, Catal. Today, 2003, 84, 149–157 CrossRef CAS.
- L. Y. Xu, J. X. Liu, Y. D. Xu, H. Yang, Q. X. Wang and L. W. Lin, Appl. Catal., A, 2000, 193, 95–101 CrossRef.
- V. R. Choudhary, V. H. Rane and A. M. Rajput, AIChE J., 1998, 44, 2293–2301 CrossRef CAS.
Footnote |
| † Electronic supplementary information (ESI) available. See DOI: 10.1039/c5cy00998g |
| This journal is © The Royal Society of Chemistry 2016 |

