 Open Access Article
Potential of Cu–saponite catalysts for soot combustion
F. B.
Gebretsadik
a,
Y.
Cesteros
a,
P.
Salagre
a,
J.
Giménez-Mañogil
b,
A.
García-García
b and
A.
Bueno-López
*b
aDepartment of Physical and Inorganic Chemistry, Universitat Rovira i Virgili, C/ Marcel lí Domingo s/n, 43007 Tarragona, Spain
bDepartment of Inorganic Chemistry, Faculty of Sciences, University of Alicante, Ap. 99, E-03080 Alicante, Spain. E-mail: agus@ua.es
First published on 17th August 2015
Abstract
H– and Na–saponite supports have been prepared by several synthesis approaches. 5% Cu/saponite catalysts have been prepared and tested for soot combustion in a NOx + O2 + N2 gas flow and with soot and catalyst mixed in loose contact mode. XRD, FT-IR, N2 adsorption and TEM characterization results revealed that the use of either surfactant or microwaves during the synthesis led to delamination of the saponite support, yielding high surface area and small crystallite size materials. The degree of delamination affected further copper oxide dispersion and soot combustion capacity of the Cu/saponite catalysts. All Cu/saponite catalysts were active for soot combustion, and the NO2-assisted mechanism seemed to prevail. The best activity was achieved with copper oxide supported on a Na–saponite prepared at pH 13 and with surfactant. This best activity was attributed to the efficient copper oxide dispersion on the high surface area delaminated saponite (603 m2 g−1) and to the presence of Na. Copper oxide reduction in H2-TPR experiments occurred at lower temperature for the Na-containing catalysts than for the H-containing counterparts, and all Cu/Na–saponite catalysts were more active for soot combustion than the corresponding Cu/H–saponite catalysts.
1. Introduction
Clays are cheap and easily available materials, and among them, smectites present high surface area, acidity, and exchange and swelling capacities, therefore being suitable for adsorption and catalysis applications. Saponite is a trioctahedral smectite with the general formula Mx[Mg6AlxSi8−xO20(OH)4]. They have a lamellar structure of TOT type consisting of an oxygen framework of layers comprising two sheets of tetrahedral sites (Si4+ and Al3+) and one central sheet of octahedral sites (Mg2+). The isomorphous substitution of Si4+ by Al3+ leads to a negative charge excess that is neutralized by incorporation of M (usually Na+ or NH4+) cations in the interlamellar space.Saponites occur naturally and can also be synthesized in the laboratory. Natural saponites are cheap and abundant. However, they contain impurities and the chemical composition can be very variable. Therefore, synthetic saponites are more convenient for research purposes. Saponite synthesis typically consists of thermal or hydrothermal treatment at mild temperature, during long time, of a gel with stoichiometric amounts of Si, Al and Mg salts, also including a source of the interlayer cation.1 Microwave aging has been demonstrated to be a good alternative to conventional hydrothermal treatments for saponite synthesis since microwaves allow energy saving by working at lower temperatures and shorter times. Microwaves have also improved the occupation of Al in the tetrahedral positions and delamination.2
Delamination and the construction of pillars in the interlayer space are interesting solutions to introduce mesoporosity and increase the area of smectites.3 Delaminated mesoporous hectorites have been prepared by in situ hydrothermal aging of a polyvinylpyrrolidone-containing gel4 or quaternary ammonium salt5,6 followed by removal of the template by calcination. Delamination of saponites was reported by Vicente et al.7 during the preparation of saponites using microwaves and by Costenaro et al.8 and Gebretsadik et al.2 for saponites prepared from highly diluted slurries (H2O/Si molar ratio >150).2
Saponites have been investigated as catalyst supports for several reactions. For instance, Cs/saponite catalysts have been studied for the synthesis of N-alkylpyrazoles,9 Fe/saponites catalysts for Fenton reaction,10 Co/saponite catalysts for air oxidation of polyvinyl alcohol11 and Ni/saponite catalysts for the hydrogenation of styrene oxide,12 among other reactions catalyzed by saponite-supported metal cations. Also, saponites containing Mg2+, Ni2+ or Fe2+ as octahedral cations and Al3+ and Fe3+ substituting Si4+ have been prepared and tested for the epoxidation of (Z)-cyclooctene by hydrogen peroxide,13 and ethylene polymerization has been carried out on iron and nickel complexes immobilized in saponite interlayers.14
However, as far as we know, saponite catalysts have not been tested for diesel soot combustion. Soot is produced in diesel engines and is responsible for severe health problems.15–18 A Diesel Particulate Filter (DPF) is placed in the exhaust pipe to avoid soot emission, and this filter must be regenerated by soot combustion.15–17 Different catalysts have been proposed to lower the regeneration temperature, Pt being the one used in practical applications. However, noble metals are expensive and cheaper materials are being investigated as potential substitutes. Utilization of clay-based catalysts has been almost unexplored for this application, and this has motivated our interest for this type of materials. In a previous study,19 Cu/hectorite catalysts were prepared and tested for soot combustion, and in spite of their activity, their performance was still far away from being competitive for a practical use.
In order to study new noble metal-free clay-based catalysts, in this work, several Cu/saponite catalysts have been prepared, characterized and tested for soot combustion. Different synthesis approaches have been used for preparing saponite supports, including pH modification (8 or 13), different thermal treatments (microwaves or conventional) and synthesis with or without surfactant. These variations will lead to saponite supports with different degrees of delamination, surface area and porosity. The effect of the cation (Na+ or H+), included in the saponite support to compensate the charge imbalance, has been also explored.
2. Experimental
2.1. Synthesis of the supports
Six saponite supports (three Na–saponites and three H–saponites) with molar stoichiometry 6.8![[thin space (1/6-em)]](https://www.rsc.org/images/entities/char_2009.gif) :
:![[thin space (1/6-em)]](https://www.rsc.org/images/entities/char_2009.gif) 1.2
1.2![[thin space (1/6-em)]](https://www.rsc.org/images/entities/char_2009.gif) :
:![[thin space (1/6-em)]](https://www.rsc.org/images/entities/char_2009.gif) 6 for Si
6 for Si![[thin space (1/6-em)]](https://www.rsc.org/images/entities/char_2009.gif) :
:![[thin space (1/6-em)]](https://www.rsc.org/images/entities/char_2009.gif) Al
Al![[thin space (1/6-em)]](https://www.rsc.org/images/entities/char_2009.gif) :
:![[thin space (1/6-em)]](https://www.rsc.org/images/entities/char_2009.gif) Mg components were prepared following methods previously reported.2,20,21 Four saponites were prepared at pH 13, two of them using surfactant (As) and microwaves (Mw) during the aging treatment, and the other two aged by conventional thermal treatment (C) and without surfactant. These saponites were named Na–S(As, Mw, 13), Na–S(C, 13), H–S(As, Mw, 13), H–S(C, 13). Two more saponites were prepared at pH 8 using microwaves during the aging and without surfactant: Na–S(Mw, 8) and H–S(Mw, 8). Table 1 summarizes the information about the synthesis of the saponites.
Mg components were prepared following methods previously reported.2,20,21 Four saponites were prepared at pH 13, two of them using surfactant (As) and microwaves (Mw) during the aging treatment, and the other two aged by conventional thermal treatment (C) and without surfactant. These saponites were named Na–S(As, Mw, 13), Na–S(C, 13), H–S(As, Mw, 13), H–S(C, 13). Two more saponites were prepared at pH 8 using microwaves during the aging and without surfactant: Na–S(Mw, 8) and H–S(Mw, 8). Table 1 summarizes the information about the synthesis of the saponites.
| Sample | Surfactant use | Heating source | pH |
|---|---|---|---|
| Na–S(Mw, 8) | No | Microwaves | 8 |
| H–S(Mw, 8) | No | Microwaves | 8 |
| Na–S(C, 13) | No | Conventional | 13 |
| H–S(C, 13) | No | Conventional | 13 |
| Na–S(As, Mw, 13) | Yes | Microwaves | 13 |
| H–S(As, Mw, 13) | Yes | Microwaves | 13 |
2.2. Preparation of Cu/saponite catalysts
5 wt% copper was loaded on the six saponite supports. The obtained catalysts were referred to as Cu/support. 1 g of support was impregnated with an ethanol solution (0.19 g of copper precursor, Cu(NO3)2·3H2O (Aldrich, 98%) in 5 ml of solvent). The solvent was removed in a rotary evaporator and the catalyst was dried overnight at 100 °C and calcined at 450 °C for 5 h afterwards.2.3. Samples characterization
XRD patterns of the Na–saponite supports were obtained in a Siemens D5000 diffractometer equipped with a Cu-Kα radiation source (λ = 1.54 Å). A low background Si(510) sample holder was used and data were collected with an angular step of 0.05° and at rate of 3 s per step. Measurement was performed for 2θ diffraction angles between 5 and 70°. The peak width determined from the (060) reflection, after removing the peak broadening contribution of the instrument, was used to calculate the crystallite sizes by applying the Scherrer equation with TOPAS 3.1.N2 adsorption–desorption isotherms were recorded at −196 °C using a Quadrasorb SI device. Samples were degassed under vacuum at 110 °C overnight before measurements. Specific surface areas and external surface areas were determined with the BET and t-plot methods, respectively. Pore size distribution was obtained by applying the BJH method to the desorption wing of the isotherm.
Infrared spectra (FT-IR) were recorded on a Bruker-Equinox-55 FT-IR spectrometer. Pellets were prepared by compressing 1 mg of finely grounded powder of the sample and 250 mg of dried KBr. The spectra were acquired by accumulating 32 scans at 4 cm−1 resolution in the range of 4000–400 cm−1 and are presented in the range 1800–400 cm−1 where the most relevant features are identified.
The reducibility of the samples was studied by temperature programmed reduction with H2 in a thermobalance Labsy Setaram device. In a typical experiment, 200 mg of sample was heated from room temperature to 300 °C under N2 flow at a heating rate of 10 °C min−1 and the maximum temperature was maintained for 1 h. The sample was cooled to 100 °C and was then heated under a flow of 5% H2 in Ar up to 600 °C at a rate of 10 °C min−1. The first-order differential curves of the thermograms were used to analyze the reducibility of the catalysts.
The TEM images of the catalyst samples were obtained using a JOEL (JEM-2010) microscope. A few droplets of an ultrasonically dispersed suspension in ethanol of each catalyst was placed on a copper grid with lacey carbon film and dried at ambient conditions.
2.4. Catalytic tests
Catalytic tests were performed in a tubular quartz reactor coupled to specific NDIR-UV gas analyzers for CO, CO2, NO, NO2 and O2 monitoring (Fisher–Rosemount, models BINOS 100, 1001 and 1004). 20 mg of soot, 80 mg of catalyst, or 20 mg of soot + 80 mg of catalyst mixed in the so-called loose contact mode were used in these experiments. In all cases, the samples were diluted with SiC to avoid pressure drop and favor heat transfer. The temperature was raised from room temperature up to 700 °C at 10 °C min−1 in a gas mixture with 500 ppm NO + 5% O2 and N2 balance. The total flow was 500 ml min−1 (GHSV = 30![[thin space (1/6-em)]](https://www.rsc.org/images/entities/char_2009.gif) 000 h−1). The model soot used was a carbon black supplied by Evonik-Degussa GmbH (Printex U).
000 h−1). The model soot used was a carbon black supplied by Evonik-Degussa GmbH (Printex U).
3. Results and discussion
3.1. Characterization of the Na–saponite supports
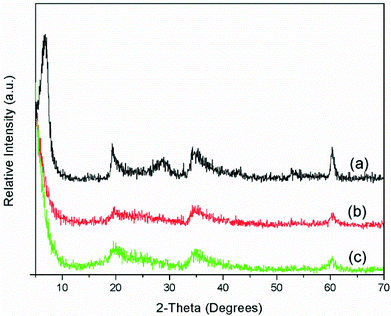
Several techniques of solid characterization (XRD, FTIR and N2 adsorption) have been used to confirm the nature and properties of the prepared supports. The XRD patterns of all the Na–saponite supports showed the characteristic (110) and (060) reflections of smectites22 at 19.4 and 60.5°, 2θ, respectively (Fig. 1).The position of the (060) reflection was characteristic of saponites. The crystallite sizes, calculated from the (060) reflection, are shown in Table 2. Na–S(C, 13) had the highest crystallite size (13 nm) and Na–S(As, Mw, 13) the smallest (4 nm). This means that Na–S(C, 13) has more crystalline lamella. The (001) reflection at 2θ = 8° appeared well defined only for Na–S(C, 13), indicating a good ordering in the stacking direction for this sample. For Na–S(Mw, 13) and Na–S(As, Mw, 13), the (001) reflection was weak or absent indicating a loss of registry in the c-direction for these samples. This technique corroborates that saponites were obtained, and the use of surfactant and/or microwaves favored lamella disorder and probably delamination.6,7,22
| Sample | BET area/m2 g−1 | Average pore radius/Å | Crystallite size (060)/nm |
|---|---|---|---|
| Na–S(Mw, 8) | 461 | 26 | 8 |
| Na–S(C, 13) | 50 | 20 | 13 |
| Na–S(As, Mw, 13) | 603 | 35 | 4 |
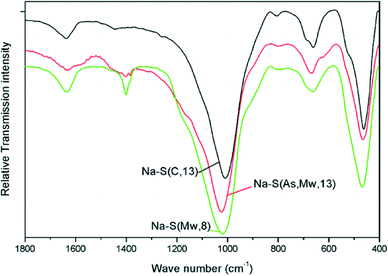
FT-IR spectra of the Na–saponite supports were recorded in the 4000–400 cm−1 range. The spectra are displayed in Fig. 2 in the region 1800–400 cm−1.
The IR spectra are characteristic of saponites.21,23–25 The O–Si–O band was identified in the 1023–1010 cm−1 range. This band appeared at lower wavenumber (1010 cm−1) for Na–S(C, 13), while appearing at higher wavenumber (1023 cm−1) for both Na–S(Mw, 8) and Na–S(As, Mw, 13). The latter two samples also showed a weak band at 800 cm−1 and a shoulder at 1200 cm−1, both ascribed to the presence of residual amorphous silica.
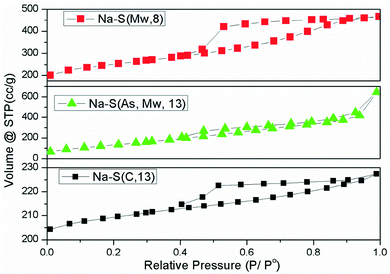
The N2 adsorption–desorption isotherms of the Na–saponite supports are shown in Fig. 3, and the average pore size and surface area values are summarized in Table 2.
All the samples show contribution of type IV isotherms according to the IUPAC classification, which indicates the presence of mesoporosity. The shape of the hysteresis loop confirms that Na–S(C, 13) has highly ordered lamella in the stacking direction, with high contribution of type B hysteresis loop according to the de Boer's classification. On the contrary, the hysteresis loop of Na–S(As, Mw, 13), has more contribution of D than of B type hysteresis which can be attributed to a more disordered lamellar structure. The sample Na–S(Mw, 8) also presented a significant contribution of type B hysteresis.
The surface area results were also in good agreement with the other characterization results. Na–S(As, Mw, 13), which showed higher lamella disorder and lower crystallinity (crystallite size 4 nm) than the other supports, exhibited the highest surface area (600 m2 g−1). The high surface area of Na–S(Mw, 8) (461 m2 g−1) can be related to its smaller crystallite size (8 nm) and some contribution of lamella disorder or delamination. Na–S(C, 13), with the highest crystallinity (13 nm) and highest stacking registry, showed the lowest surface area (50 m2 g−1).
The porosity, given as average pore radius, follows the same trend as the degree of delamination or disorder, the highest value being for the most delaminated sample, Na–S(As, Mw, 13) (35 Å), followed by Na–S(Mw, 8) (26 Å) and finally Na–S(C, 13) (20 Å).
3.2. Catalytic results
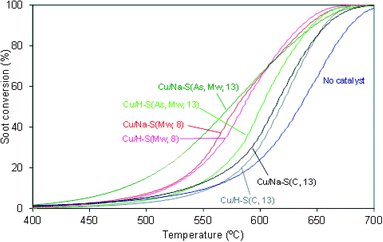
Fig. 4 compiles the soot conversion profiles for the uncatalysed and catalysed reactions and Table 3 shows the CO2 selectivity values.| Catalyst | CO2 selectivity (%) |
|---|---|
| No catalyst | 36 |
| Cu/H–S(Mw, 8) | 92 |
| Cu/Na–S(Mw, 8) | 96 |
| Cu/H–S(C, 13) | 78 |
| Cu/Na–S(C, 13) | 84 |
| Cu/H–S(As, Mw, 13) | 88 |
| Cu/Na–S(As, Mw, 13) | 99 |
All Cu/saponite catalysts decreased the soot combustion temperature and increased CO2 selectivity when compared to the uncatalyzed reaction. The saponite support significantly affects the catalytic performance of the catalysts. It is worth mentioning that the catalytic activity for soot combustion of the copper-free saponites was low or null in all cases (curves not shown here for the sake of brevity), and therefore, the differences observed in the performance of the Cu/saponite catalysts must be attributed to changes in the behavior of copper due to the nature of the support.
Cu/Na–S(As, Mw, 13) was the most active Cu/saponite catalyst tested, with an onset soot combustion temperature of 400 °C, while the remainder of the catalysts required temperatures above 450 °C for the soot combustion reaction to occur in a measurable extent.
The highest activity of the Cu/Na–S(As, Mw, 13) catalyst could be related to the highest surface area and smallest crystallite size of its support whereas the lowest activity observed with the Cu/Na–S(C, 13) and Cu/H–S(C, 13) catalysts is in accord with the lowest surface area and the highest crystallite size of their saponite supports. As a general trend, by comparing the catalysts with Na–saponite as supports, we can conclude that the higher the Na–saponite surface area (and the lower the crystallite size), the higher the activity for soot combustion. A more detailed analysis of the catalyst features is included in the next section, providing additional arguments to explain the catalytic trends observed.
The nature of the cation (Na+ or H+) present on the saponite supports had a minor effect in the catalytic activity of Cu/(Na or H)–S(C, 13) and Cu/(Na or H)–S(Mw, 8), while a strong effect was observed for Cu/Na–S(As, Mw, 13) and Cu/H–S(As, Mw, 13), in which the Na+-containing catalyst showed much better performance than their counterpart H+-containing catalyst. This is also discussed in the final characterization section.
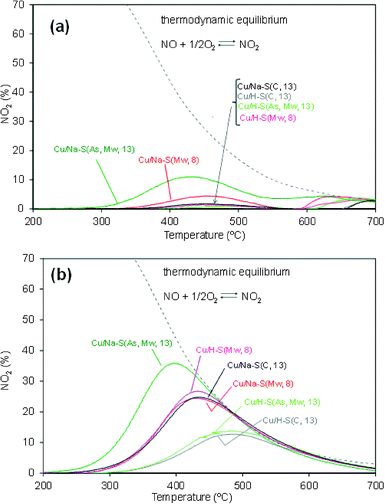
The NO2 profiles monitored during the soot combustion tests, and in similar experiments performed only with the catalysts (without soot), provide information about the catalyzed soot combustion mechanism taking place. These profiles are shown in Fig. 5a and b, respectively.
NO2 concentration was null in the gas mixture fed to the reactor, as it is in exhaust gas emitted by diesel engines. NO2 was formed in these experiments by catalytic oxidation of NO once the temperature was high enough. NO2 plays a key role in soot ignition since it is much more oxidizing than NO and O2. As observed in Fig. 5b, all NO2 curves obtained in the absence of soot showed a maximum (TmaxNO2) below which the formation of NO2 is controlled by the catalytic oxidation of NO and above which the NO2 profiles follow the thermodynamic curve of the NO oxidation reaction.
The NO2 profiles obtained in the absence of soot (Fig. 5b) suggest that part or all the NO2 produced by catalytic oxidation of NO is reduced back to NO by reaction with soot (note that net NOx consumption was not detected in these experiments). This reaction pathway is very efficient to start soot combustion.26 NO2 slip was not detected in most catalytic soot combustion tests (see Fig. 5a), with the exception of Cu/Na–S(As, Mw, 13), which produced more NO2 to that able to react with soot under the experimental conditions used.
The relationship existing between catalytic oxidation of NO2 and soot combustion is clearly shown in Fig. 6, where the temperatures required for 10 and 50% soot conversion (Fig. 4) are plotted against Tmax NO2 (temperature for maximum NO2 concentration in curves of Fig. 5b). Straight lines are not observed in Fig. 6 because soot combustion mainly takes place above 450 °C, and the NO2 production observed in Fig. 5b is thermodynamically restricted above this temperature. For this reason, Fig. 5b only provides a rough idea about the NO2 production capacity of the different catalysts, but it is hard to actually know the actual NO2 production during soot combustion because NO2 is produced and simultaneously depleted by the NO2–soot reaction and each NO molecule can be oxidized and reduced several times along the catalytic bed. In addition, O2 also contributes to soot combustion once the NO2-assisted oxidation has started, and its contribution progressively increases with temperature.
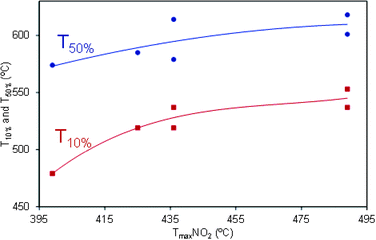 | ||
| Fig. 6 Relationship between NO2 production and soot combustion Cu/saponite-catalyzed experiments. Tmax NO2 (°C) is the temperature for maximum NO2 production in Fig. 5b profiles. T 10% and T 50% (°C) are the temperatures for 10 and 50% soot conversions in Fig. 4 profiles. | ||
The reutilization of the most active catalyst (Cu/Na–S(As, Mw, 13)) was studied in three consecutive NO oxidation experiments (similar to those of Fig. 5b) which were performed with the same catalyst sample. A delay in the Tmax NO2 temperature of 70 °C was observed in the second run with regard to the first one, but the second and third runs were equal. These reutilization tests evidenced that the Cu/Na–S(As, Mw, 13) catalyst undergoes an important deactivation during the first use, but it remains stable afterwards.
3.3. Characterization of catalysts by TEM and H2-TPR
The Cu/saponite catalysts were characterized by TEM and H2-TPR in order to explain the differences observed in catalytic activity. TEM images compiled in Fig. 7 show a randomly oriented lamellar structure for Cu/(Na or H)–S(As, Mw, 13) catalysts (Fig. 7a and b, respectively) and Cu/(Na or H)–S(Mw, 8) (Fig. 7e and f, respectively) catalysts, while a highly ordered lamellar structure was observed for Cu/(Na or H)–S(C, 13) catalysts (Fig. 7c and d, respectively).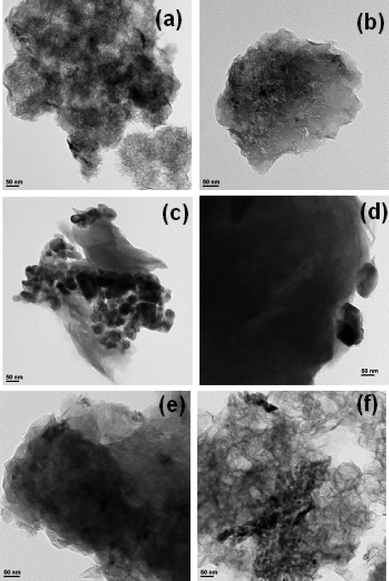 | ||
| Fig. 7 TEM images of (a) Cu/Na–S(As, Mw, 13), (b) Cu/H–S(As, Mw, 13), (c) Cu/Na–S(C, 13), (d) Cu/H–S(C, 13), (e) Cu/Na–S(Mw, 8) and (f) Cu/H–S(Mw, 8). | ||
These differences are in accord with XRD and N2 adsorption characterization, suggesting that Na–S(C, 13) is a well-ordered low surface area saponite while Na–S(As, Mw, 13) and Na–S(Mw, 8) present much more delaminated higher surface area structures. As a consequence of these differences, copper oxide particles on the Cu/(Na or H) S(C, 13) catalysts (Fig. 7c and d, respectively) were poorly dispersed, and large dark copper oxide crystals were clearly distinguished in both TEM images, while copper oxide particles supported on (Na or H)–S(As, Mw, 13) (Fig. 7a and b, respectively) and (Na or H)–S(Mw, 8) (Fig. 7e and f, respectively) appeared smaller and better dispersed.
Differences due to the presence of Na+ or H+ cations are not obvious in TEM images either in the copper oxide particles, or in the saponite supports, but H2-TPR profiles included in Fig. 8 provide evidences about the effect of the cation in the copper oxide reducibility.
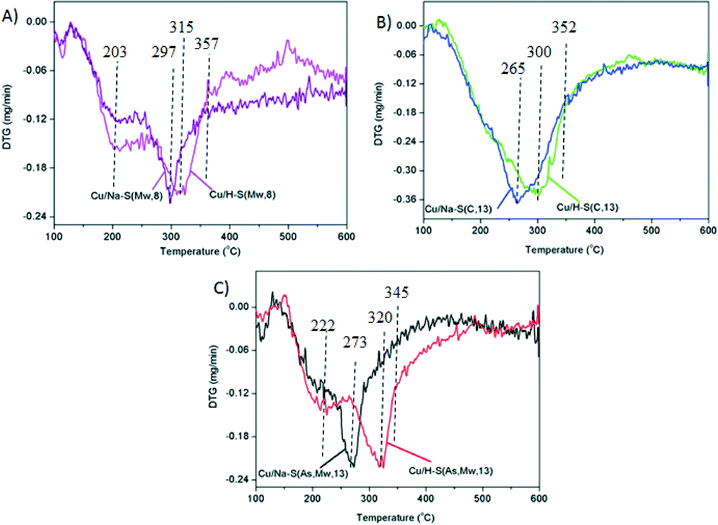
All H2-TPR profiles show a weight decrease within the range 175–425 °C, and the temperature and shape of the profiles was different for each catalyst. Catalysts with the (Na or H)–S(As, Mw, 13) and (Na or H)–S(Mw, 8) supports showed two copper oxide reduction steps due to the presence of copper oxide species with different reducibility. The low-temperature shoulders can be attributed to easily reducible copper oxide, probably well-dispersed smaller particles, while the main reduction event appearing at higher temperature corresponds to less-reducible copper oxide, probably larger particles27,28 or with stronger interaction with the support. On the contrary, catalysts with (Na or H)–S(C, 13) supports showed a single copper oxide reduction step, which is consistent with only the presence of large poorly-dispersed copper oxide particles, as deduced from TEM images.
It is worth emphasizing the effect of the Na+ or H+ cations in the catalysts reduction. For all supports, copper oxide reduction occurred at lower temperature for the Na-containing catalysts than for their H-containing counterparts. This may be related to an increase of the interaction between CuO and the support in the acid form. The effect of the Na and H cations was low for catalysts with the S(Mw, 8) and S(C, 13) supports. For both supports, regardless the cation (Na+ or H+), the reduction was completed at 357 and 352 °C, respectively (Fig. 8), while differences of reducibility were much more marked for those with S(As, Mw, 13), with a total reduction at 320 °C when the cation was Na and at 345 °C in the case of the H+. These differences are in line with the soot combustion activities observed in Fig. 4. While catalysts with S(Mw, 8) and S(C, 13) supports showed a minor effect of the Na and H cation in the soot combustion capacity, Cu/Na–S(As, Mw, 13) was much more active than Cu/H–S(As, Mw, 13). This observation confirms the important role of the redox processes occurring on copper active sites during soot combustion, and suggests that the reduction of these active sites are limiting the reaction rate, as expected for the highly oxidizing gas mixture used.
In summary, the highest catalytic activity for soot combustion of the Cu/Na–S(As, Mw, 13) catalyst, among all the Cu/saponite catalysts studied, can be attributed to the most optimal copper oxide dispersion on the high surface area delaminated saponite and to the higher interaction between the CuO and the acid support, which hinders the copper reducibility.
4. Conclusions
Cu/saponite catalysts have been prepared, characterized and tested for soot combustion in this study, and the main conclusions achieved can be summarized as follows:
• The use of different methods for saponite synthesis led to supports and catalysts with different characteristics. The degree of delamination further affects copper dispersion and soot combustion capacity of the Cu/saponite catalysts.
• All Cu/saponite catalysts were active for soot combustion, and the best activity was achieved with the catalyst supported on the Na–saponite prepared at pH 13 and with surfactant. This best activity can be attributed to the most optimal copper oxide dispersion on the high surface area delaminated saponite and to the lower support acidity.
• The studied Cu/saponite catalysts accelerate soot combustion mainly by the NO2-assisted mechanism.
• Copper oxide reduction in H2-TPR experiments occurred at lower temperature for the Na-containing catalysts than for their H-containing counterparts, and all Cu/Na–saponite catalysts were more active for soot combustion than the corresponding Cu/H–saponite catalysts.
Acknowledgements
The financial support of Generalitat Valenciana (Project PROMETEOII/2014/010), Catalan Government (2014SGR1146), Spanish Ministry of Economy and Competitiveness (Projects CTQ2012-30703 and CTQ2011-24610) and UE (FEDER funding) is acknowledged.References
- C. Bisio, G. Gatti, E. Boccaleri, L. Marchese, G. B. Superti, H. O. Pastore and M. Thommes, Microporous Mesoporous Mater., 2008, 107, 90–101 CrossRef CAS.
- F. B. Gebretsadik, P. Salagre and Y. Cesteros, Appl. Clay Sci., 2014, 87, 170–178 CrossRef CAS.
- A. Gila, M. A. Vicente, J.-F. Lambert and L. M. Gandía, Catal. Today, 2001, 68, 41–51 CrossRef.
- K. Carrado and L. Xu, Microporous Mesoporous Mater., 1999, 27, 87–94 CrossRef CAS.
- T. Iwasaki, Y. Onodera and K. Torii, Clays Clay Miner., 1989, 37, 248–257 CAS.
- T. Sánchez, P. Salagre and Y. Cesteros, Microporous Mesoporous Mater., 2013, 171, 24–34 CrossRef.
- I. Vicente, P. Salagre, Y. Cesteros, F. Medina and J. E. Sueiras, Appl. Clay Sci., 2010, 48, 26–31 CrossRef CAS.
- D. Costenaro, G. Gatti, F. Carniato, G. Paul, C. Bisio and L. Marchese, Microporous Mesoporous Mater., 2012, 162, 159–167 CrossRef CAS.
- J. Velasco, E. Pérez-Mayoral, G. Mata, M. L. Rojas-Cervantes and M. A. Vicente-Rodríguez, Appl. Clay Sci., 2011, 54, 125–131 CrossRef CAS.
- J. Herney Ramirez, C. A. Costa, L. M. Madeira, G. Mata, M. A. Vicente, M. L. Rojas-Cervantes, A. J. Lopez-Peinado and R. M. Martın-Aranda, Appl. Catal., B, 2007, 71, 44–56 CrossRef.
- A. C. Garade, N. S. Biradar, S. M. Joshi, V. S. Kshirsagar, R. K. Jha and C. V. Rode, Appl. Clay Sci., 2011, 53, 157–163 CrossRef CAS.
- I. Vicente, P. Salagre and Y. Cesteros, Appl. Clay Sci., 2011, 53, 212–219 CrossRef CAS.
- R. Trujillano, E. Rico, M. A. Vicente, V. Rives, K. J. Ciuffi, A. Cestari, A. Gil and S. A. Korili, Appl. Clay Sci., 2011, 53, 326–330 CrossRef CAS.
- H. Kurokawa, M. Hayasaka, K. Yamamoto, T. Sakuragi, M. Ohshima and H. Miura, Catal. Commun., 2014, 47, 13–17 CrossRef CAS.
- J. P. A. Neeft, M. Makkee and J. A. Moulijn, Fuel Process. Technol., 1996, 47, 1–69 CrossRef CAS.
- M. M. Maricq, J. Aerosol Sci., 2007, 38, 1079–1118 CrossRef CAS.
- B. A. A. L. van Setten, M. Makkee and J. A. Moulijn, Catal. Rev. Sci. Eng., 2001, 43, 489–564 CAS.
- M. V. Twigg, Appl. Catal., B, 2007, 70, 2–15 CrossRef CAS.
- T. Sánchez, F. B. Gebretsadik, P. Salagre, Y. Cesteros, N. Guillén-Hurtado, A. García-García and A. Bueno-López, Appl. Clay Sci., 2013, 77–78, 40–45 CrossRef.
- F. B. Gebretsadik, D. Mance, M. Baldus, P. Salagre and Y. Cesteros, Appl. Clay Sci., 2015, 114, 20 CrossRef CAS.
- R. Trujillano, E. Rico, M. A. Vicente, M. Herrero and V. Rives, Appl. Clay Sci., 2010, 48, 32–38 CrossRef CAS.
- J. Srodon, Identification and quantitative analysis of clay minerals, in Handbook of Clay Science, ed. F. Bergaya, B. K. G. Theng and G. Lagaly, Elsevier, Amsterdam, 2006, vol. 1, pp. 765–787 Search PubMed.
- J. T. Kloprogge, S. Komarneni and J. E. Amonette, Clays Clay Miner., 1999, 47, 529–554 CAS.
- J. T. Kloprogge and R. L. Frost, Vib. Spectrosc., 2000, 23, 119–127 CrossRef CAS.
- J. D. Rusell and A. R. Fraser, Infrared methods, in Clay Mineralogy: Spectroscopic and Chemical Determinative Methods, ed. M. J. Wilson, Chapman & Hall, London, 1994, pp. 11–67 Search PubMed.
- A. Setiabudi, M. Makkee and J. A. Moulijn, Appl. Catal., B, 2004, 50, 185–194 CrossRef CAS.
- E. Moretti, M. Lenarda, L. Storaro, A. Talon, T. Montanari, G. Busca, E. Rodríguez, A. Jiménez, M. Turco and G. Bagnasco, Appl. Catal., A, 2008, 335, 46–55 CrossRef CAS.
- J. Z. Shyu, W. H. Weber and H. S. Ghandi, J. Phys. Chem., 1988, 92, 4964–4970 CrossRef CAS.
| This journal is © The Royal Society of Chemistry 2016 |

