CoP for hydrogen evolution: implications from hydrogen adsorption†
Received
9th June 2016
, Accepted 10th August 2016
First published on 10th August 2016
Abstract
Cobalt phosphide (CoP) is one of the most promising, earth-abundant electrocatalysts discovered to date for hydrogen evolution reaction (HER), yet the mechanism is not well understood. Since hydrogen adsorption is a key factor of HER activity, here we examine the adsorption of atomic hydrogen on the low-Miller-index surfaces of CoP, including (111), (110), (100), and (011), by using periodic density functional theory. From the calculated Gibbs free energy of adsorption, we predict that (111), (110), and (011) surfaces will have good catalytic activities for HER. From ab initio atomistic thermodynamics, we find that the stabilities of the surfaces at 1 atm H2 and 300 K follow the trend of (111) > (100) ∼ (110) ≫ (011). On the most stable (111) surface, both Co bridge sites and P top sites are found to be able to adsorb hydrogen with a close-to-zero free energy change and the synergy of proximal Co and P atoms on the surface results in a better HER activity. Our work provides important insights into CoP's excellent HER activity and a basis for further mechanistic understanding of HER on CoP and other transition-metal phosphides.
Introduction
Water splitting using renewable energy can provide a sustainable supply of fuel for future societies with hydrogen as a key energy carrier.1 To date, platinum remains the most efficient electrocatalyst for hydrogen evolution reaction (HER). However, the low natural abundance and high cost of platinum hamper its wide use at the industrial scale. Thus, it is highly desirable to develop efficient, low-cost and earth-abundant electrocatalysts for HER and an enormous amount of research efforts have been devoted to it over the past decade.
Transition metal phosphides have emerged as alternative materials for HER electrocatalysts due to their high catalytic activities compared to other non-precious electrocatalysts and their relatively low costs compared to platinum. For example, phosphides of nickel,2–13 cobalt,14–33 iron,34–38 copper,39 molybdenum,40–45 and tungsten46 have been found to electrocatalytically generate hydrogen with low overpotentials at operationally relevant current densities. In particular, the cobalt phosphide system, which has been studied extensively, exhibits high HER activities and high stabilities under strongly acidic conditions across a diverse group of morphologies, characteristic grain sizes, support materials, and synthetic preparations. Among these systems, multi-faceted single-crystalline cobalt phosphide (CoP) nanoparticles deposited on a titanium foil electrode exhibit outstanding activities, with overpotentials of only −70 and −85 mV (at a loading density of ∼2 mg cm−2) to produce cathodic current densities of −10 and −20 mA cm−2, respectively.14 Despite the exciting experimental results of CoP, the mechanism of HER on CoP is not well understood, which is essential for further improving the activities and stabilities of the HER electrocatalysts.
Two types of possible pathways have been proposed for the mechanism of HER in acid media: the Volmer–Heyrovsky vs. the Volmer–Tafel mechanism. The Volmer reaction refers to the initial adsorption of protons from the acid solution to form adsorbed H (H+ + e− → Had).47 In the Volmer–Heyrovsky mechanism, a solvated proton from the water layer reacts with one adsorbed surface hydrogen to form H2 (Had + H+ + e− → H2),48 while in the Volmer–Tafel mechanism, two adsorbed surface hydrogens next to each other react to form an H2 molecule (Had + Had → H2).49 Thus, good HER electrocatalysts should be able to attract protons from the solution, while still can desorb H2. Nørskov and coworkers have correlated experimental exchange currents with calculated hydrogen adsorption energies from density functional theory (DFT), where maximum activity is obtainable when Gibbs free energy of hydrogen adsorption (ΔGH) is zero.50 This is mainly because lower ΔGH results in a very strong binding of the atomic hydrogen and hinders desorption of H2, while higher ΔGH prevents the binding of atomic hydrogen on the catalyst surfaces. Both of them will slow the reaction. Therefore, ΔGH is considered as a good descriptor of HER activity, and good HER electrocatalysts are expected to have close-to-zero ΔGH.
To understand HER on CoP in particular and to provide insights and guidelines for designing transition metal phosphide HER electrocatalysts in general, herein we have studied in detail the adsorption structures and energetics of atomic hydrogen on several low-Miller-index surfaces of CoP from first principles DFT. We use the calculated ΔGH to predict the HER activities of the surfaces. We further employ ab initio atomistic thermodynamics to determine the most stable and active surface of CoP at 1 atm H2 pressure and 300 K.
Computational
Spin-polarized DFT calculations were performed by using the Vienna ab initio simulation package (VASP).51 The ion-electron interaction was described with the projector augmented wave (PAW) method.52 Electron exchange–correlation was represented by the functional of Perdew, Burke and Ernzerhof (PBE) of generalized gradient approximation (GGA).53 A cutoff energy of 400 eV was used for the plane-wave basis set. (111), (110), (100), and (011) surfaces were examined. About 10 Å thick slabs in (2 × 2) lateral cells with 15 Å of vacuum along the z-direction were used to model the adsorbate–surface systems for (111), (110), (100), and (011) surfaces; the Brillouin zone was sampled by (3 × 3 × 1) Monkhorst–Pack k-point mesh. Both the layer thickness and k-point mesh were tested to achieve a convergence of hydrogen adsorption energy within 0.04 eV. The top half of the slab was allowed to relax together with the adsorbed H atoms and the convergence threshold for structural optimization was set to be 0.025 eV Å−1 in force. Partial atomic charges were obtained using Bader charge analysis as implemented by Henkelman and co-workers.54 We also used a different method55 to derive the atomic charges based on the electrostatic potential, called the ESP charges.
Surface energies was determined by using
| |  | (1) |
where
Eslab is the total energy of the surface slab,
Ebulk is the total energy of the bulk unit cell (eV per CoP),
N is the number of unit formula in the slab, and
A is the surface area. The differential hydrogen adsorption energy Δ
EH was calculated by
| |  | (2) |
where
E(CoP +
nH) and
E[CoP + (
n − 1)H] represent the total energy of the CoP system with
n and
n − 1 adsorbed hydrogen atoms on the surface, respectively, and
E(H
2) represents the total energy of a gas phase H
2 molecule. A negative value of Δ
EH suggests favorable absorption. The differential Gibbs free energy of adsorption Δ
GH was obtained by
| | | ΔGH = ΔEH + ΔEZPE − TΔSH | (3) |
where Δ
EZPE is the difference in zero point energy between the adsorbed H and H in the gas phase H
2 molecule, and Δ
SH is the entropy difference between the adsorbed H and H
2 in the gas phase at standard conditions. To locate the most stable configuration for each coverage of H on a surface, we allowed the H atoms to first find the lowest energy sites and then fill the next lowest-energy sites and continue until the desired coverage was reached. In other words, we focused on finding the global minimum of hydrogen adsorption, with an assumption that the diffusion of H atoms on the surface would be facile and they always go to the lowest-energy sites.
Ab initio atomistic thermodynamics56 was used to identify the most stable phase of each surface at 1 atm H2 and 300 K. The Gibbs free energy of adsorption at a specific temperature and pressure ΔGad(T,p) was calculated by
| |  | (4) |
where
Etotal(
NH) is the total energy of the CoP system with
NH hydrogen atoms adsorbed on the surface,
Etotal(0) is the total energy of the clean CoP surface, and

is the total energy of a gas phase H
2 molecule. Δ
μH(
T,
p) is the chemical potential of hydrogen at different temperatures and pressures.
Eqn (4) allows one to plot the Gibbs free energy of adsorption as a function of the hydrogen chemical potential for a specific surface at a specific H coverage. At any given hydrogen chemical potential, the stability of these H-covered surfaces can then be compared. Δ
μH(
T,
p) is related to specific (
T,
p)-conditions by
| |  | (5) |
where Δ
μH(
T,
p0) is the hydrogen chemical potential at the standard pressure which can be looked up from the thermodynamic tables.
57
Results and discussion
We start with the bulk structure of CoP, followed by the clean surfaces including (111), (110), (100), and (011). We then examine and compare hydrogen adsorption on these surfaces.
Bulk CoP
Bulk CoP has a B31 or MnP-type structure, with a symmetry group of Pnma. In this type of structure, each metal atom is surrounded by six phosphorous atoms situated in a distorted octahedral configuration (Fig. 1a), while each phosphorous atom is surrounded by six metal atoms forming a highly distorted triangular prism (Fig. 1b). The experimental58 and calculated lattice parameters of bulk CoP are listed in Table 1. One can see that they are in good agreement.
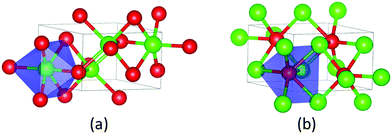 |
| | Fig. 1 Bulk CoP: (a) each Co atom is surrounded by six P atoms situated in a distorted octahedral configuration; (b) each P atom is surrounded by six Co atoms at the corners of a highly distorted triangular prism. Co, green; P, red. | |
Table 1 Comparison of experimental58 and calculated lattice parameters of the bulk CoP
| Lattice parameter |
a (Å) |
b (Å) |
c (Å) |
| Experimental |
5.077 |
3.281 |
5.587 |
| Calculated |
5.070 |
3.265 |
5.545 |
Clean surfaces
Low Miller-index surfaces are usually considered first in surface science studies due to their higher stabilities than higher index surfaces. We consider here four such surfaces: (111), (110), (100), and (011). Fig. 2 shows the structures of these clean CoP surfaces and Table 2 shows their calculated surface energies. One can see that the stabilities of the clean surfaces in vacuum follow the trend of (011) > (110) > (111) > (100). In general, surfaces with higher atom packing densities are expected to have higher stabilities. Here, we find that the surface packing densities of (011), (110), (111), and (100) are 25, 24, 24, and 22 atom per nm2, respectively, which indeed confirms the highest stability of the (011) surface and the lowest stability of the (100) surface. To learn the electronic structures of these surfaces, their electronic density of states (DOS) have been calculated. As shown in Fig. 3, they are all metallic and have non-zero DOS at the Fermi level. Being the most stable one, the (011) surface also has the lowest DOS at the Fermi level.
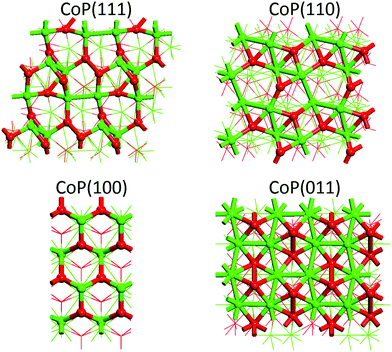 |
| | Fig. 2 Top views of clean CoP surfaces. Co, green; P, red. | |
Table 2 Calculated surface energies of clean CoP surfaces
| |
CoP(111) |
CoP(110) |
CoP(100) |
CoP(011) |
| Surface energy (meV Å−2) |
140.4 |
117.0 |
151.0 |
70.4 |
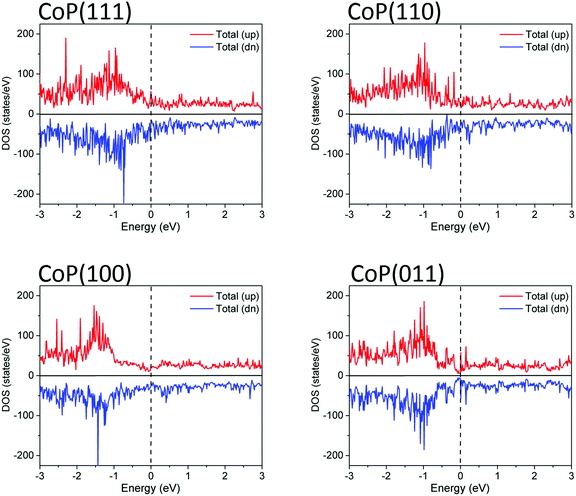 |
| | Fig. 3 Spin-polarized total electronic density of states (DOS) of clean CoP surfaces. The Fermi level (dashed line) is set as zero. | |
Hydrogen adsorption on the CoP(111) surface
As mentioned in the Introduction, ΔGH is considered as a descriptor of HER activity, and good HER electrocatalysts should have close-to-zero ΔGH. We next show the structures and ΔGH of H adsorption on the four CoP surfaces. Fig. 4 shows the calculated ΔGH and ΔEH for CoP(111) at different hydrogen coverages (here 100% coverage = 11 H-atom per nm2). ΔGH is more positive than ΔEH because ΔS is negative when referencing to the H2 state and the TΔS term is roughly constant at −0.18 eV across the coverage range. One can see that ΔGH is close-to-zero for 25–75% hydrogen coverage, indicating that the (111) surface will have good catalytic activity for HER at this coverage range. This supports the previous experimental finding that CoP nanostructures exposing predominately (111) surface have high HER activities.23 The other interesting finding of H adsorption on CoP(111) is that ΔGH shows a zigzag pattern with H coverage from 25% to 75%, which closely correlates with the adsorption sites, as discussed next.
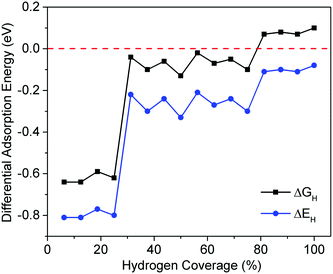 |
| | Fig. 4 Differential adsorption energy (ΔEH) and adsorption free energy (ΔGH) as a function of hydrogen coverage on CoP(111). | |
Fig. 5 shows the optimized structures of CoP(111) with different hydrogen coverages. We find four types of stable hydrogen adsorption sites on CoP(111). For the first 25% hydrogen atoms, they are strongly adsorbed at cobalt bridge sites. During 25–75% hydrogen coverage, there is an alternative adsorption between cobalt bridge sites and phosphorous top sites, leading to a zigzagged ΔGH with a small fluctuation. More important, ΔGH is close-to-zero during this range, so both cobalt bridge sites and phosphorous top sites could be the active sites for HER on the (111) surface. For the 75% to 100% coverage, the extra hydrogen atoms are adsorbed at cobalt top sites, leading to more than one hydrogen atoms on some cobalt atoms.
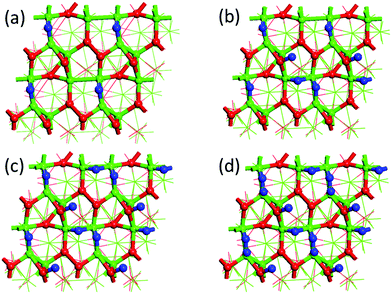 |
| | Fig. 5 Optimized structures of CoP(111) at different H coverages: (a) 25%; (b) 50%; (c) 75%; (d) 100%. 100% coverage = 11 H-atom per nm2. H, blue; Co, green; P, red. | |
The “zigzag” pattern between 25% and 75% hydrogen coverage suggests a synergy between proximal cobalt and phosphorous sites in adsorbing H atoms, conductive to HER. To understand this behavior, Table 3 shows differential hydrogen adsorption energies (ΔEH) at the phosphorous top site at 0% and 31% hydrogen coverages. One can see that when there is no hydrogen adsorbed on Co (0%), the interaction of H with P is weak but when there are hydrogens already adsorbed on Co (31%), the H–P interaction becomes stronger. In other words, hydrogen adsorption at Co facilitates hydrogen adsorption at P. We found that this is due to the weakening of the Co–P bond induced by hydrogen adsorption on Co, as evidenced by the increasing Co–P bond length, which results in less negative charge on P (both Bader54 and ESP55 charges show the same trend) and stronger H–P covalent bonding. This synergy between Co and P for adsorbing H, as shown in Scheme 1, could be a key to CoP's high HER activity.
Table 3 Differential hydrogen adsorption energies (ΔEH) at the P site, Co–P bond length (rCo–P), and partial atomic charges on P at 0% and 31% hydrogen coverages from Bader analysis (PBader) and electrostatic potential (PESP)
| Hydrogen coverage |
0% |
31% |
| ΔEH (eV) |
−0.10 |
−0.30 |
|
r
Co–P (Å) |
2.125 |
2.197 |
|
P
Bader (|e|) |
−0.257 |
−0.213 |
|
P
ESP (|e|) |
−0.308 |
−0.266 |
 |
| | Scheme 1 The synergy between Co and P on CoP(111) in adsorbing H at medium coverage. | |
To evaluate the most stable coverage of H on CoP(111) at the experimental HER conditions (1 atm H2 and 300 K), we used ab initio atomistic thermodynamics to determine ΔGad(T,p) as a function of hydrogen chemical potential (ΔμH) or pressure at T = 300 K. Fig. 6 shows the calculated ΔGad(T,p) vs. ΔμH relationship: each line represents a given H coverage. One can see that at extremely low hydrogen pressure, clean surface is the most stable, while at very high hydrogen pressure, 100% hydrogen coverage is the most stable (Fig. 6a). At ambient pressures, Fig. 6b shows that 75% hydrogen coverage is the most stable with ΔGad = −19.53 meV Å−2 at 1 atm. At this coverage, both Co and P sites adsorb H.
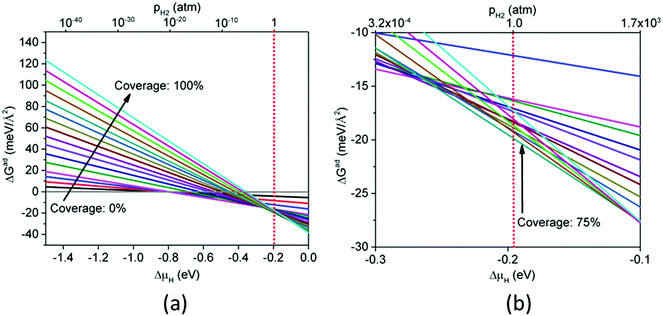 |
| | Fig. 6 Gibbs free energy of adsorption (ΔGad) at 300 K as a function of hydrogen chemical potential (ΔμH) or H2 pressure for CoP(111) with different hydrogen coverages: (a) ΔμH from −1.5 to 0 eV; (b) ΔμH from −0.3 to −0.1 eV. | |
Hydrogen adsorption on the CoP(110) surface
Fig. 7 shows ΔGH and ΔEH for the CoP(110) surface at different hydrogen coverages (100% coverage = 12 H-atom per nm2). For a favorable adsorption (ΔGH < 0), we found that ΔGH is close to zero when hydrogen coverage is in the range of 25–50% (ΔGH ∼ −0.10 eV). When hydrogen coverage is above 50%, ΔGH is slightly positive but also close to zero. Fig. 7 suggests that the CoP(110) surface can also be good for HER activity for a large range of H coverage. Fig. S1 (ESI†) shows the optimized structures of CoP(110) at different hydrogen coverages. From 0% to 100% coverage, hydrogen atoms occupy cobalt bridge sites, phosphorous top sites, cobalt top sites, and another kind of cobalt top sites successively. Fig. 8 plots ΔGad as a function of ΔμH for CoP(110) at different hydrogen coverages. One can see that 50% hydrogen coverage is the most stable at 1 atm and 300 K with ΔGad = −13.37 meV Å−2. At this coverage, Fig. 7 and Fig. S1 (in the ESI†) suggest that both the P and Co top sites are most likely to be active for HER.
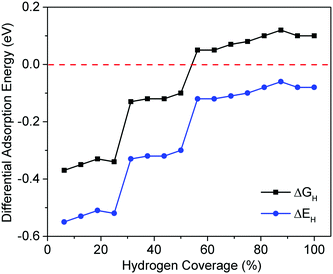 |
| | Fig. 7 Differential adsorption energy (ΔEH) and adsorption free energy (ΔGH) as a function of hydrogen coverage on CoP(110). | |
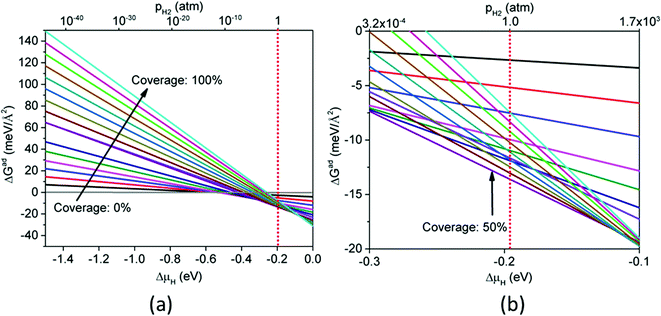 |
| | Fig. 8 Gibbs free energy of adsorption (ΔGad) at 300 K as a function of hydrogen chemical potential (ΔμH) or H2 pressure for CoP(110) with different hydrogen coverages: (a) ΔμH from −1.5 to 0 eV; (b) ΔμH from −0.3 to −0.1 eV. | |
Hydrogen adsorption on the CoP(100) surface
Fig. 9a shows ΔGH and ΔEH for CoP(100) at different hydrogen coverages. One can see that there is no H coverage where ΔGH ∼ 0, so CoP(100) is not likely to be good for HER. Fig. S2 in ESI† shows the optimized structures of CoP(100) with different hydrogen coverages. We find two types of stable hydrogen adsorption sites on CoP(100): cobalt bridge sites for the first 33% hydrogen atoms and cobalt top sites for the following 67% hydrogen atoms. Unlike (111) and (110) surfaces, only cobalt atoms adsorb hydrogen on the (100) surface. This might be the reason why we do not find ΔGH ∼ 0 on CoP(100). Fig. 9b plots ΔGad as a function of ΔμH for CoP(100) and we find that 33% hydrogen coverage is the most stable at 1 atm and 300 K with ΔGad = −13.56 meV Å−2.
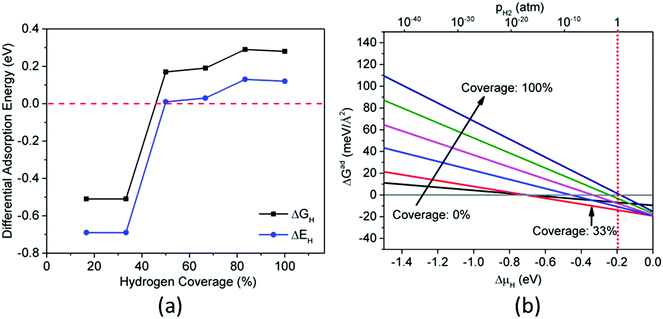 |
| | Fig. 9 (a) Differential adsorption energy (ΔEH) and adsorption free energy (ΔGH) as a function of hydrogen coverage on CoP(100). (b) Plots of the calculated Gibbs free energy of adsorption (ΔGad) at 300 K as a function of hydrogen chemical potential (ΔμH) for CoP (100) surface with different hydrogen coverages. | |
Hydrogen adsorption on the CoP(011) surface
Fig. 10a shows ΔGH and ΔEH for CoP(011) at different hydrogen coverages. One can see that the adsorption of H on CoP(011) is in general much weaker than on the other three surfaces. On the other hand, this leads to a quite large range of H coverages from 0 to 50% where ΔGH ∼ 0, indicating that CoP(011) may have good activity for HER. Fig. S3 in ESI† shows the optimized structures of CoP(011) surface at different hydrogen coverages. We find two types of stable hydrogen adsorption sites on CoP(011). The first 50% coverage of hydrogen atoms prefer phosphorous top sites with ΔGH ∼ 0, so phosphorous top sites could be the active sites for HER on the (011) surface. This is in agreement with a recent study.33 The last 50% coverage of hydrogen atoms occupy cobalt bridge sites. Fig. 10b plots ΔGad as a function of ΔμH for CoP(011) at different hydrogen coverages. One can see that 25% hydrogen coverage is the most stable phase at 1 atm and 300 K with ΔGad ∼ 0 meV Å−2, while the clean surface is only slightly higher in energy. This again agrees with the fact that the adsorption of H on CoP(011) is rather weak.
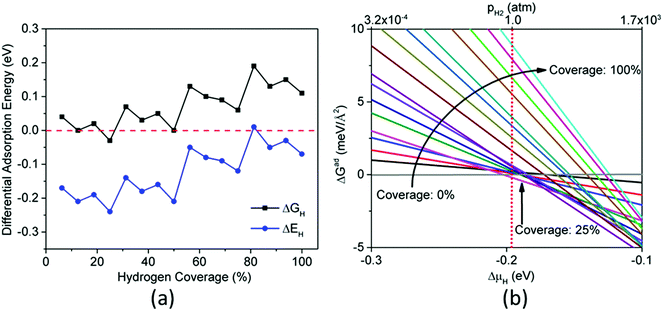 |
| | Fig. 10 (a) Differential adsorption energy (ΔEH) and adsorption free energy (ΔGH) as a function of hydrogen coverage on CoP(111). (b) Gibbs free energy of adsorption (ΔGad) at 300 K as a function of hydrogen chemical potential (ΔμH) or H2 pressure for CoP(011) with different hydrogen coverages. | |
Comparison of (111), (110), (100), and (011) surfaces of CoP
Now that we have studied hydrogen adsorption on the four low Miller-index surfaces of CoP, we can compare them together in terms of stability and HER activity. Using ΔGH ∼ 0 as a criterion, we predict that (111), (110), and (011) surfaces of CoP should have good catalytic activities for HER, while (100) should not. Taking into account ab initio atomistic thermodynamics, Table 4 shows the comparison of ΔGad at 1 atm H2 and 300 K for the most stable coverage of each surface. One can see that CoP(111) has the most negative ΔGad followed by (100) and (110), while (011) has a close-to-zero ΔGad. In other words, at the reaction conditions, the stability trend is (111) > (100) ∼ (110) ≫ (011). From this perspective, we think that the CoP(111) surface is the most promising facet for high-activity HER.
Table 4 Hydrogen adsorption free energies (ΔGad) at 1 atm and 300 K of the most stable coverage for each CoP surface
| |
CoP(111) |
CoP(110) |
CoP(100) |
CoP(011) |
| ΔGad (meV Å−2) |
−19.53 |
−13.37 |
−13.56 |
−0.08 |
Our present DFT study of the adsorption of atomic hydrogen on the low-Miller-index surfaces of CoP, including (111), (110), (100), and (011), presents several interesting implications. First, CoP nanostructures that expose different crystal facets would be expected to exhibit different activities for HER catalysis. From our calculated ΔGH, we predict that (111), (110), and (011) surfaces of CoP will have good catalytic activities for HER. So experimental researchers could prepare highly branched nanostructures that expose a high density of these surfaces. Second, both Co and P on the surfaces play important roles in catalyzing HER. Particularly, on (111) surface, both Co bridge sites and P top sites are found to be able to adsorb hydrogen with a close-to-zero free energy change, indicating that the synergy of proximal Co and P atoms on the surface can result in a better HER activity. Third, hydrogen coverage, pressure, and temperature all have effects on the stabilities of the surfaces. We find that the stabilities of the clean surfaces in vacuum are different from the stabilities at 1 atm H2 and 300 K. The stabilities of the clean surfaces in vacuum follow the trend of (011) > (110) > (111) > (100), while the stabilities of the surfaces at 1 atm H2 and 300 K follow the trend of (111) > (100) ∼ (110) ≫ (011). This suggests that if one purposefully prepares the catalyst with the (111) facet, then the catalyst is likely to have a longer lifetime given its high stability during the reaction conditions, while the (011) surface might transform to other more stable surfaces under reaction conditions.
Although the present work focuses on the thermodynamics of HER on different CoP surfaces from computed H adsorption free energy, our results also have interesting implications for the reaction rates. For example, 75% coverage of hydrogen on CoP(111) would be very helpful for the Volmer–Tafel mechanism, as higher surface coverage would increase the chances for two adsorbed hydrogens next to each other to react and form an H2 molecule. We plan to study the detailed mechanism of HER on CoP surfaces to examine the effect of coverage on reaction kinetics, as recently done for HER on MoS2.59
Conclusions
To shed light on the activity of hydrogen evolution reaction (HER) on CoP, we have studied the adsorption of atomic hydrogen on the low-Miller-index surfaces of CoP, including (111), (110), (100), and (011), by using periodic DFT. From the calculated ΔGH, we predict that (111), (110), and (011) surfaces will have good catalytic activities for HER. From ab initio atomistic thermodynamics, we find that the stabilities of the surfaces at 1 atm H2 and 300 K follow the trend of (111) > (100) ∼ (110) ≫ (011). So combining ΔGH and stability, we conclude that the (111) surface of CoP is the most promising facet for high and long-lived HER activity. The key feature of hydrogen adsorption on the (111) is that both Co bridge sites and P top sites are able to adsorb hydrogen with a close-to-zero free energy change and that there is a synergy of proximal Co and P atoms on the CoP(111) surface in adsorbing hydrogen. These insights open a door for further mechanistic understanding of HER on CoP and other phosphides.
Acknowledgements
This work was supported by the University of California, Riverside. G. H. thanks Dr Ziqi Tian for help with calculation of ESP charges. This research used resources of the National Energy Research Scientific Computing Center, a DOE Office of Science User Facility supported by the Office of Science of the U.S. Department of Energy under Contract DE-AC02-05CH11231.
References
- W. Lubitz and W. Tumas, Chem. Rev., 2007, 107, 3900–3903 CrossRef CAS PubMed
 .
.
- P. Liu and J. A. Rodriguez, J. Am. Chem. Soc., 2005, 127, 14871–14878 CrossRef CAS PubMed
 .
.
- E. J. Popczun, J. R. McKone, C. G. Read, A. J. Biacchi, A. M. Wiltrout, N. S. Lewis and R. E. Schaak, J. Am. Chem. Soc., 2013, 135, 9267–9270 CrossRef CAS PubMed
 .
.
- L. Feng, H. Vrubel, M. Bensimon and X. Hu, Phys. Chem. Chem. Phys., 2014, 16, 5917–5921 RSC
 .
.
- Z. Huang, Z. Chen, Z. Chen, C. Lv, H. Meng and C. Zhang, ACS Nano, 2014, 8, 8121–8129 CrossRef CAS PubMed
 .
.
- A. Laursen, K. Patraju, M. Whitaker, M. Retuerto, T. Sarkar, N. Yao, K. Ramanujachary, M. Greenblatt and G. Dismukes, Energy Environ. Sci., 2015, 8, 1027–1034 CAS
 .
.
- X. Wang, Y. V. Kolen'ko, X. Q. Bao, K. Kovnir and L. Liu, Angew. Chem., Int. Ed., 2015, 54, 8188–8192 CrossRef CAS PubMed
 .
.
- Y. Pan, N. Yang, Y. Chen, Y. Lin, Y. Li, Y. Liu and C. Liu, J. Power Sources, 2015, 297, 45–52 CrossRef CAS
 .
.
- Z. Cai, X. Song, Y. Wang and X. Chen, ChemElectroChem, 2015, 2, 1665–1671 CrossRef CAS
 .
.
- J. Li, J. Li, X. Zhou, Z. Xia, W. Gao, Y. Ma and Y. Qu, ACS Appl. Mater. Interfaces, 2016, 8, 10826–10834 CAS
 .
.
- X. Wang, W. Li, D. Xiong, D. Y. Petrovykh and L. Liu, Adv. Funct. Mater., 2016, 26, 4067–4077 CrossRef CAS
 .
.
- N. Jiang, B. You, M. Sheng and Y. Sun, ChemCatChem, 2016, 8, 106–112 CrossRef CAS
 .
.
- B. You, N. Jiang, M. Sheng, M. W. Bhushan and Y. Sun, ACS Catal., 2016, 6, 714–721 CrossRef CAS
 .
.
- E. J. Popczun, C. G. Read, C. W. Roske, N. S. Lewis and R. E. Schaak, Angew. Chem., Int. Ed., 2014, 53, 5427–5430 CrossRef CAS PubMed
 .
.
- J. Tian, Q. Liu, A. M. Asiri and X. Sun, J. Am. Chem. Soc., 2014, 136, 7587–7590 CrossRef CAS PubMed
 .
.
- P. Jiang, Q. Liu, C. Ge, W. Cui, Z. Pu, A. M. Asiri and X. Sun, J. Mater. Chem. A, 2014, 2, 14634–14640 CAS
 .
.
- Q. Liu, J. Tian, W. Cui, P. Jiang, N. Cheng, A. M. Asiri and X. Sun, Angew. Chem., Int. Ed., 2014, 126, 6828–6832 CrossRef
 .
.
- Z. Pu, Q. Liu, P. Jiang, A. M. Asiri, A. Y. Obaid and X. Sun, Chem. Mater., 2014, 26, 4326–4329 CrossRef CAS
 .
.
- F. H. Saadi, A. I. Carim, E. Verlage, J. C. Hemminger, N. S. Lewis and M. P. Soriaga, J. Phys. Chem. C, 2014, 118, 29294–29300 CAS
 .
.
- Q. Li, Z. Xing, A. M. Asiri, P. Jiang and X. Sun, Int. J. Hydrogen Energy, 2014, 39, 16806–16811 CrossRef CAS
 .
.
- H. Du, Q. Liu, N. Cheng, A. M. Asiri, X. Sun and C. M. Li, J. Mater. Chem. A, 2014, 2, 14812–14816 CAS
 .
.
- Z. Huang, Z. Chen, Z. Chen, C. Lv, M. G. Humphrey and C. Zhang, Nano Energy, 2014, 9, 373–382 CrossRef CAS
 .
.
- E. J. Popczun, C. W. Roske, C. G. Read, J. C. Crompton, J. M. McEnaney, J. F. Callejas, N. S. Lewis and R. E. Schaak, J. Mater. Chem. A, 2015, 3, 5420–5425 CAS
 .
.
- J. F. Callejas, C. G. Read, E. J. Popczun, J. M. McEnaney and R. E. Schaak, Chem. Mater., 2015, 27, 3769–3774 CrossRef CAS
 .
.
- L. Li, X. Li, L. Ai and J. Jiang, RSC Adv., 2015, 5, 90265–90271 RSC
 .
.
- J. A. Vigil and T. N. Lambert, RSC Adv., 2015, 5, 105814 RSC
 .
.
- N. Jiang, B. You, M. Sheng and Y. Sun, Angew. Chem., Int. Ed., 2015, 54, 6251–6254 CrossRef CAS PubMed
 .
.
- B. You, N. Jiang, M. Sheng, S. Gul, J. Yano and Y. Sun, Chem. Mater., 2015, 27, 7636–7642 CrossRef CAS
 .
.
- M. Liu and J. Li, ACS Appl. Mater. Interfaces, 2016, 8, 2158–2165 CAS
 .
.
- Y. Pan, Y. Lin, Y. Chen, Y. Liu and C. Liu, J. Mater. Chem. A, 2016, 4, 4745–4754 CAS
 .
.
- H. Huang, C. Yu, J. Yang, C. Zhao, X. Han, Z. Liu and J. Qiu, ChemElectroChem, 2016, 3, 719–725 CrossRef CAS
 .
.
- Y. Tan, H. Wang, P. Liu, C. Cheng, F. Zhu, A. Hirata and M. Chen, Adv. Mater., 2016, 28, 2951–2955 CrossRef CAS PubMed
 .
.
- D.-H. Ha, B. Han, M. Risch, L. Giordano, K. P. C. Yao, P. Karayaylali and Y. Shao-Horn, Nano Energy, 2016 DOI:10.1016/j.nanoen.2016.04.034
 .
.
- J. F. Callejas, J. M. McEnaney, C. G. Read, J. C. Crompton, A. J. Biacchi, E. J. Popczun, T. R. Gordon, N. S. Lewis and R. E. Schaak, ACS Nano, 2014, 8, 11101–11107 CrossRef CAS PubMed
 .
.
- P. Jiang, Q. Liu, Y. Liang, J. Tian, A. M. Asiri and X. Sun, Angew. Chem., Int. Ed., 2014, 53, 12855–12859 CrossRef CAS PubMed
 .
.
- Y. Yan, B. Y. Xia, X. Ge, Z. Liu, A. Fisher and X. Wang, Chemistry, 2015, 21, 18062–18067 CrossRef CAS PubMed
 .
.
- C. Lv, Z. Peng, Y. Zhao, Z. Huang and C. Zhang, J. Mater. Chem. A, 2016, 4, 1454–1460 CAS
 .
.
- C. Y. Son, I. H. Kwak, Y. R. Lim and J. Park, Chem. Commun., 2016, 52, 2819–2822 RSC
 .
.
- J. Tian, Q. Liu, N. Cheng, A. M. Asiri and X. Sun, Angew. Chem., Int. Ed., 2014, 53, 9577–9581 CrossRef CAS PubMed
 .
.
- P. Xiao, M. A. Sk, L. Thia, X. Ge, R. J. Lim, J.-Y. Wang, K. H. Lim and X. Wang, Energy Environ. Sci., 2014, 7, 2624–2629 CAS
 .
.
- J. M. McEnaney, J. C. Crompton, J. F. Callejas, E. J. Popczun, A. J. Biacchi, N. S. Lewis and R. E. Schaak, Chem. Mater., 2014, 26, 4826–4831 CrossRef CAS
 .
.
- Z. Xing, Q. Liu, A. M. Asiri and X. Sun, Adv. Mater., 2014, 26, 5702–5707 CrossRef CAS PubMed
 .
.
- C. Deng, F. Ding, X. Li, Y. Guo, W. Ni, H. Yan, K. Sun and Y.-M. Yan, J. Mater. Chem. A, 2016, 4, 59–66 CAS
 .
.
- Z. Yao, Y. Su, C. Lu, C. Yang, Z. Xu, J. Zhu, X. Zhuang and F. Zhang, New J. Chem., 2016, 40, 6015–6021 RSC
 .
.
- Z. Pu, S. Wei, Z. Chen and S. Mu, Appl. Catal., B, 2016, 196, 193–198 CrossRef CAS
 .
.
- J. M. McEnaney, J. C. Crompton, J. F. Callejas, E. J. Popczun, C. G. Read, N. S. Lewis and R. E. Schaak, Chem. Commun., 2014, 50, 11026–11028 RSC
 .
.
- T. Erdey-Gruz and M. Volmer, Z. Phys. Chem. A, 1930, 150, 203 CAS
 .
.
- J. Heyrovský, Recl. Trav. Chim. Pays-Bas, 1927, 46, 582–585 CrossRef
 .
.
- J. Tafel, Z. Phys. Chem., 1905, 50, 641 CAS
 .
.
- J. K. Nørskov, T. Bligaard, A. Logadottir, J. R. Kitchin, J. G. Chen, S. Pandelov and U. Stimming, J. Electrochem. Soc., 2005, 152, J23–J26 CrossRef
 .
.
- G. Kresse and J. Furthmüller, Phys. Rev. B: Condens. Matter Mater. Phys., 1996, 54, 11169–11186 CrossRef CAS
 .
.
- P. E. Blöchl, Phys. Rev. B: Condens. Matter Mater. Phys., 1994, 50, 17953–17979 CrossRef
 .
.
- J. P. Perdew, K. Burke and M. Ernzerhof, Phys. Rev. Lett., 1996, 77, 3865–3868 CrossRef CAS PubMed
 .
.
- W. Tang, E. Sanville and G. Henkelman, J. Phys.: Condens. Matter, 2009, 21, 084204 CrossRef CAS PubMed
 .
.
- C. Campaná, B. Mussard and T. K. Woo, J. Chem. Theory Comput., 2009, 5, 2866–2878 CrossRef PubMed
 .
.
-
J. Rogal and K. Reuter, Experiment, Modeling and Simulation of Gas Surface Interactions for Reactive Flows in Hypersonic Flights, 2007, pp. 2-1–2-18 Search PubMed
 .
.
-
D. R. Stull and H. Prophet, JANAF thermochemical tables, DTIC Document, 1971.
- S. Rundqvist, Acta Chem. Scand., 1962, 16, 287–292 CrossRef CAS
 .
.
- Q. Tang and D. E. Jiang, ACS Catal., 2016, 6, 4953–4961 CrossRef
 .
.
Footnote |
| † Electronic supplementary information (ESI) available. See DOI: 10.1039/c6cp04011j |
|
| This journal is © the Owner Societies 2016 |
Click here to see how this site uses Cookies. View our privacy policy here.  Open Access Article


 is the total energy of a gas phase H2 molecule. ΔμH(T,p) is the chemical potential of hydrogen at different temperatures and pressures. Eqn (4) allows one to plot the Gibbs free energy of adsorption as a function of the hydrogen chemical potential for a specific surface at a specific H coverage. At any given hydrogen chemical potential, the stability of these H-covered surfaces can then be compared. ΔμH(T,p) is related to specific (T,p)-conditions by


.
.
.
.
.
.
.
.
.
.
.
.
.
.
.
.
.
.
.
.
.
.
.
.
.
.
.
.
.
.
.
.
.
.
.
.
.
.
.
.
.
.
.
.
.
.
.
.
.
.
.
.
.
.
.
.
.
.


