Separation of dynamic and nondynamic correlation
Received
6th May 2016
, Accepted 18th July 2016
First published on 29th July 2016
Abstract
The account of electron correlation and its efficient separation into dynamic and nondynamic parts plays a key role in the development of computational methods. In this paper we suggest a physically-sound matrix formulation to split electron correlation into dynamic and nondynamic parts using the two-particle cumulant matrix and a measure of the deviation from idempotency of the first-order density matrix. These matrices are applied to a two-electron model, giving rise to a simplified electron correlation index that (i) depends only on natural orbitals and their occupancies, (ii) can be straightforwardly decomposed into orbital contributions and (iii) splits into dynamic and nondynamic correlation parts that (iv) admit a local version. These expressions are shown to account for dynamic and nondynamic correlation in a variety of systems containing different electron correlation regimes, thus providing the first separation of dynamic and nondynamic correlation using solely natural orbital occupancies.
1 Introduction
The account of electron correlation effects—i.e., the interaction between electrons in a quantum system—is still a most important challenge in current computational chemistry.1–4 Many different properties are affected by electron correlation, including bond stretching and dissociation, electron delocalization or antiferromagnetic interactions. The issue has been addressed from multiple perspectives, giving rise to a manifold of methods to calculate the energy of a molecular system. Each method has its own way to tackle the problem and, to some extent, recover electron correlation effects. There are multiple phenomena behind electron correlation, which have been largely studied in the past sixty years.2–10 As a result, nowadays terms such as short-range, long-range, dynamic,11 nondynamic, static,12 left-right, in-out, radial or angular13 correlation belong to the jargon that computational chemists use to analyze the missing electron correlation effects of a given method in the description of quantum systems.
Perhaps the most well-known classification of electron correlation types is done in terms of dynamic and nondynamic electron correlation.11 A method is said to include dynamic correlation if its wavefunction, calculated as a configuration interaction (CI) expansion, includes a most dominant configuration and only small (but energetically important) contributions of other configurations. Conversely, nondynamic correlation arises when there are two or more important configurations, usually in the presence of degeneracies or near-degeneracies. Nondynamic correlation is regarded as a system-specific contribution, whereas dynamic electron correlation is accepted to be a rather universal contribution.11,14 Some authors12 distinguish between nondynamic and static correlation and define static correlation as the nondynamic correlation required to provide a correct zeroth-order description as dictated by spin and symmetry considerations, whereas nondynamic correlation is reserved for other situations such as the separation of molecules into fragments or the description of some excited states. In this paper we will use the term nondynamic correlation in a wide sense, comprising both static and (pure) nondynamic effects, i.e., all the electron correlation that is not dynamic. Interestingly, many popular methods introduce mainly either one or the other correlation type, and therefore, a large number of computational approaches can be classified as either dynamic- or nondynamic-correlation including methods. For instance, truncated CI and coupled-cluster (CC) wavefunctions give a good account of dynamic correlation, while multiconfiguration (MC) wavefunctions introduce mostly nondynamic correlation. Back in the 90's different diagnostic tools were put forward in order to evaluate the extent of dynamic and nondynamic correlation included in computational methods. For instance, the so-called T1 diagnostic of Lee and coworkers,15,16 the less-known D1 diagnostic17 and subsequent modifications18 have been widely used to measure the importance of nondynamic correlation in coupled-cluster wave functions. Cioslowski also developed the differential density matrix overlap (DDMO) for the assessment of electron correlation effects.19 The development of new cost-efficient computational methods has often consisted in the inclusion of dynamic or nondynamic correlation to an existing approach that already incorporates the other correlation type. This has given rise to a plethora of procedures such as second-order perturbation theory from complete active space wavefunctions (CASPT2),20 multireference configuration interactions with single and double excitations (MRCI-SD)21 or the antihermitian contracted Schrödinger equation (ACSE).22,23 The mixing of two existing computational approximations has also resulted in the construction of hybrid methods, often combining density functional theory (DFT) and wavefunction techniques.24,25 Range-separated methods,26 which provide a scheme to merge short and long-range correlation, or (local)27 hybrid density functionals,28,29 which use orbital-based Hartree–Fock exchange mixed with DFT exchange are just two examples. These methods use optimally-chosen mixing parameters or local mixing functions (LMF) to ponderate the ingredients combined. The mixture of exact exchange and density functional approximations should be determined according to the properties of each system30 or, even better, using a LMF that depends on the features of the target molecule.27,31 The admixture is rationalized as a balance between the simulation of long-range nondynamic correlation effects (included by the DFT exchange, usually through the generalized-gradient approximation) and the self-interaction correction (exact exchange),2 whereas the inclusion of dynamic correlation effects is given by a local correlation functional multiplied by a mixing parameter. Range-separated functionals32 depend on attenuating parameters that have been likewise shown to be system specific.33 The key question in local hybrid functionals is the choice of the LMF, determining the local relative contributions of exact and DFT exchange. Several possibilities have been explored,34,35 including the ratio of von Weizsäcker and the exact kinetic energy densities27 and the correlation length,36 which are related to the local contribution to electron correlation.37 Despite the promising results obtained, no optimal LMF providing good results in both thermodynamics and kinetic benchmark tests has been found thus far.36,38
The account of electron correlation and its efficient separation into dynamic and nondynamic effects thus plays a key role in many situations. Grimme et al. have recently put forward a local measure of nondynamic correlation based on fractional orbital occupations within finite-temperature DFT,39 Reiher and coworkers suggested orbital entaglement measures to evaluate the nondynamic correlation in density-matrix renormalization group (DMRG)40 and Raeber and Mazziotti have proposed a global indicator of the off-diagonal long-range order correlation.41 To our knowledge, it does not exist a measure of electron correlation that can be split into dynamic and nondynamic counterparts and admits a local decomposition. Such indicator can be obviously used to assess the relative importance of dynamic and nondynamic correlation effects but it can also aid the development of new computational methods either by exploring the local character of dynamic electron correlation in local methods42,43 or by affording a new means to mix the components of hybrid methods.26 In this paper we develop a general expression to account for electron correlation effects that can be decomposed into dynamic and nondynamic parts. The expression is applied to a two-electron model, giving rise to a simplified expression that (i) depends only on natural orbitals and their occupancies, (ii) can be straightforwardly decomposed into orbital contributions, (iii) can be split into dynamic and nondynamic correlation contributions and (iv) all its contributions admit a local version. This expression is finally shown to account for dynamic and nondynamic correlation in several molecular systems, thus validating its applicability beyond the model system.
2 Precedents
It is not straightforward, and perhaps even impossible, to make a clear-cut separation between dynamic and nondynamic electron correlation.44 The increase of electron excitations in a CI or CC wavefunction eventually introduces some nondynamic correlation effects, whereas the increase of the number of configurations in a MC wavefunction at some point should also include dynamic correlation. However, since the source of these electron correlation types (and, therefore the way to account for them) is so different, it becomes essential to have simple expressions to distinguish one from the other. Unfortunately, there are few simple computational expressions in the literature that can provide a quantitative analysis of dynamic and nondynamic correlation effects. One of the first such separations is due to Cioslowski45 and it was, subsequently, generalized by Ludeña and coworkers.46,47Fig. 1 summarizes the main idea. The uppermost left corner corresponds to the Hartree–Fock (HF) energy, which is connected to the opposite corner—the non-relativistic full-CI (FCI) energy—by the correlation energy. One can also cover the distance between HF and FCI in two steps by following two different paths,| | | ECORR = E(I)ND + E(I)D = E(II)D + E(II)ND. | (1) |
Cioslowski45 suggested to calculate the FCI energy with a density-constrained approach that selects the FCI wavefunction reproducing the HF density, i.e., EFCI[ρHF]. The step from EHF to EFCI[ρHF] corresponds to path dI in Fig. 1, and it is expected to retrieve only the dynamic correlation because it uses the expression for an exact wavefunction but its electron density is restricted to the HF one. On the contrary, the relaxation process that permits global changes in the wavefunction as the electron density transforms from HF density to FCI one (path ndI), should account for nondynamic correlation. Ludeña suggested the path II that goes through EHF[ρFCI], which is a HF calculation using a single-determinant wavefunction restricted to reproduce the FCI density. Path II recovers first nondynamic and afterwards dynamic correlation. Cioslowski's definition is preferred because it provides a decomposition of electron correlation into nonpositive contributions, whereas Ludeña's definition provides nonnegative electron correlation values, namely, ndII > 0. Notwithstanding, both approaches afford an exact decomposition of the electron correlation energy and provide a similar description of dynamic and nondynamic correlation.46,47 Despite the physically-soundness of these methods, in practice, they require expensive FCI calculations that prevent their application beyond few-electron species. A more practical realization of dynamic/nondynamic separation is due to Handy and coworkers,48 who suggested that a full-valence complete active space self-consistent field (CASSCF) calculation could be used as a reference wavefunction that only includes the nondynamic correlation energy, giving rise to the following separation of dynamic and nondynamic correlation energy,| | | ECORR = EFCI − EHF = EHND + EHD = (ECASSCF − EHF) + (EFCI − ECASSCF) | (2) |
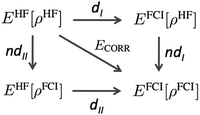 |
| | Fig. 1 Correlation energy diagram. Path I follows Cioslowski's decomposition of the electron correlation and path II is due to Ludeña and coworkers. Adapted from ref. 46. | |
This expression for dynamic correlation energy actually coincides with the electron correlation energy definition suggested by Davidson some years earlier.49
Cioslowski's, Handy's and Ludeña's are schemes that afford the separation of dynamic and nondynamic correlation energies. There are very few other quantitative indicators of electron correlation and, to the best of our knowledge, there is no other measure that can quantify the relative importance of both effects. Ugalde and coworkers suggested the use of the intracule densities to obtain a separation of dynamic and nondynamic correlation effects50 but their approach, in the spirit of Handy's, also relies on a user-defined wavefunction that contains nondynamic electron correlation effects.
It would be more convenient if the separation of dynamic and nondynamic correlation would not depend on the definition of a wavefunction containing only nondynamic correlation effects. First of all, such definition is always arbitrary and, in some cases (see the discussion on H2, LiH and Li2 below), difficult to construct. Besides, an approach that allows the separation of electron correlation is more convenient than an energy-decomposition scheme because it could be used to split the correlation contributions of other observables. Ideally, the measure should depend on very simple quantities. For instance, expressions based on natural orbital occupancies (NOO) would accomplish this goal and would be directly applicable to natural orbital and density matrix functional theories51,52 as well as wavefunction ab initio calculations.1 In addition, through appropriate transformations, the NOO-based measures of electron correlation could also be applied in density functional theory.53,54 One such measure is the deviation from idempotency (DFI)5,55 that uses NOO and accounts for nondynamic correlation effects. There is actually very few indicators of dynamic electron correlation available in the literature and, to our knowledge, there is no NOO-based dynamic correlation measure excepting for Ziesche's proposal,3 which uses NOO of orbitals close to the Fermi level but it is not continuous with respect to small changes of NOO.
3 Dynamic and nondynamic separation
In order to construct a physically-motivated separation of dynamic and nondynamic correlation effects we will use the second- and first-order reduced density matrices (2-RDM and 1-RDM) in a natural orbital representation, respectively:| |  | (3) |
| |  | (4) |
where ϕi(1) is a natural orbital and ni its occupancy, 1 ≡ (![[r with combining right harpoon above (vector)]](https://www.rsc.org/images/entities/i_char_0072_20d1.gif) 1,σ1), and 2Dijkl is the matrix representation of the 2-RDM (2-DM hereafter) and it should contain the electron correlation information of the system.56 The Hartree–Fock-like approximation of the 2-DM becomes a very simple function in terms of NOO,5
1,σ1), and 2Dijkl is the matrix representation of the 2-RDM (2-DM hereafter) and it should contain the electron correlation information of the system.56 The Hartree–Fock-like approximation of the 2-DM becomes a very simple function in terms of NOO,5| | | (2DHFL)ijkl = ninj(δikδjl − δilδjk) | (5) |
the expression being exact for single-determinant wavefunctions. Let us define a pseudo Hartree–Fock (HF) 2-DM in the natural orbital representation| | | (2DPHF)ijkl = ξijkl(δikδjl − δilδjk), | (6) |
where ξijkl equals 1 if i, j, k and l orbitals are below the Fermi level, zero otherwise. This matrix construction is very close to the approach followed by Scuseria and co-workers in the context of projected Hartree–Fock method.57,58 The difference with respect to the actual HF 2-DM is that the pseudo-HF matrix is defined in terms of the natural orbitals of the correlated calculation whereas the actual HF 2-DM is defined in terms of the canonical HF orbitals (i.e., the expression looks like eqn (6) but i, j, etc. refer to canonical HF orbitals). We have checked that energy-wise the difference between both matrices is fairly small and, for practical reasons, one can take the latter as a matrix free of electron correlation effects. In this sense, the difference between the actual 2-DM and the pseudo-HF one is a matrix that contains electron correlation effects,| | | Cijkl = 2Dijkl − (2DPHF)ijkl. | (7) |
In order to extract the electron correlation information from these matrices let us decompose C aswhere,| | | Λijkl = (ninj − ξijkl)(δikδjl − δilδjk) | (9) |
| | | Γijkl = 2Dijkl − (ninj)(δikδjl − δilδjk) | (10) |
Λ is an antisymmetric diagonal matrix that measures the pairwise deviation of NOO from a single-determinant picture and Γ is the cumulant matrix.59,60 The decomposition of C is sketched in the diagram of Fig. 2, corresponding to the two steps from the pseudo-HF 2-DM to the actual 2-DM. In this diagram 1DPHF is the pseudo-HF 1-DM that we use to obtain 2DPHF in eqn (6). The arrow pointing downwards represents the change in the 2-DM approximation due to the use of exact NOOs instead of the pseudo-HF ones. This relaxation process is expected to retrieve nondynamic correlation effects and is accounted by Λ, i.e., 2DPHF = 2DHFL[1DPHF]. The arrow that points from 2DHFL[1D], eqn (5), to the exact 2-DM represents the dynamic correlation effects contained in Γ. Notice that the exact electron density is retrieved by one-coordinate reduction of both 2DHFL[1D] and 2D[1D] but it is not obtained from 2DHFL[1DPHF]. Since nondynamic correlation is expected to produce global changes to the electron density and dynamic correlation rather small local ones, it is only natural to assign Λ and Γ as the matrices accounting for nondynamic and dynamic correlation effects, respectively. Notwithstanding, notice that the trace of Γ—that corresponds to the deviation from idempotency—and the Frobenius norm of this matrix8 actually correspond to two well-known measures of non-dynamic correlation and, therefore, it is not obvious how to extract the pertinent correlation information from these matrices.
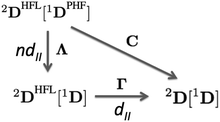 |
| | Fig. 2 Electron correlation diagram for 2-DM in terms of 1-DM. | |
Indeed, eqn (8) provides a decomposition of a matrix that contains electron correlation into dynamic and nondynamic parts, however, how do we extract the information about electron correlation from these matrices? In order to provide an answer, we will use a two-electron model system.
4 Two-electron model
Let us analyze the correlation matrices defined in the latter section on a simple model system (MS) consisting of a singlet two-electron system. We will use a minimal basis (two orbitals) because the sign of the natural orbitals amplitude is completely determined in this case61 and, therefore, the 2-RDM that can be explicitly written in terms of natural occupancies.62 Let us consider a separation of the physical space into two symmetric regions F and F′, each containing an average of one electron. The electron fluctuation between these regions can be measured through the covariance:63,64| | VF,F′ = 〈(![[N with combining circumflex]](https://www.rsc.org/images/entities/i_char_004e_0302.gif) F − F − ![[N with combining macron]](https://www.rsc.org/images/entities/i_char_004e_0304.gif) F)( F)(![[N with combining circumflex]](https://www.rsc.org/images/entities/i_char_004e_0302.gif) F′ − F′ − ![[N with combining macron]](https://www.rsc.org/images/entities/i_char_004e_0304.gif) F′)〉 = 〈 F′)〉 = 〈![[N with combining circumflex]](https://www.rsc.org/images/entities/i_char_004e_0302.gif) F F![[N with combining circumflex]](https://www.rsc.org/images/entities/i_char_004e_0302.gif) F′〉 − 1 F′〉 − 1 | (11) |
where ![[N with combining circumflex]](https://www.rsc.org/images/entities/i_char_004e_0302.gif) F is the particle number operator acting on region F,
F is the particle number operator acting on region F, ![[N with combining macron]](https://www.rsc.org/images/entities/i_char_004e_0304.gif) F is average number of electrons in F and 〈
F is average number of electrons in F and 〈![[N with combining circumflex]](https://www.rsc.org/images/entities/i_char_004e_0302.gif) F
F![[N with combining circumflex]](https://www.rsc.org/images/entities/i_char_004e_0302.gif) F′〉 is computed using the 2-DM. Electron correlation in this two-electron model can be measured by comparing the electron fluctuation between F and F′ using the 2-DM matrices given in Fig. 2, i.e.,
F′〉 is computed using the 2-DM. Electron correlation in this two-electron model can be measured by comparing the electron fluctuation between F and F′ using the 2-DM matrices given in Fig. 2, i.e.,| | | IMSND = VF,F′[2DHFL[1D]] − VF,F′[2DHFL[1DPHF]] | (12) |
| |  | (13) |
| | | IMSD = VF,F′[2D] − VF,F′[2DHFL[1D]] | (14) |
| |  | (15) |
where SFik is the overlap between two natural orbitals in the three-dimensional region of fragment F, i.e.,| |  | (16) |
Due to symmetry restrictions  and it has been proved65 that
  . Therefore, the formulae can be simplified to
| | | IMSD = n1/2(1 − n)1/2 − 2n(1 − n) | (17) |
where n is the natural orbital occupancy of either the bonding or antibonding orbital. These indices are plotted in Fig. 3 against the occupation value. Simple inspection reveals that all the indices are zero for full or vanishing occupations, but the dynamic indicator attains larger values than the nondynamic one in the vicinity of these extreme occupancies. The nondynamic indicator is maximal when each electron is equally distributed between the two orbitals, whereas the dynamic counterpart is minimal in this situation. The dynamic indicator peaks at n ≈ 0.067 and n ≈ 0.933. All these features are in line with trends that one would expect from dynamic and nondynamic indicators.
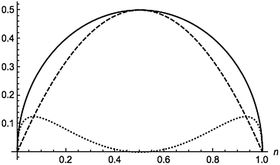 |
| | Fig. 3 Total (solid), dynamic (dotted) and nondynamic (dashed) electron correlation indicators for a homonuclear minimal-basis singlet two-electron model against the orbital occupation. | |
5 Natural orbital formulation
In order to construct a general natural-orbital based decomposition of electron correlation in the following we assume that the correlation of a molecule can be retrieved by summing up the individual contributions of each orbital as calculated using eqn (17) and (18), i.e.,| |  | (19) |
| |  | (20) |
where nσi is the occupation of the spin-natural orbital i with spin σ. IND coincides with the DFI of the first-order density matrix, which is a well-known measure of nondynamic correlation and it is also linked to the number of effectively unpaired electrons in singlet molecules.66–70 The summation of both quantities gives rise to a total correlation index:| |  | (21) |
Unlike the previous formulation, eqn (8)–(10), which depend on the 2-DM, the expressions in eqn (19)–(21) provide simple measures of dynamic, nondynamic and total electron correlation in terms of natural orbital occupancies. Therefore, these expressions are more versatile and can be applied to all sort of ab initio methods, density matrix functional theory (DMFT)51,52,71 and, DFT with fractional occupancies (or regular DFT by mapping orbital occupancies into Kohn–Sham orbital energies53). In addition, these formulae can be naturally decomposed into orbital contributions and, upon multiplication of orbital amplitudes, they afford local descriptors of total, dynamic and nondynamic correlation. These descriptors can be used to measure the local importance of dynamic correlation effects and hence be employed in the development of local methods.43
I
ND is defined in the interval [0,N/2], while ID takes values in [0,∞] because the sum  is not bounded above. Indeed, for an extreme case of infinite occupancies going to zero, the latter sum might diverge. Although this result is highly unpleasant, it merely has any effect for real systems where orbital occupancies never reach such situation.
In the Löwdin–Shull wavefunction the coefficients of the CI expansion take a very simple form in terms of natural occupancies, 2ci2 = ni. Therefore, one can easily study these indicators under different electron correlation regimes.60 A typical dynamic correlation case is characterized by a single dominant configuration, c0 ≈ 1 (thus ci2 ≈ 0 ∀i ≠ 0). For this system, eqn (20) goes quickly to zero, and the first term of eqn (19) dominates over the second one. Therefore, IT ≈ ID, as one would expect. As a prototype of strong nondynamic correlation effects we analyze the degeneracy between two electron configurations, which for a two-electron system corresponds to  (and ci2 = 0 ∀i > 1). In this situation IND attains the maximum value and ID = 0, in agreement with our prediction.
6 Numerical examples
We have performed numerical evaluations of the indices for a series of illustrative systems to validate the formulae derived from the two-electron model. FCI calculations with a cc-pVTZ basis set have been performed with a modified version of the program of Knowles and Handy72 for the dissociation of H2 and LiH, for the planar potential energy surface of H4 and the isoelectronic series of He and Be. Full-valence CASSCF calculations have been performed with Gaussian 09 package73 in order to obtain Handy's correlation energy decomposition (eqn (2)) for H2 and H4. The same program has been used to obtain CISD/cc-pVTZ natural orbitals for Be2, CO, F2, HF, Li2, LiH and N2, in order to calculate IND and ID, which are compared against the END and ED values published by Handy.48
The values of ID, IND, ED and END along the dissociation of H2 are depicted in Fig. 4. At the equilibrium distance, the nondynamic correlation is barely zero and the most important contribution comes from the dynamic correlation. IND presents a sigmoidal growth as the bond stretches and it reaches the maximum value of 0.5 at dissociation. ID slightly increases upon dissociation peaking at around 1.2 Å. From this point on, the index decays to zero because, as the interaction between electrons decreases, the presence of isolated electrons cannot give rise to dynamic correlation. END and ED show qualitatively the same trend than IND and END, i.e., END dominates over ED and attains a maximum value at large distances whereas ED has larger values than END close to the equilibrium distance and decays to zero as the H2 molecule stretches. However, ED has a maximum at shorter interatomic distance and shows smaller numbers than ID (with respect to the total values). We attribute these differences to the fact that ED is calculated assuming that a CAS(2,2) calculation of a two-electron system will include no dynamical correlation. This example puts forward the difficulty of using reference wavefunctions that do not include dynamic correlation.
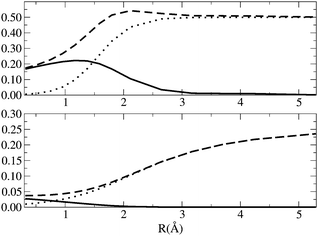 |
| | Fig. 4
I
D (solid line) IND (dotted line) and IT (dashed line) [top], ED (solid line), END and ECORR (dashed line) [bottom] along the H2 dissociation curve. The equilibrium distance is 0.7 Å. Energy units are Hartrees. | |
The isoelectronic series of Be and He have been widely used to calibrate dynamic and nondynamic correlation effects.45,46 As the effective nuclear charge increases the electron correlation decreases because the electron distribution concentrates around the nuclei and vice versa. For the He isoelectronic series the dynamic correlation is far more important than the nondynamic one due to the absence of orbital degeneracies, as illustrated by Fig. 5. The 2s and 2p orbitals of Be-like ions are near degenerate and the HOMO–LUMO gap is thus very small. As Z increases the gap increases but the relative gap (the gap divided by the average energy of the orbitals) actually decreases. Gill has called this correlation type B (nondynamic) correlation, whereas the correlation due to the absolute degeneracy of the gap is referred as type A (nondynamic) correlation.74 The results in Fig. 5 show that the DFI can identify the nondynamic correlation linked to type A, but it does not recognize the type B nondynamic correlation. Despite the presence of degeneracies, ID is far more important than IND. In order to compare these results with a correlation energy decomposition we should scale ED and END with respect to EFCI. The energy and, therefore, the correlation energy are highly sensible to the external potential. Hence, a crude inspection of ECORR does not inform about the relative correlation effects in a system with varying external potential unless an appropriate scaling is performed. Fig. 5 contains Cioslowski's decomposition results presented by Ludeña and coworkers,47 which show similar trends to ID and IND; the most notable exception being the small nondynamic correlation energy fraction attributed to the Be series. In Fig. 5 we also include the dissociation of LiH, where both ID and IND exhibit a similar shape as in H2.
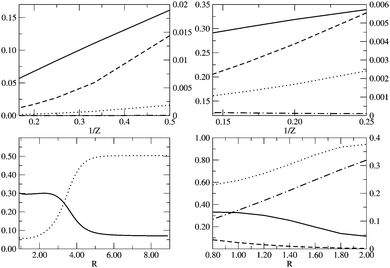 |
| | Fig. 5 From left to right and top to bottom: ID (solid line), IND (dotted line), |E(I)D|/EFCI (dashed line) and |E(I)ND|/EFCI (dot-dashed line) along (i) the He isoelectronic series as a function of 1/Z, (ii) the Be isoelectronic series as a function of 1/Z, (iii) the LiH dissociation as a function of RLiH (Å) and (iv) ID (solid line), IND (dotted line), |EHD| (dashed line) and |EHND| (dot-dashed line) for the dissociation of the D4h geometry of H4 as we increase the distance between the H atom and the center of mass, R (Å). Left y-axis is used for ID and IND, whereas right y-axis is used for ED and END. | |
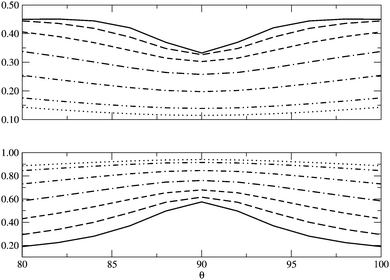
In Fig. 5 we examine the singlet H4 planar potential energy surface75 by collecting the D4h structures as a function of R, the distance between H and the center of mass (see Fig. 6). These geometries present degenerate b3u and b2u orbitals that prompt large nondynamic correlation effects as reflected by the values of IND (|EHND|), which are bigger than the ID (|EHD|) ones for all the structures studied. The more stretched the H4 structure, the larger the nondynamic correlation effects, whereas dynamic correlation is most notorious for constricted geometries. The transition from D4h to D2h structures (that is controlled by the angle θ between two contiguous H atoms and the center of mass) can be used to see the change from nondynamic-controlled region (near the D4h geometries) to a region of predominant dynamic correlation. As R increases, the values of ID and |EHD| decrease and the plots as a function of θ show a minimum at the D4h structure and become flatter, in agreement with the small dynamic correlation expected at stretched geometries (see Fig. 7 and 8). IND and |EHND| show exactly the opposite profiles, with largest values at the D4h geometries and flatter profiles for large R.
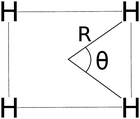 |
| | Fig. 6 The D4h/D2h potential energy surface of H4 is given in terms of two coordinates: R and θ. | |
 |
| | Fig. 7
I
D (top) and IND (bottom) as a function of θ, the angle between two contiguous H atoms and the center of mass in the H4 molecule, for different R (see Fig. 6). The solid lines represent R = 0.8 Å and the dotted lines R = 2.0 Å, the other lines in between correspond to the structures of R = 1.0, 1.2, 1.4, 1.6 and 1.8 Å. | |
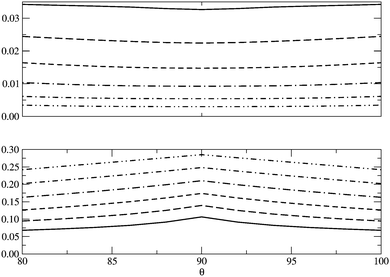 |
| | Fig. 8 |EHD| (top) and |EHND| (bottom) as a function of θ, the angle between two contiguous H atoms and the center of mass in the H4 molecule, for different R (see Fig. 6). The solid lines represent R = 0.8 Å and the dotted lines R = 2.0 Å, the other lines in between correspond to the structures of R = 1.0, 1.2, 1.4, 1.6 and 1.8 Å. Units are Hartrees. | |
Finally, Table 1 collects a few diatomic molecules at the equilibrium distance (Re) and at a stretched geometry (1.5Re). As expected, the nondynamic correlation indices increase upon bond length elongation with only a few exceptions. Be2 is an exception due to the unusually large nondynamic correlation nature at the ground state distance, as confirmed by the large IND value at equilibrium that barely changes for the stretched bond length. LiH and Li2 show a IND reduction upon stretching the internuclear distance, whereas |EHND| remains constant. This feature was recognized by Handy and coworkers, who suggested an alternative electron correlation energy partition, consisting of a CASSCF calculation with an active space such that the angular correlation is not incorporated.48 The results obtained with this alternative partition do show some increase of |EHND| for LiH and Li2 due to bond length elongation,48 however, they put forward the limitation of the CASSCF wavefunction as a reference containing no dynamic correlation.
Table 1 CISD/cc-pVTZ ID, IND, ED and END values for a series of diatomic molecules at its ground state geometry (Re) and at the 1.5Re interatomic separation. ID, IND units are electrons and ED and END units are Hartrees
| |
I
D
|
I
ND
|
E
D
|
E
ND
|
|
R
e
|
1.5Re |
R
e
|
1.5Re |
R
e
|
1.5Re |
R
e
|
1.5Re |
|
E
D and END are taken ref. 48.
|
| Be2 |
0.60 |
0.57 |
0.29 |
0.27 |
0.12 |
0.11 |
0.09 |
0.09 |
| CO |
0.83 |
0.89 |
0.17 |
0.24 |
0.41 |
0.41 |
0.13 |
0.22 |
| F2 |
0.91 |
0.89 |
0.16 |
0.29 |
0.69 |
0.66 |
0.08 |
0.22 |
| HF |
0.55 |
0.57 |
0.09 |
0.12 |
0.37 |
0.37 |
0.02 |
0.05 |
| Li2 |
0.31 |
0.28 |
0.18 |
0.24 |
0.10 |
0.10 |
0.03 |
0.03 |
| LiH |
0.23 |
0.24 |
0.06 |
0.10 |
0.06 |
0.06 |
0.03 |
0.04 |
| N2 |
0.84 |
0.91 |
0.18 |
0.29 |
0.41 |
0.41 |
0.15 |
0.31 |
7 Conclusions
In this paper we have developed physically-sound electron correlation matrices that account for total (eqn (8)), nondynamic (eqn (9)) and dynamic (eqn (10)) correlation effects and depend on the pair density. These expressions are applied to a minimal-basis two-fragment two-electron model at different inter-fragment separations to afford dynamic (eqn (19)), nondynamic (eqn (20)) and total (eqn (21)) electron correlation indicators in terms of natural orbital occupancies. Unlike other existing indicators of electron correlation, they neither depend upon the definition of wavefunctions containing only dynamic or nondynamic correlation effects, nor they need the calculation of the exact wavefunctions. The indicators here developed do not rely on reference wavefunctions and can be applied to any method to analyze the effect of dynamic and nondynamic correlation provided that natural orbital occupancies are available. The electron correlation indicators have been analyzed in a set of representative examples providing different dynamic and nondynamic electron correlation regimes. Results are also compared against existing electron correlation measures, demonstrating the validity of the new expressions.
The latter expressions can be applied to all sort of ab initio methods, DMFT and, ensemble DFT with fractional occupancies76 (or DFT by mapping orbital occupancies into Kohn–Sham orbital energies53). In addition, these formulae can be naturally decomposed into orbital contributions and, upon multiplication of orbital amplitudes, they afford local descriptors of total, dynamic and nondynamic correlation. These descriptors measure the local importance of dynamic correlation and hence can be used in the development of local methods.43 Such possibility is currently explored in our lab and will be the subject of a future work.
Acknowledgements
This research has been funded by the Spanish MINECO Projects No. CTQ2014-52525-P and CTQ2014-59212-P, and the Basque Country Consolidated Group Project No. IT588-13. ERC acknowledges funding from the European Union's Horizon 2020 research and innovation programme under the Marie Sklodowska-Curie grant agreement No. 660943. E. M. acknowledges fruitful discussions with Profs Savin, Szabados and Cioslowski.
References
- C. Hättig, W. Klopper, A. Köhn and D. P. Tew, Chem. Rev., 2012, 112, 4–74 CrossRef PubMed
 .
.
- D. Cremer, Mol. Phys., 2001, 99, 1899–1940 CrossRef CAS
 .
.
- P. Ziesche, THEOCHEM, 2000, 527, 35–50 CrossRef CAS
 .
.
- D. P. Tew, W. Klopper and T. Helgaker, J. Comput. Chem., 2007, 28, 1307–1320 CrossRef CAS PubMed
 .
.
- P.-O. Löwdin, Phys. Rev., 1955, 97, 1474–1489 CrossRef
 .
.
- W. Kutzelnigg, G. Del Re and G. Berthier, Phys. Rev., 1968, 172, 49 CrossRef
 .
.
- K. Raghavachari and J. B. Anderson, J. Phys. Chem., 1996, 100, 12960–12973 CrossRef CAS
 .
.
- T. Juhász and D. A. Mazziotti, J. Chem. Phys., 2006, 125, 174105 CrossRef PubMed
 .
.
- D. Alcoba, R. Bochicchio, L. Lain and A. Torre, J. Chem. Phys., 2010, 133, 144104 CrossRef CAS PubMed
 .
.
- J. T. Skolnik and D. A. Mazziotti, Phys. Rev. A: At., Mol., Opt. Phys., 2013, 88, 032517 CrossRef
 .
.
- O. Sinanoğlu, Adv. Chem. Phys., 1964, 6, 315–412 CrossRef
 .
.
- R. J. Bartlett and J. F. Stanton, Rev. Comput. Chem., 2007, 5, 65–169 Search PubMed
 .
.
- J. E. Lennard-Jones, J. Chem. Phys., 1952, 20, 1024 CrossRef CAS
 .
.
- G. C. Lie and E. Clementi, J. Chem. Phys., 1974, 60, 1275–1287 CrossRef CAS
 .
.
- T. J. Lee, J. E. Rice, G. E. Scuseria and H. F. Schaefer, Theor. Chim. Acta, 1989, 75, 81 CrossRef CAS
 .
.
- T. J. Lee and P. R. Taylor, Int. J. Quantum Chem., 1989, 23, 199–207 CAS
 .
.
- C. L. Janssen and I. M. B. Nielsen, Chem. Phys. Lett., 1998, 290, 290 CrossRef
 .
.
- T. J. Lee, Chem. Phys. Lett., 2003, 372, 362–367 CrossRef CAS
 .
.
- J. Cioslowski, Theor. Chim. Acta, 1992, 81, 319–327 CrossRef CAS
 .
.
- K. Andersson, P.-Å. Malmqvist and B. O. Roos, J. Chem. Phys., 1992, 96, 1218–1226 CrossRef CAS
 .
.
- R. J. Buenker, S. D. Peyerimhoff and W. Butscher, Mol. Phys., 1978, 35, 771–791 CrossRef CAS
 .
.
- D. A. Mazziotti, Phys. Rev. A: At., Mol., Opt. Phys., 2007, 76, 052502 CrossRef
 .
.
- J. W. Snyder Jr and D. A. Mazziotti, Phys. Chem. Chem. Phys., 2012, 14, 1660–1667 RSC
 .
.
- A. Savin, Int. J. Quantum Chem., 1988, 34, 59–69 CrossRef
 .
.
-
A. Savin, Density functional methods in chemistry, Springer, 1991, pp. 213–230 Search PubMed
 .
.
-
A. Savin, On degeneracy, near-degeneracy and density functional theory. In Recent Developments of Modern Density Functional Theory, Elsevier, Amsterdam, 1996 Search PubMed
 .
.
- J. Jaramillo, G. E. Scuseria and M. Ernzerhof, J. Chem. Phys., 2003, 118, 1068–1073 CrossRef CAS
 .
.
- A. D. Becke, J. Chem. Phys., 1993, 98, 5648–5652 CrossRef CAS
 .
.
- A. D. Becke, J. Chem. Phys., 1993, 98, 1372–1377 CrossRef CAS
 .
.
- J. P. Perdew, M. Ernzerhof and K. Burke, J. Chem. Phys., 1996, 105, 9982–9985 CrossRef CAS
 .
.
- F. G. Cruz, K.-C. Lam and K. Burke, J. Phys. Chem. A, 1998, 102, 4911–4917 CrossRef CAS
 .
.
- H. Iikura, T. Tsuneda, T. Yanai and K. Hirao, J. Chem. Phys., 2001, 115, 3540–3544 CrossRef CAS
 .
.
- R. Baer, E. Livshits and U. Salzner, Annu. Rev. Phys. Chem., 2009, 61, 85 CrossRef PubMed
 .
.
- A. V. Arbuznikov and M. Kaupp, J. Chem. Phys., 2014, 141, 204101 CrossRef PubMed
 .
.
- T. M. Henderson, B. G. Janesko and G. E. Scuseria, J. Phys. Chem. A, 2008, 112, 12530–12542 CrossRef CAS PubMed
 .
.
- E. R. Johnson, J. Chem. Phys., 2014, 141, 124120 CrossRef PubMed
 .
.
- A. D. Becke, J. Chem. Phys., 1988, 88, 2547–2553 CrossRef CAS
 .
.
- P. De Silva and C. Corminboeuf, J. Chem. Phys., 2015, 142, 074112 CrossRef PubMed
 .
.
- S. Grimme and A. Hansen, Angew. Chem., Int. Ed., 2015, 54, 12308–12313 CrossRef CAS PubMed
 .
.
- K. Boguslawski, P. Tecmer, O. Legeza and M. Reiher, J. Phys. Chem. Lett., 2012, 3, 3129–3135 CrossRef CAS PubMed
 .
.
- A. Raeber and D. A. Mazziotti, Phys. Rev. A: At., Mol., Opt. Phys., 2015, 92, 052502 CrossRef
 .
.
- P. Pulay, Chem. Phys. Lett., 1983, 100, 151–154 CrossRef CAS
 .
.
-
R. Zalesny, M. G. Papadopoulos, P. G. Mezey and J. Leszczynski, Linear-scaling techniques in computational chemistry and physics: Methods and applications, Springer Science + Business Media BV, 2011 Search PubMed
 .
.
-
I. Shavitt, in Advanced Theories and Computational Approaches to the Electronic Structure of Molecules, ed. C. E. Dykstra, Springer, Netherlands, 1984, pp. 185–196 Search PubMed
 .
.
- J. Cioslowski, Phys. Rev. A: At., Mol., Opt. Phys., 1991, 43, 1223–1228 CrossRef CAS
 .
.
- E. Valderrama, E. V. Ludeña and J. Hinze, J. Chem. Phys., 1997, 106, 9227–9235 CrossRef CAS
 .
.
- E. Valderrama, E. V. Ludeña and J. Hinze, J. Chem. Phys., 1999, 110, 2343–2353 CrossRef CAS
 .
.
- D. K. W. Mok, R. Neumann and N. C. Handy, J. Phys. Chem., 1996, 100, 6225–6230 CrossRef CAS
 .
.
- E. Davidson, S. Hagstrom, S. Chakravorty, V. Umar and C. Fischer, Phys. Rev. A: At., Mol., Opt. Phys., 1991, 44, 7071 CrossRef CAS
 .
.
- E. Valderrama, J. Mercero and J. Ugalde, J. Phys. B: At. Mol. Phys., 2001, 34, 275 CrossRef CAS
 .
.
- M. Piris and J. Ugalde, Int. J. Quantum Chem., 2014, 114, 1169–1175 CrossRef CAS
 .
.
- K. Pernal and K. J. H. Giesbertz, Top. Curr. Chem., 2015, 368, 125 CrossRef
 .
.
- M. Grüning, O. Gritsenko and E. Baerends, J. Chem. Phys., 2003, 118, 7183–7192 CrossRef
 .
.
- C.-S. Wu and J.-D. Chai, J. Chem. Theory Comput., 2015, 11, 2003–2011 CrossRef CAS PubMed
 .
.
- V. H. Smith Jr, Theor. Chim. Acta, 1967, 7, 245 CrossRef
 .
.
- C. A. Coulson, Rev. Mod. Phys., 1960, 32, 170 CrossRef CAS
 .
.
- G. E. Scuseria, C. A. Jiménez-Hoyos, T. M. Henderson, K. Samanta and J. K. Ellis, J. Chem. Phys., 2011, 135, 124108 CrossRef PubMed
 .
.
- C. A. Jimenez-Hoyos, T. M. Henderson, T. Tsuchimochi and G. E. Scuseria, J. Chem. Phys., 2012, 136, 164109 CrossRef PubMed
 .
.
- D. A. Mazziotti, Chem. Phys. Lett., 1998, 289, 419–427 CrossRef CAS
 .
.
- W. Kutzelnigg and D. Mukherjee, J. Chem. Phys., 1999, 110, 2800–2809 CrossRef CAS
 .
.
- K. Pernal and J. Cioslowski, J. Chem. Phys., 2004, 120, 5987–5992 CrossRef CAS PubMed
 .
.
- P.-O. Löwdin and H. Shull, Phys. Rev., 1956, 101, 1730–1739 CrossRef
 .
.
- R. F. W. Bader and M. E. Stephens, Chem. Phys. Lett., 1974, 26, 445 CrossRef CAS
 .
.
- E. Matito, M. Solà, P. Salvador and M. Duran, Faraday Discuss., 2007, 135, 325–345 RSC
 .
.
- E. Matito, M. Duran and M. Solà, J. Chem. Educ., 2006, 83, 1243 CrossRef CAS
 .
.
- K. Takatsuka, T. Fueno and K. Yamaguchi, Theor. Chim. Acta, 1978, 48, 175–183 CrossRef CAS
 .
.
- V. N. Staroverov and E. R. Davidson, Chem. Phys. Lett., 2000, 330, 161–168 CrossRef CAS
 .
.
- M. Head-Gordon, Chem. Phys. Lett., 2003, 372, 508–511 CrossRef CAS
 .
.
- R. C. Bochicchio, A. Torre and L. Lain, Chem. Phys. Lett., 2003, 380, 486–487 CrossRef CAS
 .
.
- M. Head-Gordon, Chem. Phys. Lett., 2003, 380, 488–489 CrossRef CAS
 .
.
- D. A. Mazziotti, Chem. Rev., 2012, 112, 244–262 CrossRef CAS PubMed
 .
.
- P. Knowles and N. Handy, Comput. Phys. Commun., 1989, 54, 75 CrossRef CAS
 .
.
-
M. J. Frisch, G. W. Trucks, H. B. Schlegel, G. E. Scuseria, M. A. Robb, J. R. Cheeseman, G. Scalmani, V. Barone, B. Mennucci, G. A. Petersson, H. Nakatsuji, M. Caricato, X. Li, H. P. Hratchian, A. F. Izmaylov, J. Bloino, G. Zheng, J. L. Sonnenberg, M. Hada, M. Ehara, K. Toyota, R. Fukuda, J. Hasegawa, M. Ishida, T. Nakajima, Y. Honda, O. Kitao, H. Nakai, T. Vreven, J. A. Montgomery, Jr., J. E. Peralta, F. Ogliaro, M. Bearpark, J. J. Heyd, E. Brothers, K. N. Kudin, V. N. Staroverov, R. Kobayashi, J. Normand, K. Raghavachari, A. Rendell, J. C. Burant, S. S. Iyengar, J. Tomasi, M. Cossi, N. Rega, J. M. Millam, M. Klene, J. E. Knox, J. B. Cross, V. Bakken, C. Adamo, J. Jaramillo, R. Gomperts, R. E. Stratmann, O. Yazyev, A. J. Austin, R. Cammi, C. Pomelli, J. W. Ochterski, R. L. Martin, K. Morokuma, V. G. Zakrzewski, G. A. Voth, P. Salvador, J. J. Dannenberg, S. Dapprich, A. D. Daniels, Ö. Farkas, J. B. Foresman, J. V. Ortiz, J. Cioslowski and D. J. Fox, Gaussian 09 Revision D.01, Gaussian Inc., Wallingford CT, 2009 Search PubMed
 .
.
- J. W. Hollett and P. M. Gill, J. Chem. Phys., 2011, 134, 114111 CrossRef PubMed
 .
.
- E. Ramos-Cordoba, X. Lopez, M. Piris and E. Matito, J. Chem. Phys., 2015, 143, 164112 CrossRef PubMed
 .
.
- E. Fromager, Mol. Phys., 2015, 113, 419–434 CrossRef CAS
 .
.
|
| This journal is © the Owner Societies 2016 |
 Open Access Article
 *ab,
Pedro
Salvador
c and
Eduard
Matito
*ad


![[r with combining right harpoon above (vector)]](https://www.rsc.org/images/entities/i_char_0072_20d1.gif) 1,σ1), and 2Dijkl is the matrix representation of the 2-RDM (2-DM hereafter) and it should contain the electron correlation information of the system.56 The Hartree–Fock-like approximation of the 2-DM becomes a very simple function in terms of NOO,5
1,σ1), and 2Dijkl is the matrix representation of the 2-RDM (2-DM hereafter) and it should contain the electron correlation information of the system.56 The Hartree–Fock-like approximation of the 2-DM becomes a very simple function in terms of NOO,5![[N with combining circumflex]](https://www.rsc.org/images/entities/i_char_004e_0302.gif) F −
F − ![[N with combining macron]](https://www.rsc.org/images/entities/i_char_004e_0304.gif) F)(
F)(![[N with combining circumflex]](https://www.rsc.org/images/entities/i_char_004e_0302.gif) F′ −
F′ − ![[N with combining macron]](https://www.rsc.org/images/entities/i_char_004e_0304.gif) F′)〉 = 〈
F′)〉 = 〈![[N with combining circumflex]](https://www.rsc.org/images/entities/i_char_004e_0302.gif) F
F![[N with combining circumflex]](https://www.rsc.org/images/entities/i_char_004e_0302.gif) F′〉 − 1
F′〉 − 1![[N with combining circumflex]](https://www.rsc.org/images/entities/i_char_004e_0302.gif) F is the particle number operator acting on region F,
F is the particle number operator acting on region F, ![[N with combining macron]](https://www.rsc.org/images/entities/i_char_004e_0304.gif) F is average number of electrons in F and 〈
F is average number of electrons in F and 〈![[N with combining circumflex]](https://www.rsc.org/images/entities/i_char_004e_0302.gif) F
F![[N with combining circumflex]](https://www.rsc.org/images/entities/i_char_004e_0302.gif) F′〉 is computed using the 2-DM. Electron correlation in this two-electron model can be measured by comparing the electron fluctuation between F and F′ using the 2-DM matrices given in Fig. 2, i.e.,
F′〉 is computed using the 2-DM. Electron correlation in this two-electron model can be measured by comparing the electron fluctuation between F and F′ using the 2-DM matrices given in Fig. 2, i.e.,


 and it has been proved65 that
  . Therefore, the formulae can be simplified to


 is not bounded above. Indeed, for an extreme case of infinite occupancies going to zero, the latter sum might diverge. Although this result is highly unpleasant, it merely has any effect for real systems where orbital occupancies never reach such situation.
 (and ci2 = 0 ∀i > 1). In this situation IND attains the maximum value and ID = 0, in agreement with our prediction.

.
.
.
.
.
.
.
.
.
.
.
.
.
.
.
.
.
.
.
.
.
.
.
.
.
.
.
.
.
.
.
.
.
.
.
.
.
.
.
.
.
.
.
.
.
.
.
.
.
.
.
.
.
.
.
.
.
.
.
.
.
.
.
.
.
.
.
.
.
.
.
.
.
.
.
.


