 Open Access Article
Portable point-of-care diagnostic devices
Wei
Zhang
,
Siyuan
Guo
,
Wildemar Stefânio
Pereira Carvalho
,
Yaxin
Jiang
and
Michael J.
Serpe
*
Department of Chemistry, University of Alberta, Edmonton, Alberta T6G 2G2, Canada. E-mail: serpe@ualberta.ca; Tel: +1-780-492-5778
First published on 1st November 2016
Abstract
The detection of specific species of interest (i.e., analytes) in samples (blood, urine, saliva, water, and food) at low concentrations is of utmost importance for improving human health and maintaining a high quality of life. While this is mostly achievable in lab-based settings found in the developed world, this is a major hurdle to overcome in resource-limited regions found in developing countries. Therefore, new technologies capable of detecting analytes in these challenging regions need to be developed. This review details the development of point-of-care diagnostics for detecting DNA, proteins, bacteria/pathogens, and other species that show promise for solving this major health issue, and improving the quality of life for those in the developing world.
1. Introduction
Pathogens, such as viruses and bacteria, are a major class of species that can negatively impact human health and societies. Oftentimes the impact is disproportionately more significant in the developing world compared to the developed world. For example, in 2014 the Ebola outbreak in West Africa resulted in the loss of thousands of lives in that region, while the impact on the rest of the world was significantly less severe. Additionally, malaria is known to be one of the most common human protozoan infections in tropical and subtropical regions, leading to ∼2000 deaths every day.1 Finally, the recent Zika virus outbreak in Central and South America has raised many concerns about its transmission during the 2016 Summer Olympic Games in Rio de Janeiro, Brazil.2 Its diagnosis is still a major challenge due to its similarity to other Flaviviridae viruses such as dengue.3 Regardless of the disease, early detection is crucial for effective treatment; to have maximal impact on the developing world, the diagnostic technology should also be inexpensive, simple, require minimal infrastructure, and generate a result quickly.To achieve this goal, diagnostic tools have been improved upon significantly over the past few decades, with a focus on bringing diagnostic tools from the lab to the field.4,5 Despite the significant advances, there is a great need for diagnostic tools that are inexpensive, easy to use (can be used by untrained personnel), simple, capable of generating results quickly, and operating in harsh conditions with little-to-no infrastructure. The development of technology with just one/some of these attributes can save millions of lives worldwide.6–10 Conventional diagnostic technologies and assays, such as polymerase chain reaction (PCR)11,12 and enzyme-linked immunosorbent assay13–16 have been widely implemented around the world as standard diagnostic tools, however, their applications are limited in developing countries due to the stringent conditions required for performing the assays. For example, many of these approaches work well in lab/hospital settings with trained staff and reliable access to electricity, running water, and climate control—such conditions are not typically found in rural regions of the developing world. Compared with standard laboratory-based diagnosis, point-of-care (POC) diagnostics are rapid, simple and inexpensive, and thus offer greater accessibility in resource-limited areas. Therefore, POC diagnostics will play a key role in on-site medical care for the prevention and control of disease.
Over the last decade, many innovative approaches to POC diagnostics have been developed utilizing smart phones, nanotechnology, and microfluidic technologies. For example, various kinds of glucose meters17,18 and pregnancy test kits19–22 have been developed and have been made commercially available. On the basis of this review, we provide a novel framework to assess examples that we feel have the most potential to make an impact as POC diagnostics in resource-limited settings. A majority of this review will focus on POC diagnostics for nucleic acids, proteins, glucose, and bacteria; we will end the review by covering some miscellaneous biosensing technology.
2. Nucleic acid detection
The analysis of DNA has drawn the attention of the public as the human genome project has been publicized and talked about since the early 1990's. Less well known is the importance of DNA analysis for diagnosing and detecting disease. As the carrier of genetic information for organisms, the uniqueness of the DNA/RNA sequences from each species makes it possible to distinguish between specific bacteria and virus in complex samples. Traditional methods for nucleic acid detection require multiple steps including pathogen isolation, polymerase chain reaction (PCR), and target identification. These technologies can have high precision and low detection limit, but their time consumption and requirement of sophisticated instrumentation limits their impact on the developing world as POC diagnostics.To address these challenges, microfluidic technologies have been developed that allow all analytical steps including sample pretreatment, reactions, separations, and detection to be performed in microfabricated channels on a small chip in an efficient and automated fashion.23–25 In order to achieve rapid quantitation of target nucleic acids and diagnose Pseudorabies virus, which is the main pathogen of Pseudorabies, Fang et al. integrated the DNA amplification process on a microfluidic chip.26 Although, instead of using PCR requiring high/low temperature cycles outside of the detection system, loop-mediated isothermal amplification (LAMP) technique was carried out in the microchannels to detect Pseudorabies virus. Specifically, the DNA detection device was constructed by forming eight 5 µL microchannels in a PDMS–glass assembly, as shown in Fig. 1A. Each of the microchannels were injected with LAMP reaction mixtures, primers, a Bst DNA polymerase,27 and different concentrations of target DNA. A visible white byproduct (magnesium pyrophosphate) generated in the process of LAMP amplification was used to quantify the target DNA (Fig. 1B). With this naked eye detection, the detection limit of this technology was ∼10 fg µL−1 which is 100–1000 fold more sensitive than the standard PCRs for Pseudorabies virus detection.28
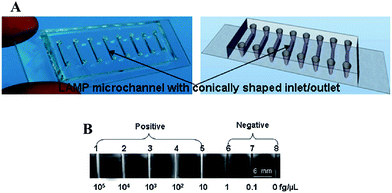 | ||
| Fig. 1 (A) Eight-channel PDMS–glass hybrid microfluidic chip for LAMP: (left) photograph and (right) schematic drawing of an eight-channel PDMS–glass hybrid microfluidic chip. (B) Sensitivity of LAMP using direct visual detection. Channels 1–5 show the white precipitate (channels appear white), while channels 6–8 do not (channels appear dark). Reproduced with permission.27 Copyright © 2010, American Chemical Society. | ||
In the past few decades, specific microRNAs (miRNAs) have been associated with various human diseases including diabetes, Alzheimer's, and various forms of cancer.29–32 For the early detection of disease, increasingly low concentrations of specific miRNAs in human body fluids is essential, and plays a key role in the generation/implementation of new disease treatment options.33 Therefore, new techniques for miRNA detection are constantly being developed to achieve improved limits of detection and sensitivity. Microfluidic devices have emerged as a useful technology for miRNA quantitation, although they have a number of drawbacks, e.g., the general need for power, which can limit their ability to be used in resource limited settings. To overcome this drawback, the Maeda group designed a power-free microfluidic chip to detect a well-known microRNA cancer marker, miR-21.34–36 This microfluidic chip utilizes the absorption of air by degassed PDMS to generate a reduced pressure condition in the chip and drive sample fluid movement (Fig. 2). As shown in Fig. 2A and B, the double Y-shaped microchannels with 100 µm in width and 25 µm in height are designed to carry out both target miRNAs detection and blank reference control experiment simultaneously. When the fluorescein isothiocyanate (FITC)-labeled streptavidin (F-SA) and biotinylated anti-streptavidin (B-anti-SA) are added in the left and right inlet, respectively, they form dendritic aggregation in the presence of target miRNA where the probe DNA is located (Fig. 2C). The formation of biotin–streptavidin aggregates was shown to significantly amplify the fluorescence signal. This phenomenon was first reported by the Maeda group in 2007, and referred to as laminar flow-assisted dendritic amplification (LFDA).37 By utilizing this approach, this device has an impressive limit of detection (LOD) of 0.5 pM, and the assay can complete in 20 min.34
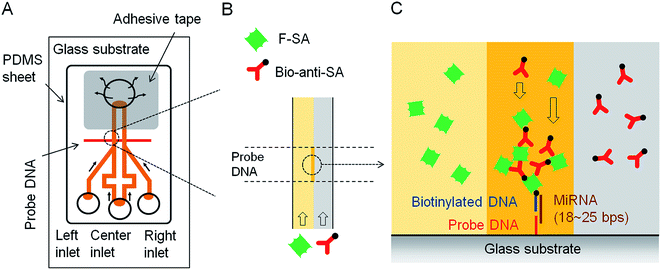 | ||
| Fig. 2 (A) Schematic of the power-free microfluidic device. PDMS absorbs air in the outlet chamber, which drives the pumping action. The width of the DNA probe pattern was 100 µm, and it was located 500 µm downstream of the confluent point of the Y-shaped channel. (B) Enlarged view of laminar flow in the microchannel. F-SA and B-anti-SA are conveyed by the laminar flow. (C) Enlarged cross-sectional view of the sandwich hybridization and LFDA. Dendritic amplification takes place at the intersection between the probe DNA patterned surface and the interface of the laminar flow. F-SA: FITC-labeled streptavidin, B-anti-SA: biotinylated anti-streptavidin. Reproduced with permission.34 Copyright © 2012 Plos One. | ||
Traditional culture-based methods for nucleic acid detection are not appropriate for POC diagnosis, especially in undeveloped areas. Therefore, the development of POC diagnostics for nucleic acids is extremely important and have developed rapidly over the years.38 To facilitate sensitive nucleic acid detection, various amplification mechanisms have been developed, with polymerase chain reaction (PCR) being the most commonly used. However, PCR requires precise temperature control, which is not easily achieved in resource-limited settings, and is therefore difficult to use for POC applications. To address this challenge, Stedtfeld et al. developed a smartphone-based POC genetic testing device (termed Gene-Z, Fig. 3a)39 that is inexpensive, user-friendly and compact. The size of Gene-Z is 22.5 cm (L) × 17.3 cm (H) × 3.5 cm (H), and weighs 930 g. The Gene-Z device is composed of a disposable polymer-based microfluidic chip that allows for sample loading and processing; the device is also preloaded with dehydrated LAMP primers. The chip consists of four arrays of 15 reaction wells, which permitted simultaneous analysis of four samples for multiple pathogens in parallel. The Gene-Z showed good performance for the simultaneous detection of mecA gene and vicK gene for S. aureus and the stx2 gene and eaeA gene for E. coli (Fig. 3b) in an average time of 8.6 minutes, which is comparable to a conventional PCR instrument (9 minutes). Furthermore, the estimated commercial cost of the equipment will be less than $1000, with the cost of the disposable chips ranging from $2–$10.39 In a related example, a rapid, paper-based microfluidic- and smartphone-based protocol was developed for the extraction and direct fluorescence identification of the nucleic acids of Salmonella typhimurium from field and clinical samples.40 This platform utilized a custom built fluorescence microscope, which attached to a smartphone as detector, and an LED light source to illuminate the samples. Using this system, the limit of detection of Salmonella typhimurium in poultry packaging liquid was 103 CFU mL−1 (cellulose paper), while that extracted with nitrocellulose paper was 104 CFU mL−1.40 In another recent example, a smartphone was adapted to conduct fluorescence spectrophotometry by using the internal camera of a smartphone, combined with a set of optical components (for providing wavelength dispersion) and a compact, inexpensive green laser pointer (serves the function of a highly sensitive fluorescence spectrometer).41 A specific miRNA sequence was detected with 10 pM limit of detection in the presence of interfering miRNA that had a sequence with a single base mismatch.41
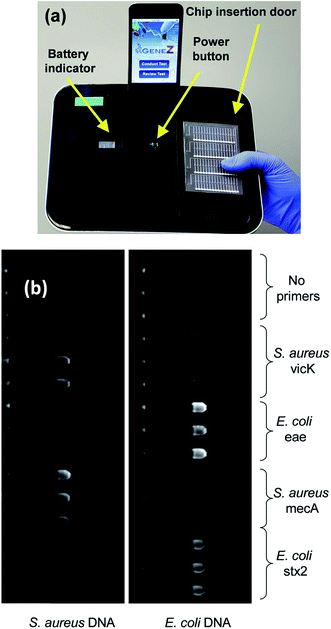 | ||
| Fig. 3 (a) Picture of the Gene-Z prototype with the iPod docked on the recharge port and the disposable chip sitting on the door that is used for insertion (b) parallel detection of multiple pathogens and VMGs using the Gene-Z. Fluorescence image of the two arrays of the chip after 60 min of amplification. The layout of primers dehydrated in the chip during assembly, and composition of the samples added in each array is indicated. Samples consisted of 3.1 × 10⁴ and 2.0 × 10⁴ genome copies per reaction well of S. aureus and E. coli, respectively. Reproduced with permission.39 Copyright 2012, Royal Society of Chemistry. | ||
Despite the fact that microfluidic devices have certain benefits for DNA detection, the analysis of complex samples found in the real world is still complicated. For example, untreated throat and nasopharyngeal swabs for influenza detection contain sample-degrading nucleases, PCR inhibitors, and aggregation factors.42–44 Therefore, effective sample preparation, including target amplification and purification from complex backgrounds is of great importance when analyzing unpurified/untreated samples. In an example published by Ferguson et al.45 a fully integrated, disposable and portable device was developed to detect RNA specific to the H1N1 virus using a patient's throat swab sample. In this work, a single microfluidic device was developed that was capable of immunomagnetic target capture, pre-concentration and separation, PCR amplification, and final electrochemical detection (Fig. 4). By taking advantage of the multifunctional sample preparation chamber and antibody-modified magnetic beads, all steps of sample treatment including target capture, high-throughput target enrichment, and reverse-transcriptase polymerase chain reaction (RT-PCR), can be carried out without nonspecific enzyme adsorption and loss of sample. This system can be configured to detect a wide range of RNA or DNA-based targets in unprocessed real samples with high sensitivity (10 TCID50, which is 50% Tissue Culture Infective Dose), and short analysis time (3.5 h). This device has many attributes that make it extremely useful for POC diagnosis.
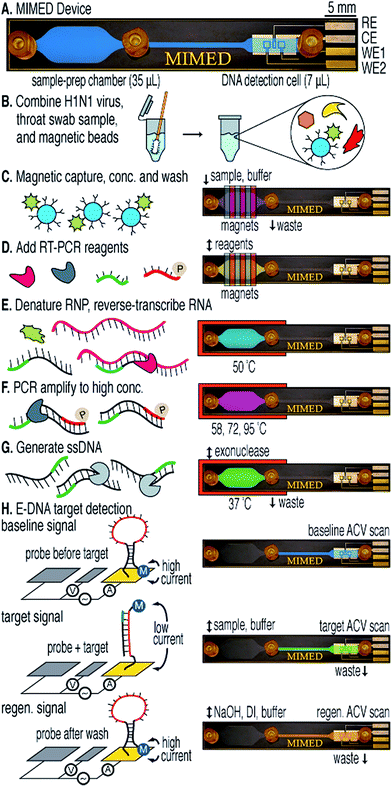 | ||
| Fig. 4 Sample-to-answer genetic analysis of H1N1 virus. (A) The 1 × 6 cm device features three fluidic ports: sample/buffer/reagent input (left), waste output (center), and E-DNA product output (right). Capture, RT-PCR, and ssDNA generation are performed in the sample preparation chamber; detection is performed in the electrochemical DNA detection cell. (B) A throat swab is collected and combined with influenza virus and antibody-coated magnetic beads in a tube containing RNA stabilizer. (C) The sample is pumped into the device where external magnets capture, concentrate, and purify labeled viral RNP in the sample preparation chamber. (D) RT-PCR mix is injected. (E) The chip is heated to denature the RNP and release the RNA. (F and G) RTPCR is performed on-chip followed by lambda exonuclease-mediated ssDNA generation. (H) Product is pumped into the DNA detection cell, where hybridization is measured via AC voltammetry. Reproduced with permission.45 Copyright © 2011, American Chemical Society. | ||
The gene amplification methods mentioned above have been extensively studied, and widely used by researchers. While this is the case, many other approaches have also been developed that have specific advantages compared to amplification approaches that can be used for sensing and biosensing.46–48 For example, Asher et al. developed polymerized colloidal crystal array (CCA) hydrogel sensing materials. These photonic materials (PMs) were generated in such a way that their volume changes when exposed to specific external stimuli, resulting in a shift of the Bragg diffraction of the CCA, and therefore yielding visual color changes that can be observed by the naked eye.49,50 The Serpe group also investigated Fabry–Pérot etalons (or simply etalons) as easy to use, robust and versatile sensors for POC applications.51,52 In one example, the etalons were used in systems that can be used for DNA sensing. Specifically, Serpe and coworkers synthesized poly(N-isopropylacrylamide-co-N-(3-amino-propyl)methacrylamide hydrochloride) (pNIPAm-co-APMAH) microgels via temperature ramp, surfactant-free, free radical precipitation polymerization and then generated etalons from them. PNIPAm-co-APMAH microgels are positively charged at pH 7.2, when negatively charged DNA is added to the etalon, the microgels are crosslinked and collapsed due to electrostatics and the devices exhibit a spectral shift.53 The sensing scheme detailing the specificity of the device is shown in Fig. 5.53
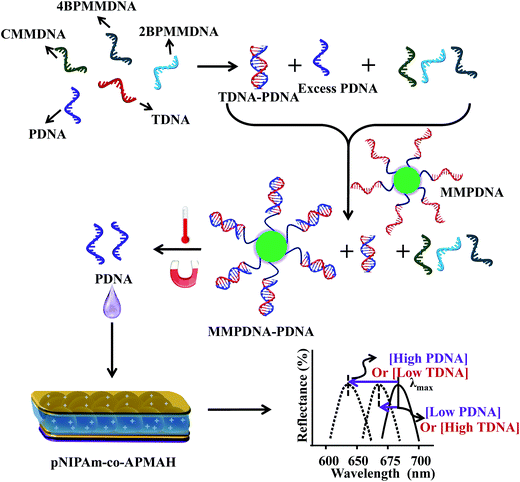 | ||
| Fig. 5 The protocol used for indirectly sensing target DNA (TDNA), by sensing probe DNA (PDNA). An excess amount of PDNA is exposed to a solution containing TDNA and DNA with a completely mismatched sequence (CMMDNA), and DNA with four (4BPMMDNA) and two base mismatches (2BPMMDNA). The PDNA binds the TDNA completely, leaving behind excess, unbound PDNA in solution. Magnetic microparticles (MMPDNA) that are functionalized with the complete complement to PDNA are added to the solution to capture the excess PDNA. In this case, a large spectral shift from the etalon corresponds to a large excess of PDNA, which means a low concentration of TDNA was present in the initial solution. The opposite is true as well—a low concentration of PDNA left in solution yields a small spectral shift from the device, meaning there was a large amount of TDNA present in the initial solution. This illustrates the strength of the current system—low concentrations of TDNA yield large spectral shifts making the device more sensitive to low DNA concentrations. Reproduced with permission.53 Copyright © 2014, Springer-Verlag Berlin Heidelberg. | ||
As can be seen in Fig. 5, an excess amount of probe DNA (PDNA) is exposed to a solution containing target DNA (TDNA) and DNA with a completely mismatched sequence (CMMDNA), and DNA with four (4BPMMDNA) and two base mismatches (2BPMMDNA). The PDNA hybridize with the TDNA, leaving behind excess, unbound PDNA in solution. Magnetic microparticles that are functionalized with the complete complement to PDNA (MMPDNA) are added to the solution to capture the excess PDNA. An external magnet is then used to isolate the magnetic microparticles bound with PDNA (MMPDNA–PDNA) and excess MMPDNA that didn't react with PDNA from the solution. After washing the MMPDNA–PDNA and MMPDNA, the PDNA is recovered by heating the solution to melt the DNA off of the MMPDNA–PDNA, and the excess PDNA is recovered and added to the etalon. In this case, a large spectral shift from the etalon corresponds to a large excess of PDNA, which means a low concentration of TDNA was present in the initial solution. Vice versa, a low concentration of PDNA left in solution yields a small spectral shift from the device, meaning there was a large amount of TDNA present in the initial solution. This illustrates the strength of the current system—lower concentration of TDNA yields larger spectral shifts, making the device more sensitive to low DNA concentrations.
Plasmonic-based optical devices have also generated significant interest as POC diagnostics.54–58 Early reports from the Mirkin group illustrated the utility of nanomaterials for nucleic acid detection.59 In one example, two sets of gold nanoparticles (Au-NPs) were modified with non-complementary oligonucleotide sequences that act as probes for target DNA of a specific sequence. When target DNA containing the complementary sequence for both DNA probes is present, the solution changes its color due to the induced aggregation of the Au-NPs. As a result of this observed phenomenon, it was suggested that the system could be used as a “litmus test” for direct DNA detection. The Mirkin group also developed a scanometric chip-based DNA sensing platform using a single immobilized nanoparticle probe.60 The biosensor combines the sharp melting profiles of DNA modified with Au-NPs61 and the signal amplification provided by the reduction of silver(I) on the surface of the nanoparticles to yield highly sensitive/selective (single mismatch resolution) detection of DNA. This is detailed in Fig. 6. Specifically, oligonucleotides (capturers) are immobilized on a transparent microscope slides and Au-NPs probes are modified with non-complementary synthetic oligonucleotides. The capturer and the Au-NPs probes cohybridize with the target DNA strand on the glass substrate. The signal is amplified by reducing silver(I) by hydroquinone on the surface of the immobilized Au-NPs and then visualized by flatbed scanner or by the naked eye. In the absence of the target DNA, no signal is visualized due to lack of Au-NPs probes immobilized on the surface of the chip, meaning that nonspecific binding of the probes on the glass substrate is not occurring. This technique was further improved upon to allow the detection of multiple DNA targets.62 This was achieved by attaching different Raman dyes to oligonucleotides. Specifically, a Raman label was inserted between the Au-NPs and the oligonucleotide, and each Raman label was specific for a single DNA sequence and generates a specific Raman spectrum. The authors found that no Raman scattering was observed before silver amplification but showed up only after silver reduction on the nanoparticles surface. This biosensor provides the advantage of multiple oligonucleotide detection using a single laser excitation and needing only a one spectrum.
 | ||
| Fig. 6 Three-component scanometric assay for specific oligonucleotide detection reported by Mirkin group. Reproduced with permission.61 Copyright © 2000, The American Association for the Advancement of Science. | ||
The direct detection of DNA using surface enhanced Raman spectroscopy (SERS)-based chip biosensors has also been achieved by modifying the surface of the chip with a labeled DNA beacon probe that contains a complementary sequence of the target DNA. The Vo-Dinh group has been involved in the development of various SERS-based plasmonic nucleic acid sensing platforms, using SERS molecular sentinel-on-chip biosensors.63–66 A label-free DNA biosensor reported by the Vo-Dinh group consists of a metal film deposited over a substrate coated with a closed-packed array of polystyrene nanospheres (nanowave); this was recently coined as metal film over nanosphere (MFON) by the Van Duyne group (discussed in Sections 3 and 7). The molecular sentinel concept was developed by the Vo-Dinh group for the label-free detection of DNA. This consisted of a DNA strand linked at the MFON surface, which has a Raman label (Cy3 dye) attached to the other end. In the absence of the target DNA, the probe adopts a hairpin-like stem-loop configuration that keeps the Cy3 dye close to the nanowave surface, leading to an intense SERS signal. In the presence of the target DNA, the Cy3 dye moves away from the surface due to the complementary target DNA binding the probe, which causes the hairpin to open up, and extend away from the surface. This can be seen schematically in Fig. 7. This biosensor was used to detect human S-adenosyl methionine domain containing 2 gene (RSAD2), a common host-response inflammation biomarker.65 Additionally, the Vo-Dinh group used this strategy with some modifications for dengue detection.64 The MFON used in this technology utilizes Ag and Au films over the polystyrene nanospheres where thiolated probes labeled with Cy5 Raman dye are immobilized. The probe is hybridized with the placeholder that keeps the Cy5 dye away from the surface. When the biosensor is exposed to the target DNA, the placeholder hybridizes with the target DNA and the Raman labeled probe adapts a hairpin-like structure, bringing the Cy5 dye close to the surface that causes an increase in the SERS signal. Using the molecular sentinel technique, the Vo-Dinh group also reported a nanobiosensor based on a molecular sentinel immobilized on silver-coated gold nanostars (AuNS@Ag).66 In this example, the probe is bound to AuNS@Ag and is partially hybridized with an ssDNA (placeholder) that contains a free region for target DNA to bind. In the absence of the target, the probe is hybridized with the placeholder, keeping the Raman label (in this case, Cy5 dye) away from the surface and leading to a low signal. In the presence of the target sequence, the target DNA displaces the probe and hybridizes with the placeholder, leaving the nanostar. As a result, the single-stranded probe forms a stem-loop and brings the Cy5 dye close to the nanostar surface, resulting in a strong SERS signal. Furthermore, Florschutz et al. also reported a biosensing platform based on SPR for the detection of phytopathogenic RNA viruses.67 The sensor, called “Phytochip”, is composed of a SPR-chip and an on-chip-microfluidic system. The detection of RNA viruses is accomplished by the DNA probe hybridizing with the target RNA. The signal is collected with a CCD on three separate spots on the surface simultaneously, which is excited by three separate near-infrared emitting LEDs (810 nm). This technology provides a fast, label-free, and inexpensive route to plant virus RNA detection.
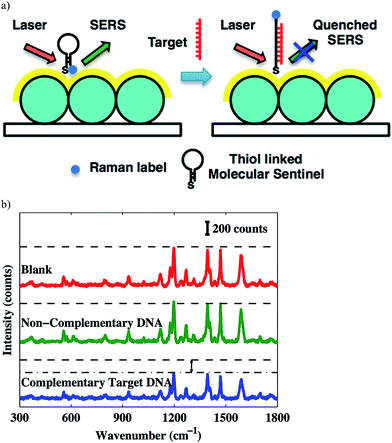 | ||
| Fig. 7 (a) Detection scheme of the complementary target DNA; (b) SERS spectra. Notice the decreasing signal intensity due the presence of target DNA.65 Copyright © 2013, American Chemical Society. | ||
3. Protein detection
Like DNA, proteins can be used to detect disease and various pathogens due to their unique sequences that can be directly related to a particular species. They are also convenient to use because they can be effectively/specifically captured and detected by probes such as antibodies and aptamers. Enzyme-linked immunosorbent assay13 is the most commonly used approach to measure the concentration of specific proteins in solution. However, their use for POC applications and in field-settings is inhibited by the necessity for relatively large and expensive readout instruments and a carefully controlled environment.In the past decade, the concept of paper-based biosensors was introduced. This was in an effort to make sensing devices that are more affordable than traditional sensors, disposable, environmental/user friendly and simple to use (i.e., minimal equipment required). The most common version of a paper-based diagnostic is a lateral flow assay (LFA), which utilizes capillary forces to wick sample fluids through paper strips loaded with reagents. The most recognizable LFAs are pregnancy tests strips. Usually the results of the assay can be determined with the naked eye in minutes. However, conventional LFAs often lack sensitivity, which limits their applications for the early diagnosis of disease. Although, the sensitivity of LFAs could be enhanced with target and/or signal amplification techniques. For example, enzyme amplification,68,69 silver enhancement solution,70 or Au nanoparticles71 could all be used to achieve this. Fu and coworkers modified a commercial strip test to detect human chorionic gonadotropin (hCG) by incorporating a Au nanoparticle amplification process for improved sensitivity in a 2-dimensional network device. This significantly decreased the LOD of the assay and still retained the positive aspects of a conventional LFA71 (Fig. 8).
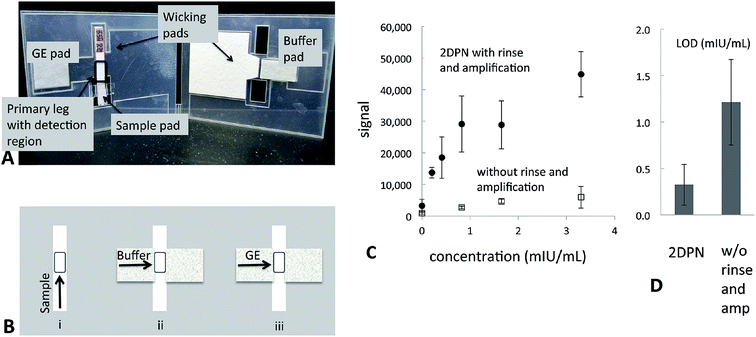 | ||
| Fig. 8 Two dimensional paper networks (2DPN) card allows for the automation of additional processing steps. (A) Image of a 2DPN card that performs rinse and signal amplification steps. (B) Schematic of the flow sequence in the 2DPN card. The user first loads gold enhancement (GE) solution, rinse buffer, and sample onto appropriate pads of the card. Sample flows in the primary leg of the card to the detection region (see “i” in panel B). The user folds the card at 20 min, such that fluids can flow through the secondary leg to the detection region of the card; buffer (see “ii” in panel B) and then GE solution (see “iii” in panel B). Additional steps could be implemented in a straightforward manner through extension of the network. (C) & (D) Comparison of sensitivity and LOD between the 2DPN card with and without rinse and amplification steps. Reproduced with permission.71 Copyright © 2011, American Chemical Society. | ||
Aiming to detect analytes in an easier, faster, and more convenient manner, much attention has been paid to smart phone-based techniques for biosensing.13,72–75 In very recent research, a hand-held and cost-effective cellphone-based colorimetric microplate reader was developed by using a 3D-printed opto-mechanical attachment to hold and illuminate a 96-well plate (Fig. 9).76 In this attachment, 96 individual optical fibers were bundled to collect signal from the 96-well plate. The diagnostic results obtained on this platform could be delivered to the user within ∼1 min per 96-well plate using a custom-designed cell phone app. Using this mobile platform, the authors evaluated four FDA-approved enzyme-linked immunosorbent assay13 tests including mumps IgG, measles IgG, and herpes simplex virus IgG (HSV-1 and HSV-2) in a clinical microbiology laboratory, and an accuracy of 99.6%, 98.6%, 99.4%, and 99.4% (the percent of positives from the device that resulted in a correct diagnosis using gold standard techniques) for mumps, measles, HSV-1, and HSV-2 tests was achieved, respectively. To achieve a similar goal, cell phone-based ELISA plate readers had been developed to detect C-reactive protein (CRP).77,78 A detection limit of 0.40 ng mL−1 (ref. 77) and 0.026 µg mL−1 (ref. 78) was obtained for CRP, and a detection limit of 0.11 ng mL−1 was obtained for horseradish peroxidase (HRP) detection.77 Alternatively, a smartphone based lab-on-a-chip POC device was developed that is capable of detecting histidine-rich protein 2 (HRP-2), an antigen specific to (malaria) in blood samples using a handheld device, which is easily attached to a single smartphone.79 A detection limit of 1 pg mL−1 for HRP-2 was achieved within 10 min in blood sample (10% diluted in PBS buffer).79 We note here that researchers are interested in developing sensors for HRP mainly due to its common use for developing chromogens for indirect detection of other analytes.80,81 Smartphone-based optical biosensors have also been developed as potential POC devices for the detection of multiple proteins.82,83 Giavazzi et al. reported a smartphone-based portable biosensor which allowed parallel, label free detection of multiple biomarkers in a few minutes.82 Reflective phantom interface (RPI) technology was used to measure the intensity of light reflected at an interface with very low reflectivity in water. Using a cuvette-based, pre-assembled, disposable plastic cartridge, they demonstrated that the system can be used for detecting nM concentrations of markers for HIV and Hepatitis B in serum.82 Another example using the integrated camera of smartphone as a spectrometer was developed by Gallegos et al., using a photonic crystal as the signal transduction element. To accomplish this, a custom-designed cradle was designed to hold the smartphone in fixed alignment with the optical components, allowing for accurate and repeatable measurement of shifts of light wavelengths reflected from the photonic crystal. Using this smartphone-based biosensor, porcine immunoglobulin G (IgG) was detected down to 4.25 nM using an immobilized layer of protein A. The authors claimed that the system's limit of detection can be reduced further through the use of a variety of tags, such as secondary antibodies or nanoparticles.83 In addition to optical sensing, smartphones have also been modified for to be used for electrochemical-based biosensing.84,85 In one example, a smartphone-controlled electrochemical impedance spectroscopy86 biosensing system was developed to detect proteins for POC testing.84 This system could detect bull serum albumin (BSA) and thrombin as low as 1.78 µg mL−1 and 2.97 ng mL−1, respectively.84 In another example, a mobile phone-based electrochemical platform was developed that utilized an embedded circuit for signal processing and data analysis, disposable microfluidic chips for fluidic handling and biosensing, and capillary flow for sample loading, processing, and pumping.85 This system was used to detect Plasmodium falciparum histidine-rich protein 2 (PfHRP2), which is a biomarker for malaria. This biomarker could be detected within minutes with a lower limit of detection of 16 ng mL−1 in human serum.85 The Walt group also demonstrated that protein profiling could be accomplished by integrating microfluidic technology with a charge-coupled device (CCD).87,88 The technique can be applied to detect various diseases.89 Specifically, they developed a microdose-scale (≤100 µg) injectable formulation of nanoparticles that interrogate the activity of thrombin (a key regulator of blood clotting) and produce urinary reporters of a disease state. They established a customized single molecule detection assay that enables urinary discrimination of thromboembolic disease in mice using doses of the nanoparticles diagnostic agents that fall under regulatory guidelines for microdosing. It turned out that 0.2 pmol synthetic biomarkers are enough to diagnose thrombosis in vivo when paired with the single molecule array assay they developed.
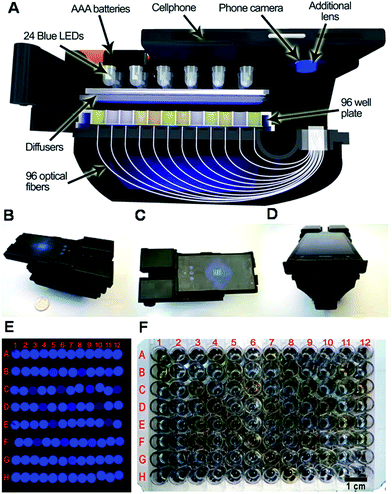 | ||
| Fig. 9 (A) Schematic overview and different perspectives (B–D) of the cellphone based ELISA colorimetric reader. Sample image (E), and sample plate (F). Rows and columns are labeled in (E) to correspond with the plate in (F). Reproduced with permission.76 Copyright © 2015 American Chemical Society. | ||
Though there are some works based on ELISA while do not require enzyme-labeled antibodies,90,91 ELISA assays are standard techniques used for protein detection that rely on HRP or alkaline phosphatase labeled-antibodies. The advantage of using enzyme-labeled antibodies is the extensive library of various colors of fluorescent and chromogenic substrates that can be used to detect various analytes. Although, the enzymes can be expensive, and their attachment to other biomolecules requires additional steps, and introduces new challenges. Alternatively, Au-NPs have attracted much attention for bioassays over the past years due to their unique optical properties, great stability in physiological conditions, and can be easily modified with various kinds of biomolecules. Their technical advantages include the elimination of extra incubation and washing steps required by ELISA assays, which is time consuming; no need for signal-amplification strategies, sometimes required in ELISA assays in order to increase its sensitivity, and most important, they do not require enzyme labeled antibodies. Furthermore, recent reports have suggested the use of Au-NPs as a multienzyme carrier in ELISA assay to increase its sensitivity and decrease assay time.92,93 In addition, their plasmon resonance properties can be well manipulated by varying the nanoparticle composition, size, and shape. The surface of metal nanomaterials can be readily functionalized via the formation of self-assembled monolayers (SAM) of biomolecular recognition elements (ligands/biotin, proteins, DNA, antibodies), providing further benefits. Tokel et al. published a review paper highlighting important concepts and achievements toward plasmonic platforms for POC applications.94 Hafner and coworkers reported a localized surface plasmon resonance (LSPR)-based immunoassay for the detection of antigens.95 This immunoassay utilizes gold nanorod-modified substrates, at which a self-assembled monolayer of mercaptohexadecanoic acid and mercaptoundecanol is created and rabbit IgG antibodies are bound via carbodiimide coupling chemistry. Interaction with goat antirabbit IgG secondary antibody is monitored through shifts in the LSPR spectrum. Moreover, Yoo and coworkers reported an immunoassay for the detection of streptavidin and avidin by coating Au-NPs with biotin and exposing them to different solutions containing blood proteins. The Au-NPs bind specifically to streptavidin, which caused a color shift when streptavidin was present in solution.96 No cross reactivity with myoglobin, hemoglobin and cytochrome C was observed. These assays are highly specific and have been shown to be very promising for the detection of proteins, which can be easily integrated into chip-based portable biosensors. Even though streptavidin is not a clinically relevant analyte, the finding is important because the concept can be easily modified and applied to other detect other analytes.97 A more recent biosensor based on using a silver film over nanosphere (AgFON) configuration for protein detection was reported by the Van Duyne group.98 The sensor uses immobilized aptamers specific to Ricin B chain (RBC) and can be used to directly detect Ricin, a highly toxic globular protein, in human blood. The phosphate backbone of the aptamers were phosphorothioate modified to increase their stability toward nuclease activity. As such, the biosensor was shown to be stable in blood for 10 days and still able to achieve a detection limit of 1 µg mL−1.
Lee et al. developed a plasmonic chip-based biosensor for the label-free detection of multiple cancer biomarkers such as alpha-fetoprotein (AFP), carcioembryonic antigen (CEA), and prostate specific antigen (PSA).99 The chip is composed of a glass support coated with trichloro(octadecyl) silane (OTS) containing specific hydrophilic sites (Fig. 10). Various immuno-AuNPs were immobilized at these hydrophilic sites, onto which the sample can be directly introduced to diagnose various diseases. In the presence of cancer biomarkers, the resonant wavelength of the AuNPs shifts due to the formation of biomarker protein–AuNPs complex, changing the surface plasmonic properties of the immuno-AuNPs. The LSPR peak intensity is extremely sensitive to the presence and concentration of the specific cancer biomarkers, showing no cross reaction with other serum and cancer biomarkers proteins. Furthermore, the Altug group has done extensive work on optofluidic nanoplasmonic-based biosensors for the label free detection of biomolecules with little to no sample preparation.100,101 The sensing platform consists of a suspended nanohole array grating that provides extraordinary light transmission resonances due to its high surface area and plasmonic effects (Fig. 11I). The strong resonance signals are highly correlated with the dielectric constant of the surrounding environment and are observed at specific wavelengths. Antiviral antibodies were immobilized at the sensor surface for virus/biomolecule recognition. When virus/biomolecules are recognized and bound by the antibodies attached on the sensor surface, the refractive index of the medium increases, leading to a red shift in the resonance wavelength. This biosensor was successfully used to detect intact vesicular stomatitis virus directly from biological media. Later, the described nanohole-based sensing platform was integrated into a handheld biosensor (Fig. 11II). The on-chip plasmonic biosensor utilizes a complementary metal–oxide–semiconductor (CMOS)-based imager chip and a light-emitting diode (LED) to record the diffraction patterns when biomolecules are absorbed on the nanohole plasmonic chip surface. The detection principle is the same as described above for optofluidic nanoplasmonic biosensor.
 | ||
| Fig. 10 Step-by-step illustration of the plasmonic biosensor chip fabrication. The hydrophilic regions are modified with glutaraldehyde for the attachment of AuNPs in the free carboxyl groups. Reproduced with permission.99 Copyright © 2015 Elsevier B.V. | ||
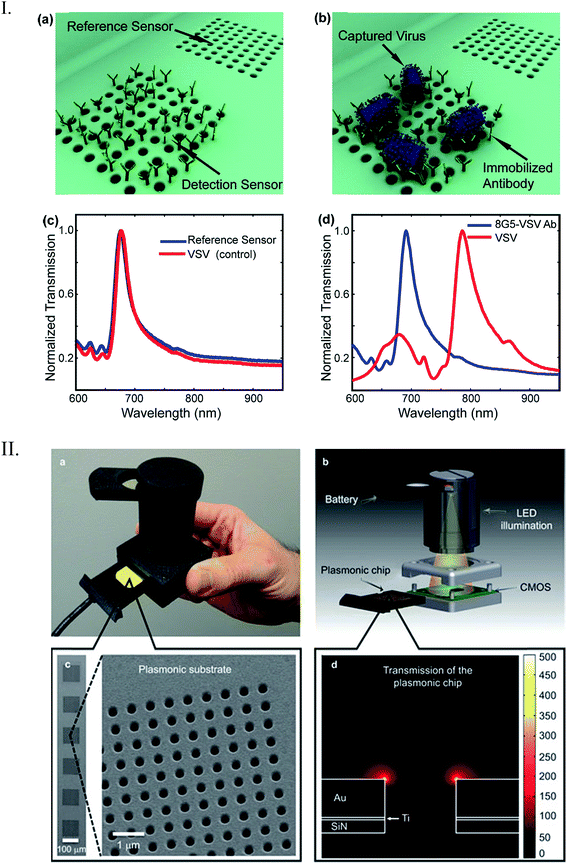 | ||
| Fig. 11 (I) Detection scheme by optofluidic plasmonic biosensor based on light transmission. (a) Immobilized antibodies on the sensor surface for specific vesicular stomatitis virus (VSV) recognition (b). There was no observed wavelength shift for control experiments (c) due to non-immobilization of the virus. However, a big shift was observed when the VSV was absorbed on the chip surface (d). (II) Illustration of the nanohole chip integrated into an on-chip sensing device. The biosensor consists of an excitation light source (LED), a nanohole array-based chip for pathogen recognition-absorption, and a CMOS imager chip for data collection. Reproduced with permission.100,101 Copyright © 2014, Rights Managed by Nature Publishing Group; Copyright © 2010, American Chemical Society. | ||
The nanohole array-based biosensing strategy is growing in interest for biosensing applications due to their unique resonant transmission properties. In one example, the Brolo group has developed a flow-through nanohole array biosensor (Fig. 12) composed of a 15 × 15 µm2 chip with 30 × 30 nanohole array; the nanoholes have diameters between 250–300 nm and a periodicity of 450–700 nm.102 The biosensor was first used to monitor the adsorption of monoclonal antibodies against paired-box gene 8 (PAX8) that is highly expressed in ovarian carcinomas. The formation of a SAM of dithiobis(succinimidyl)undecanoate and the immobilization of PAX8 specific monoclonal antibody was monitored by surface plasmon resonance spectroscopy (SPR). Further computational and experimental studies toward analyte transport and response for flow-through technique confirmed a 40-fold analyte flux and 20-fold response time improvement over traditional flow-over strategy.103 This periodic plasmonic nanostructured chip was incorporated into a device for monitoring in real-time the production of antibodies secreted by immobilized cells. The biosensor is composed of a square array of milled nanoholes aligned with a microwell cell trap where many antibody secreting cells (ASCs) have been immobilized (5–10 cells per trap). To this square array, biotinylated antigens (Ag) were immobilized and used for antibody recognition/immobilization. When the trapped cells secrete monoclonal antibodies that bind to the antigens immobilized on the nanohole array, a peak shift in the extraordinary optical transmission (EOT) spectrum is induced and thus the interaction between the antibody–Ag can be rapidly detected. Using this strategy, it was possible to individually monitor the production of antibodies by several ASC trapped in a single micromachined slide.104 Moreover, the Masson group developed a 96-well gold nanohole array plasmonic sensing platform and used it to detect IgG antibodies, prostate specific antigen (PSA) and methotrexate (MTX) molecules.105 They also report a plate reader with the ability to control the light incidence angle, which is required for high sensitivity. The nanohole arrays were created by photolithography technique that yielded highly uniform nanoholes over a glass wafer. For the sensing of IgG, anti-IgGs were immobilized on the sensor surface and the binding of IgGs, which causes a plasmonic shift, was monitored by the multiwell plate reader with high incidence angle. In addition, the same multiwell plate reader was able to detect small proteins such as PSA that are typically difficult to detect and usually require a secondary antibody amplification step. The versatility of the biosensor was also demonstrated by detecting MTX molecules, a drug used in chemotherapy treatments. The reported multiwell biosensor was shown to be a promising biosensing technique that could be an alternative for ELISA.
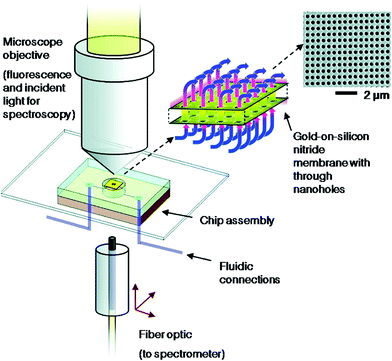 | ||
| Fig. 12 Flow-through nanohole arrays biosensing scheme developed by Brolo group. Reproduced with permission.102 Copyright © 2009, American Chemical Society. | ||
In a previous study, the Serpe group established that pNIPAm-co-AAc microgel-based etalons at high pH (above the pKa of AAc, ∼4.25) could deswell when exposed to poly(diallyldimethylammonium chloride) (pDADMAc), which is a positively charged linear polymer.106 This is a result of the pDADMAc penetrating the etalon, resulting in electrostatic interaction induced intra and intermicrogel crosslinking and collapse. This collapse led to an observable peak shift in the reflectance spectrum.
Making use of this phenomenon, they designed a strategy to detect streptavidin. To accomplish this, poly(allylamine hydrochloride) (PAH), which is “completely” charged at pH < ∼9.0, was modified with biotin (PAH–biotin). They found the PAH–biotin could also penetrate the etalon and crosslink the microgel layer, leading to a spectral shift. Likewise, they showed that the extent of the reflectance peak shift depended on the amount of PAH–biotin added to the etalon until the etalon was “saturated”.107 As shown in Fig. 13, for sensing streptavidin, they exposed aqueous solution of PAH–biotin to different amounts of streptavidin; the concentration of PAH–biotin was always kept high enough to leave excess PAH–biotin in solution after all the PAH–biotin–streptavidin complexes have formed. Then, biotin-modified magnetic microparticles were added to the solution, which bound to the PAH–biotin–streptavidin complexes. An external magnet was used to remove the magnetic particles bound with PAH–biotin–streptavidin and excess magnetic microparticles from the solution. The solution containing the excess, unbound PAH–biotin was subsequently separated and added to the etalon (made with pNIPAm-co-AAc) stabilized in pH 7.2. At this pH, microgels are negatively charged and the solution was kept at 25 °C. When the PAH–biotin was added to the etalon, it resulted in a blue shift of the etalon's reflectance peaks (the sensing mechanism is shown in Fig. 13). They found that the extent of the blue shift depends inversely on the amount of streptavidin initially added to the PAH–biotin. That is, a lower concentration of streptavidin initially present in solution yields a larger amount of excess, unbound PAH–biotin after the reaction. When the excess PAH–biotin is added to the etalon, a larger peak shift in the reflectance peaks was observed. Alternatively, a higher concentration of streptavidin initially present in solution yields a smaller amount of excess, unbound PAH–biotin that is added to the etalon, which gives a smaller etalon response.
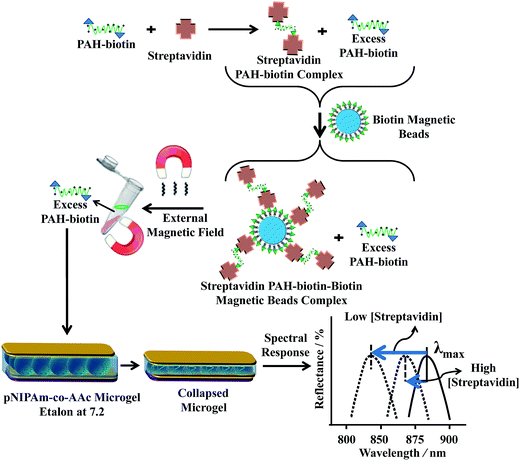 | ||
| Fig. 13 The proposed sensing mechanism. Streptavidin (the analyte) is added to an excess amount of biotin-modified poly(allylamine hydrochloride) (PAH). The PAH–biotin–streptavidin complex is then removed from solution using biotin modified magnetic particles, leaving behind free, unbound PAH. The unbound PAH is subsequently added to a pNIPAm-co-AAc microgel-based etalon immersed in aqueous solution at a pH that renders both the microgel layer and the PAH charged. As a result, the etalon's spectral peaks shift in proportion to the amount of PAH–biotin that was added. This, in turn can be related back to the original amount of streptavidin added to the PAH–biotin. Reproduced with permission.107 Copyright © 2013 Elsevier B.V. | ||
4. Bacteria detection
A major concern in the food industry, and for water supply management, is bacterial contamination. To prevent outbreaks of infection, the rapid detection of bacteria at the “POC” is required. Researchers around the globe have exploited microfluidic technologies that can be used to rapidly detect bacteria in samples. Specifically, there are hundreds of examples of microfluidic devices to detect E. coli in various samples. Some of them have outstanding performance, such as low LOD,108–110 short analysis time,111–113 and the ability to work with complex samples, such as unprocessed food.109,114–116In one example from 2011, a microfluidics-based bacteria detection assembly, which combines immunomagnetic capture and amperometric detection in a one-step sandwich format was reported by Laczka et al.108 This device integrates enzyme catalyzed redox reactions with electrochemistry to transfer the enzyme concentration to an electronic signal (current). Specifically, analytes were simultaneously captured by both anti-E. coli modified magnetic particles and horseradish peroxidase (HRP) enzyme labeled anti-E. coli antibodies where the HRP enzyme catalyzes the degradation of hydrogen peroxide (H2O2) in the presence of the mediator hydroquinone (HQ). The enzymatic reaction takes place in an incubation micro-chamber where the magnetic particles were confined, upstream from the working electrode. The enzyme product was then pumped along a microchannel, where it is amperometrically detected by a set of microelectrodes (Fig. 14). The whole assay can be completed in 1 h. The sensor exhibited a linear response for E. coli over concentrations ranging 102 to 108 cell per mL. Furthermore, without pre-enrichment steps, the limit of detection was 55 cells per mL in PBS, and 100 cells per mL in milk, with negligible interference by non-target bacteria such as Pseudomonas.108
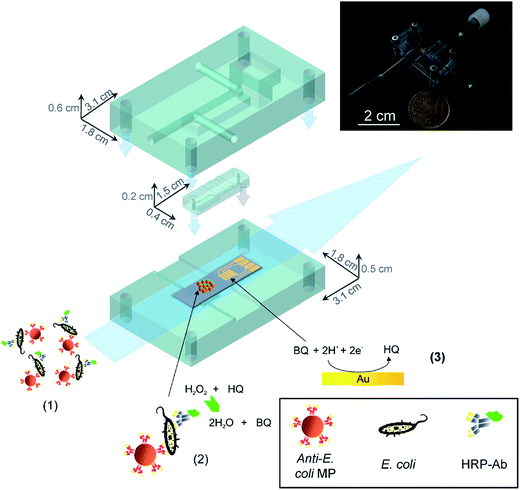 | ||
| Fig. 14 The assay consists of the following steps: (1) immunocapture of target bacteria with MP, labelling with HRP-Ab and injection in the microfluidic system. (2) Magnetic confinement of MP in the reaction chamber where enzyme reaction takes place. (3) Reduction of enzyme-produced BQ at the gold electrodes, downstream.108 Reproduced with permission.108 Copyright © 2011 Elsevier B.V. | ||
Srivastava and coworkers developed a SERS-based nanobiosensor chip for E. coli detection.117 The chip was made of a silica substrate onto which a silver nanosculptured thin film (nSTF) was formed and modified with T4 bacteriophage (Fig. 15). The biosensor proved to be highly specific and sensitive due to the strength of combining the plasmonic properties of the nSTF with the selectivity of the bacteriophage for E. coli. The authors used two different strains of E. coli (E. coli B and E. coli µX) to show the specificity of the biosensor and three other control bacteria (Chromobacterium violaceum, Paracoccus denitrificans and Pseudomanas aeruginosa). There were no observed changes in the SERS enhancement when the biosensor was treated with the three control bacteria. However, they observed a clear and distinct SERS enhancement trend at 1077 cm−1 for E. coli B and E. coli µX when increasing their concentration. As a result, the biosensor was able to detect the presence or absence of E. coli in an unknown sample, but it cannot distinguish between different E. coli strains. To address this issue, the authors showed that by a simple unknown sample dilution and comparison of its SERS enhancement trend with a standard trend for E. coli B and E. coli µX it was possible to identify which E. coli strain is presented in the unknown sample. The authors pointed out that the developed biosensor exhibits fast response, required low sample volumes, easy fabrication, low cost, great sensitivity, stability, and capability of long-term storage.
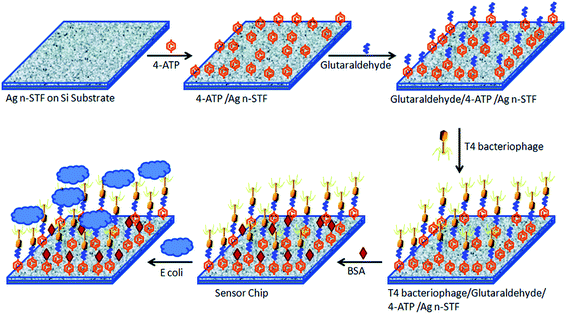 | ||
| Fig. 15 Schematic illustration for E. coli biosensor-chip development. The chip of silver nSTFs over a Si substrate is modified with a SAM of 4-aminothiophenol (4-ATP). This SAM is further modified with glutaraldehyde for phage immobilization. BSA is added to block unreacted glutaraldehyde. The chip is exposed to the sample and monitored using a fiber optic Raman spectrometer. Reproduced with permission.117 Copyright © 2015, Royal Society of Chemistry. | ||
5. Detection of other biomolecules
Smart phones have also been adapted to detect small molecules (e.g. metabolites and metal ions) in samples. Additionally, for routine clinical analysis, the concentrations of sodium, potassium, chloride, calcium, bicarbonate, glucose, urea and creatinine are measured. An imbalance in the concentration of one or more of these species could be an indicator of potential underlying disease. Awqatty et al. developed a smartphone-based fluorescent POC sensor for the measurement of a basic metabolic panel.118 To accomplish this, an iPhone 4S was modified to make it capable of measuring fluorescence, as can be seen in Fig. 16A. Measurements were performed in a 96 well plate at multiple concentrations of the ion or molecule of interest by measuring the intensity of fluorescence from rhodC18 (green channel) and CHIII (red channel) (Fig. 16B). By averaging the ratio of green channel intensity to red channel intensity of each pixel, the signal of each well was generated. This iPhone-based POC sensor exhibited a sensitivity of 10 mM for sodium, 1 mM for potassium, 0.18 mM for calcium, 11 mM for chloride, 0.15 pH unit for pH, 1.9 mM for glucose, 1.9 mM for bicarbonate, 0.7 mM for urea and 24 µM for creatinine.118 In addition to clinical POC tests, smartphone-based sensors also have been developed to measure ions and small molecules for monitoring environmental samples. Sumriddetchkajorn et al. developed a mobile phone-based portable device to monitor the chlorine concentration in water by analyzing two-dimensional color images.119 This demonstration showed a very promising result for determining the chlorine concentration in the range of 0.06–2.0 ppm.119 In another example, Wei et al. created an opto-mechanical attachment (weighs <40 g), which was integrated to the built-in camera module of a smartphone.120 Utilizing this smartphone attachable device, they demonstrated the digital quantification of mercury concentration by employing plasmonic gold nanoparticle and aptamer-based colorimetric transmission. Using a two-color ratiometric method employing light-emitting diodes (LEDs) at 523 and 625 nm, the mercury concentration could be quantified in a water sample with a limit of detection of ∼3.5 ppb. Moreover, a mercury contamination map was generated by measuring water samples at over 50 locations in California (USA), taken from city tap water sources, rivers, lakes, and beaches.120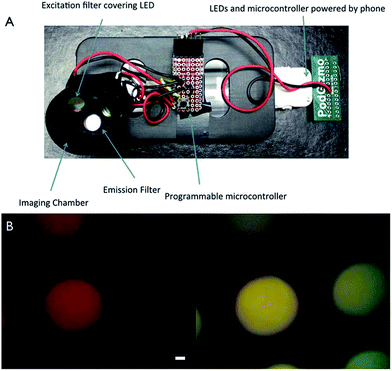 | ||
| Fig. 16 Use of an iPhone for sensor detection. (A) A plastic case houses the necessary components to convert an iPhone into a fluorescence device. The components of the device are labelled. (B) Fluorescent images from an iPhone of pH microparticle sensors showing the red channel (top) and the green channel (bottom), scale bar 1 mm. Reproduced with permission.118 Copyright © 2014, Royal Society of Chemistry. | ||
In a more recent publication, the Serpe group reported on a novel triglyceride sensor by exploiting their etalon technology. To accomplish this they synthesized microgels composed of N-isopropylacrylamide (NIPAm), 4-vinylpyridine and N-acryloxysuccinimide, and subsequently modified the microgels with lipase. They then made etalons with the modified microgels (Fig. 17).121 When triolein was added onto the etalon, an obvious blue shift was found for the peaks in the reflectance spectrum. They proposed that triolein was hydrolyzed into long chain fatty acid (C18H37COOH) by lipase inside the microgels. The long chain fatty acid could subsequently attach to the microgels via acid–base reaction between fatty acid and the microgel's pyridine groups. The lipophilicity of long chain fatty acid increases the hydrophobicity of microgels, hence water was expelled from the microgels, and they collapsed. This resulted in a blue shift of the etalon's reflectance peaks that increased with increasing triolein concentration.
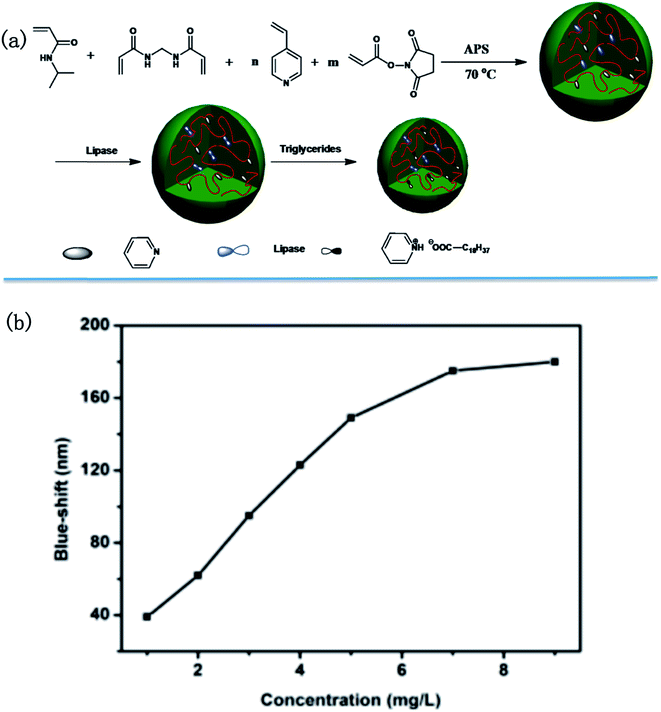 | ||
| Fig. 17 (a) Microgel synthesis scheme; (b) blue-shift as function of triglyceride concentration. Reproduced with permission.121 Copyright © 2015, Royal Society of Chemistry. | ||
Plasmonic materials have been developed to detect glucose concentration in samples. This is usually accomplished by immobilizing glucose receptors onto a substrate and monitoring the resonance wavelength as glucose interacts with the receptors, which changes the dielectric constant around the nanostructured material and shifts the resonance wavelength. A number of different substrates for glucose detection have been reported. For instance, Gupta et al. developed a SERS substrate based on mercaptophenyl boronic acid terminated Ag@AuNPs/graphene oxide.122 In addition, Danish and coworkers reported a class of SERS substrate with nanostructures fabricated on silicon wafer using a deep UV lithography for detection of glucose. These substrates provide specificity for the biosensor while nanoparticles provide high sensitivity.
The Van Duyne group introduced in 2003 the first direct glucose biosensor system using SERS.123 Since then, they have done extensive work in this field to increase device sensitivity, stability and overcome serum protein interferences.124 Their first reported biosensor was prepared by creating a SAM of straight chain alkanethiols such as 1-decanethiol on a AgFON surface where glucose is partitioned and preconcentrated near the active surface of SERS. The sensor is incubated with different glucose concentrations that caused an enhancement in the SERS glucose-related peaks. This biosensor was further improved by introducing a SAM of alkanethiol tri(ethylene glycol) instead of alkanethiol molecules. This hybrid hydrophobic/hydrophilic monolayer offered more stability and resistance to nonspecific adsorption, allowing for in vivo real-time glucose detection and quantification.
A more recent non-invasive potable SERS glucose biosensor was reported by Israa and coworkers.125 Here, the authors synthesized gold nanostar@silica core–shell nanoparticles functionalized with glucose oxidase (GOx) enzymes for label-free glucose detection (Fig. 18a). In this biosensor, immobilized GOx catalyzes the glucose oxidation reaction, producing hydrogen peroxide (H2O2) that shows a strong peak at 873 cm−1 on the SERS spectrum. The peak intensity in this region is remarkably dependent on the concentration of H2O2 being produced from the glucose oxidation reaction and it is also enhanced by the strong electromagnetic field of the gold nanostars (Fig. 18b). The concentration of glucose is detected with a portable Raman microscope and can be used for glucose detection levels in saliva, providing comfort for diabetic patients that need routine glucose tests.
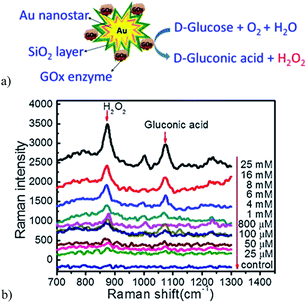 | ||
| Fig. 18 (a) Scheme illustration of glucose detection by the Au nanostar@silica core–shell nanoparticles based SERS sensor. (b) SERS spectra shown the Raman enhancement when the concentration of glucose is increased. Reproduced with permission.125 Copyright © 2011 Elsevier B.V. | ||
Hoare and Pelton developed microgels for sensing glucose in solution by detecting changes in the microgel diameter that occurred due to the glucose–microgel interaction.126 Similar to the etalon used for DNA sensing, researchers were able to utilize these microgels in structures that allow for glucose detection. To accomplish this, the Serpe group synthesized poly(N-isopropylacrylamide-co-acrylic acid) (pNIPAm-co-AAc) microgels, followed by modification of the microgels with 3-amino phenylboronic acid (APBA) by EDC (1-ethyl-3-(3-dimethylaminopropyl)carbodiimide) coupling reaction.127 These microgels were used to make etalons. The fabricated etalon was immersed into a basic buffer where the boronic acid moieties on the APBA (pKa = 8.2) were hydroxylated such that the boron possessed a negative charge. At this pH, the phenyl boronic acid moieties exist in equilibrium between the charged and uncharged state. But, the charged state is capable of binding such diols like glucose. As glucose binds, more boronic acid groups will convert to the charged state in order to maintain the equilibrium, which effectively lowers the APBA pKa (Fig. 19). When glucose is present, the bound state is preferred leading more hydroxylation of the boron atoms into a charged form. This leads to an increase in the coulombic repulsion of negative charges inside the microgel, thereby swelling the microgel, causing a red shift in the reflectance spectra of the etalon.
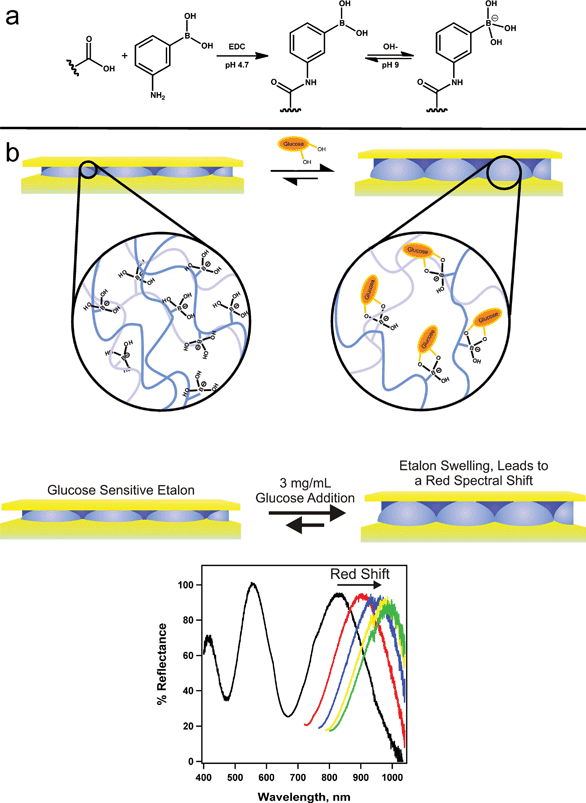 | ||
| Fig. 19 Reaction scheme for (a) the functionalization of the acrylic acid moieties on the microgel with 3-aminophenylboronic acid (APBA) followed by the activation of the boronic acid with base and (b) a cartoon depiction of the glucose responsivity of an APBA-functionalized microgel etalon at pH 9. Reproduced with permission.127 Copyright © 2012, Springer-Verlag. | ||
It is estimated that over 50% of all human proteins are glycosylated.128 Glycosylation can be found both on cell surfaces and in extracellular matrices, which creates the initial point of contact in cellular interactions.129 Increasing amounts of research has revealed the relationship between glycans/glycosylation, human health and disease.130–132 Hence, their detection is increasing in importance. In one example, Cao et al. described a microfluidic device coupled with quantum dot-based (QDs) immunofluorescence (IF) to measure the expression of glycans on the surface of single cells or a cell population.133 In this study, a microfluidic array compromised with 1400 microwells was fabricated by standard soft lithography methods, and each microwell has the space for a single cell (Fig. 20A and B). When the sample cell suspension flows through the device followed by treating with IF reagents including Con A, anti-Con A, and QDs-IgG, glycan-expressing cells would be bound with QDs-IgG and yield a fluorescence signal (Fig. 20C). The fluorescence micrograph of the whole microarray device can be used to analyze the cell population (Fig. 20D).
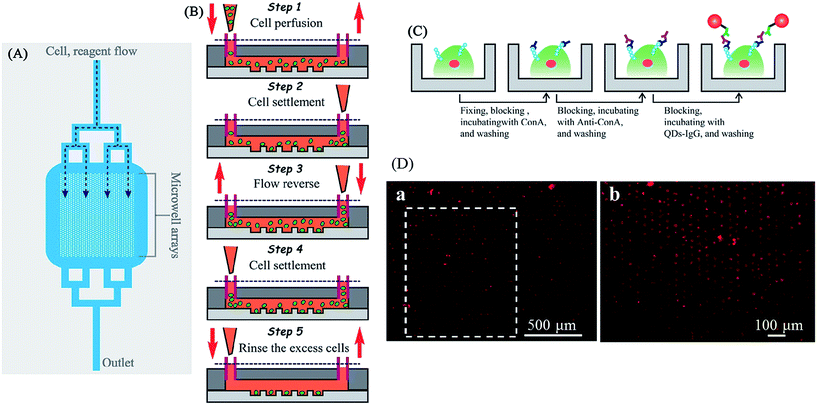 | ||
| Fig. 20 (A) A schematic diagram of the overall microfluidic device. Branching delivery channels ensured more equal distribution of flow with cells and reagents to each part of the chamber. Only one inlet and outlet were needed, cell and reagent flow were introduced from the upper inlet and entered the microwell arrays by hydro-gravity. (B) The process of cell suspension introducing and single cell trapping. A volume of 2.0 µL of K562 cell suspensions were introduced into the device (step 1). The flow was stopped, and the cells were allowed to settle down into the microwells (step 2). A drop of PBS was introduced into the outlet to reverse the flow direction, and the cells in the outlet were passing through the microwell region again (step 3). The flow was halted to allow the cells to settle down into the microwells (step 4). This process was repeated two or more times to achieve a satisfactory single cell occupancy. Then extra PBS medium immediately introduced into the inlet for removing out the residual cells between the microwells in the microchamber (step 5). (C) Schematic drawing of the microfluidic IF staining process. The major process followed as fixing → blocking → Con A incubating → washing → blocking → anti-Con A antibody incubating → washing → blocking → QDs-IgG incubating → washing and observation. (D) Fluorescence micrograph of QDs-IgG immunofluorescence for K562. (a) Large-area fluorescence microscopy imaging using a 4× objective with 1.5× magnification (1 s exposure). Cells were prefixed, treated with Con A, and then stained with anti-Con A and QDs-IgG. (b) The fluorescence image rotated 90° (white dashed box in part (A)) taken with a 10× objective (0.25 s exposure). Reproduced with permission.133 Copyright © 2012, American Chemical Society. | ||
6. Conclusion
In summary, rapid development in the fields of nanotechnology and biotechnology has clearly improved the fabrication of new devices for POC sensing. In this review, we have presented an overview of recent developments in portable POC devices to detect DNA/RNA, protein, glucose, bacteria and some other health-related molecules. Compared with conventional techniques that often require labor-intensive sample preparation and sophisticated instrument, these new devices show more promising applications for improving human health, especially in the developing world.High specificity and sensitivity of POC technologies have been achieved. The future development of POC devices will be driven by the needs of those that need this technology the most, e.g., those in resources-limited areas or those with mobility issues. This will involve the design of systems that are small, rugged, and easy to use while still being cost effective. To achieve this will require the collaboration of those in various science and engineering disciplines.
Acknowledgements
MJS acknowledges funding from the University of Alberta (the Department of Chemistry and the Faculty of Science), the Natural Sciences and Engineering Research Council of Canada (NSERC), the Canada Foundation for Innovation (CFI), the Alberta Advanced Education & Technology Small Equipment Grants Program (AET/SEGP), Grand Challenges Canada and IC-IMPACTS.References
- B. Nadjm and R. H. Behrens, Infect. Dis. Clin. North Am., 2012, 26, 243–259 CrossRef PubMed.
- R. P. Arasaradnam, J. Covington, C. Harmston and C. Nwokolo, Aliment. Pharmacol. Ther., 2014, 39, 780–789 CrossRef CAS PubMed.
- J. Heukelbach, C. H. Alencar, A. A. Kelvin, W. K. de Oliveira and L. P. de Góes Cavalcanti, J. Infect. Dev. Countries, 2016, 10, 116–120 Search PubMed.
- C. D. Chin, T. Laksanasopin, Y. K. Cheung, D. Steinmiller, V. Linder, H. Parsa, J. Wang, H. Moore, R. Rouse and G. Umviligihozo, Nat. Med., 2011, 17, 1015–1019 CrossRef CAS PubMed.
- P. K. Drain, E. P. Hyle, F. Noubary, K. A. Freedberg, D. Wilson, W. R. Bishai, W. Rodriguez and I. V. Bassett, Lancet Infect. Dis., 2014, 14, 239–249 CrossRef PubMed.
- N. P. Pai, C. Vadnais, C. Denkinger, N. Engel and M. Pai, PLoS Med., 2012, 9, e1001306 Search PubMed.
- R. Beaglehole, J. Epping-Jordan, V. Patel, M. Chopra, S. Ebrahim, M. Kidd and A. Haines, Lancet, 2008, 372, 940–949 CrossRef.
- F. Girosi, S. S. Olmsted, E. Keeler, D. C. H. Burgess, Y.-W. Lim, J. E. Aledort, M. E. Rafael, K. A. Ricci, R. Boer and L. Hilborne, Nature, 2006, 444, 3–8 CrossRef PubMed.
- K. A. Ricci, F. Girosi, P. I. Tarr, Y.-W. Lim, C. Mason, M. Miller, J. Hughes, L. Von Seidlein, J. M. Agosti and R. L. Guerrant, Nature, 2006, 444, 29–38 CrossRef PubMed.
- J. E. Aledort, A. Ronald, M. E. Rafael, F. Girosi, P. Vickerman, S. M. Le Blancq, A. Landay, K. Holmes, R. Ridzon and N. Hellmann, Nature, 2006, 444, 59–72 CrossRef PubMed.
- G. Schönian, A. Nasereddin, N. Dinse, C. Schweynoch, H. D. Schallig, W. Presber and C. L. Jaffe, Diagn. Microbiol. Infect. Dis., 2003, 47, 349–358 CrossRef.
- J. J. Walls, P. Caturegli, J. S. Bakken, K. M. Asanovich and J. S. Dumler, J. Clin. Microbiol., 2000, 38, 354–356 CAS.
- A. Roda, E. Michelini, M. Zangheri, M. Di Fusco, D. Calabria and P. Simoni, TrAC, Trends Anal. Chem., 2016, 79, 317–325 CrossRef CAS.
- G. Kuno, I. Gomez and D. Gubler, J. Virol. Methods, 1991, 33, 101–113 CrossRef CAS PubMed.
- G. Libeau, A. Diallo, F. Colas and L. Guerre, Vet. Rec., 1994, 134, 300–304 CAS.
- H. Gamble, W. Anderson, C. Graham and K. Murrell, Vet. Parasitol., 1983, 13, 349–361 CrossRef CAS PubMed.
- R. F. Louie, Z. Tang, D. V. Sutton, J. H. Lee and G. J. Kost, Arch. Pathol. Lab. Med., 2000, 124, 257–266 CAS.
- V. Poitout, D. Moatti-Sirat and G. Reach, Biosens. Bioelectron., 1992, 7, 587–592 CrossRef CAS PubMed.
- S. A. Butler, S. A. Khanlian and L. A. Cole, Clin. Chem., 2001, 47, 2131–2136 CAS.
- I. Platais, T. Tsereteli, R. Comendant, D. Kurbanbekova and B. Winikoff, Contraception, 2015, 91, 178–183 CrossRef PubMed.
- J. Pike, S. Godbert and S. Johnson, Expert Opin. Med. Diagn., 2013, 7, 435–441 CrossRef PubMed.
- K. Manasa, K. Manasa Priya, S. S. Reddy, S. S. Channappayya, S. Vanjari, D. Dendukuri, S. Sridharan, T. Choudhary and P. Bhandari, IEEE, Asilomar Conference on Signals, Systems and Computers, 2013, pp. 245–247 Search PubMed.
- B. Zheng and R. F. Ismagilov, Angew. Chem., Int. Ed. Engl., 2005, 44, 2520–2523 CrossRef CAS PubMed.
- G. M. Whitesides, Nature, 2006, 442, 368–373 CrossRef CAS PubMed.
- J. Wang, Y. Zhou, H. Qiu, H. Huang, C. Sun, J. Xi and Y. Huang, Lab Chip, 2009, 9, 1831–1835 RSC.
- X. Fang, Y. Liu, J. Kong and X. Jiang, Anal. Chem., 2010, 82, 3002–3006 CrossRef CAS PubMed.
- T. Notomi, H. Okayama, H. Masubuchi, T. Yonekawa, K. Watanabe, N. Amino and T. Hase, Nucleic Acids Res., 2000, 28, e63 CrossRef CAS PubMed.
- F.-X. En, X. Wei, L. Jian and C. Qin, J. Trop. Med. Hyg., 2008, 151, 35–39 CAS.
- S. S. Jeffrey, Nat. Biotechnol., 2008, 26, 400–401 CrossRef CAS PubMed.
- J. Lu, G. Getz, E. A. Miska, E. Alvarez-Saavedra, J. Lamb, D. Peck, A. Sweet-Cordero, B. L. Ebert, R. H. Mak and A. A. Ferrando, Nature, 2005, 435, 834–838 CrossRef CAS PubMed.
- A. Esquela-Kerscher and F. J. Slack, Nat. Rev. Cancer, 2006, 6, 259–269 CrossRef CAS PubMed.
- S. Volinia, G. A. Calin, C.-G. Liu, S. Ambs, A. Cimmino, F. Petrocca, R. Visone, M. Iorio, C. Roldo and M. Ferracin, Proc. Natl. Acad. Sci. U. S. A., 2006, 103, 2257–2261 CrossRef CAS PubMed.
- H. Arata, K. Hosokawa and M. Maeda, Anal. Sci., 2014, 30, 129–135 CrossRef CAS PubMed.
- H. Arata, H. Komatsu, K. Hosokawa and M. Maeda, PLoS One, 2012, 7, e48329 CAS.
- V. Jazbutyte and T. Thum, Curr. Drug Targets, 2010, 11, 926–935 CrossRef CAS PubMed.
- T. Thum, C. Gross, J. Fiedler, T. Fischer, S. Kissler, M. Bussen, P. Galuppo, S. Just, W. Rottbauer and S. Frantz, Nature, 2008, 456, 980–984 CrossRef CAS PubMed.
- K. Hosokawa, M. Omata and M. Maeda, Anal. Chem., 2007, 79, 6000–6004 CrossRef CAS PubMed.
- M. S. Cordray and R. R. Richards-Kortum, Am. J. Trop. Med. Hyg., 2012, 87, 223–230 CrossRef CAS PubMed.
- R. D. Stedtfeld, D. M. Tourlousse, G. Seyrig, T. M. Stedtfeld, M. Kronlein, S. Price, F. Ahmad, E. Gulari, J. M. Tiedje and S. A. Hashsham, Lab Chip, 2012, 12, 1454–1462 RSC.
- C. F. Fronczek, T. San Park, D. K. Harshman, A. M. Nicolini and J.-Y. Yoon, RSC Adv., 2014, 4, 11103–11110 RSC.
- H. Yu, Y. Tan and B. T. Cunningham, Anal. Chem., 2014, 86, 8805–8813 CrossRef CAS PubMed.
- R. A. Fouchier, T. M. Bestebroer, S. Herfst, L. Van Der Kemp, G. F. Rimmelzwaan and A. D. Osterhaus, J. Clin. Microbiol., 2000, 38, 4096–4101 CAS.
- E. Spackman and D. L. Suarez, Avian Influenza Virus, 2008, pp. 13–18 Search PubMed.
- L. Andreoletti, D. Hober, S. Belaich, P. Lobert, A. Dewilde and P. Wattre, J. Virol. Methods, 1996, 62, 1–10 CrossRef CAS PubMed.
- B. S. Ferguson, S. F. Buchsbaum, T.-T. Wu, K. Hsieh, Y. Xiao, R. Sun and H. T. Soh, J. Am. Chem. Soc., 2011, 133, 9129–9135 CrossRef CAS PubMed.
- X. Fan, I. M. White, S. I. Shopova, H. Zhu, J. D. Suter and Y. Sun, Anal. Chim. Acta, 2008, 620, 8–26 CrossRef CAS PubMed.
- A. Leung, P. M. Shankar and R. Mutharasan, Sens. Actuators, B, 2007, 125, 688–703 CrossRef CAS.
- W. R. Algar, A. J. Tavares and U. J. Krull, Anal. Chim. Acta, 2010, 673, 1–25 CrossRef CAS PubMed.
- L. Liu, P. Li and S. A. Asher, Nature, 1999, 397, 141–144 CrossRef CAS PubMed.
- M. M. Ward Muscatello, L. E. Stunja and S. A. Asher, Anal. Chem., 2009, 81, 4978–4986 CrossRef CAS PubMed.
- C. D. Sorrell, M. C. Carter and M. J. Serpe, Adv. Funct. Mater., 2011, 21, 425–433 CrossRef CAS.
- C. D. Sorrell and M. J. Serpe, Adv. Mater., 2011, 23, 4088–4092 CrossRef CAS PubMed.
- M. R. Islam and M. J. Serpe, Anal. Bioanal. Chem., 2014, 406, 4777–4783 CrossRef CAS PubMed.
- W. Mielczarek, E. Obaje, T. Bachmann and M. Kersaudy-Kerhoas, Lab Chip, 2016, 16, 3441–3448 RSC.
- C. L. Wong, U. Dinish and M. Olivo, Photonics Lasers Med., 2015, 4, 119–149 Search PubMed.
- P. Singh, Sens. Actuators, B, 2016, 229, 110–130 CrossRef CAS.
- J. Lu, T. Van Stappen, D. Spasic, F. Delport, S. Vermeire, A. Gils and J. Lammertyn, Biosens. Bioelectron., 2016, 79, 173–179 CrossRef CAS PubMed.
- D.-S. Wang and S.-K. Fan, Sensors, 2016, 16, 1175 CrossRef PubMed.
- C. A. Mirkin, R. L. Letsinger, R. C. Mucic and J. J. Storhoff, Nature, 1996, 382, 607–609 CrossRef CAS PubMed.
- T. A. Taton, C. A. Mirkin and R. L. Letsinger, Science, 2000, 289, 1757–1760 CrossRef CAS PubMed.
- R. Elghanian, J. J. Storhoff, R. C. Mucic, R. L. Letsinger and C. A. Mirkin, Science, 1997, 277, 1078–1081 CrossRef CAS PubMed.
- Y. C. Cao, R. Jin and C. A. Mirkin, Science, 2002, 297, 1536–1540 CrossRef CAS PubMed.
- H. T. Ngo, H. N. Wang, T. Burke, G. S. Ginsburg and T. Vo-Dinh, Anal. Bioanal. Chem., 2014, 406, 3335–3344 CrossRef CAS PubMed.
- H. T. Ngo, H. N. Wang, A. M. Fales, B. P. Nicholson, C. W. Woods and T. Vo-Dinh, Analyst, 2014, 139, 5655–5659 RSC.
- H. T. Ngo, H. N. Wang, A. M. Fales and T. Vo-Dinh, Anal. Chem., 2013, 85, 6378–6383 CrossRef CAS PubMed.
- H. N. Wang, A. M. Fales and T. Vo-Dinh, Nanomedicine, 2015, 11, 811–814 CAS.
- K. Florschutz, A. Schroter, S. Schmieder, W. Chen, P. Schweizer, F. Sonntag, N. Danz, K. Baronian and G. Kunze, J. Virol. Methods, 2013, 189, 80–86 CrossRef PubMed.
- C. Zhang, Y. Zhang and S. Wang, J. Agric. Food Chem., 2006, 54, 2502–2507 CrossRef CAS PubMed.
- J.-H. Cho, S.-M. Han, E.-H. Paek, I.-H. Cho and S.-H. Paek, Anal. Chem., 2006, 78, 793–800 CrossRef CAS PubMed.
- I.-H. Cho, S.-M. Seo, E.-H. Paek and S.-H. Paek, J. Chromatogr. B: Anal. Technol. Biomed. Life Sci., 2010, 878, 271–277 CrossRef CAS PubMed.
- E. Fu, T. Liang, J. Houghtaling, S. Ramachandran, S. A. Ramsey, B. Lutz and P. Yager, Anal. Chem., 2011, 83, 7941–7946 CrossRef CAS PubMed.
- H. F. Rashvand and K.-F. Hsiao, Multimed. Syst., 2015, 21, 103–119 CrossRef.
- O. D. Incel, M. Kose and C. Ersoy, BioNanoScience, 2013, 3, 145–171 CrossRef.
- A. S. M. Mosa, I. Yoo and L. Sheets, BMC Med. Inf. Decis. Making, 2012, 12, 1 CrossRef PubMed.
- J. C. Contreras-Naranjo, Q. Wei and A. Ozcan, IEEE J. Sel. Top. Quantum Electron., 2016, 22, 1–14 CrossRef.
- B. Berg, B. Cortazar, D. Tseng, H. Ozkan, S. Feng, Q. Wei, R. Y.-L. Chan, J. Burbano, Q. Farooqui and M. Lewinski, ACS Nano, 2015, 9, 7857–7866 CrossRef CAS PubMed.
- S. K. Vashist, T. van Oordt, E. M. Schneider, R. Zengerle, F. von Stetten and J. H. Luong, Biosens. Bioelectron., 2015, 67, 248–255 CrossRef CAS PubMed.
- C. M. McGeough and S. O'Driscoll, Biomedical Circuits and Systems, IEEE J. Biomed. Health Inform., 2013, 7, 655–659 Search PubMed.
- C. C. Stemple, S. V. Angus, T. San Park and J.-Y. Yoon, J. Lab. Autom., 2014, 19, 35–41 CrossRef CAS PubMed.
- B. Y. Uichong, P.-P. De Guzman and W. P.-W. Liu, Mitigation of biomolecular adsorption with hydrophilic polymer additives, Google Patents, 2013, US Pat. US8481125 B2.
- Y. Zhang, W. Ma, D. Li, M. Yu, J. Guo and C. Wang, Small, 2014, 10, 1379–1386 CrossRef CAS PubMed.
- F. Giavazzi, M. Salina, E. Ceccarello, A. Ilacqua, F. Damin, L. Sola, M. Chiari, B. Chini, R. Cerbino and T. Bellini, Biosens. Bioelectron., 2014, 58, 395–402 CrossRef CAS PubMed.
- D. Gallegos, K. D. Long, H. Yu, P. P. Clark, Y. Lin, S. George, P. Nath and B. T. Cunningham, Lab Chip, 2013, 13, 2124–2132 RSC.
- D. Zhang, Y. Lu, Q. Zhang, L. Liu, S. Li, Y. Yao, J. Jiang, G. L. Liu and Q. Liu, Sens. Actuators, B, 2016, 222, 994–1002 CrossRef CAS.
- P. B. Lillehoj, M.-C. Huang, N. Truong and C.-M. Ho, Lab Chip, 2013, 13, 2950–2955 RSC.
- A. Baeissa, N. Dave, B. D. Smith and J. Liu, ACS Appl. Mater. Interfaces, 2010, 2, 3594–3600 CAS.
- S. Nie, W. H. Henley, S. E. Miller, H. Zhang, K. M. Mayer, P. J. Dennis, E. A. Oblath, J. P. Alarie, Y. Wu and F. G. Oppenheim, Lab Chip, 2014, 14, 1087–1098 RSC.
- S. Nie, E. Benito-Peña, H. Zhang, Y. Wu and D. R. Walt, J. Visualized Exp., 2013, 80, e50726 Search PubMed.
- A. D. Warren, S. T. Gaylord, K. C. Ngan, M. Dumont Milutinovic, G. A. Kwong, S. N. Bhatia and D. R. Walt, J. Am. Chem. Soc., 2014, 136, 13709–13714 CrossRef CAS PubMed.
- W. Qu, Y. Liu, D. Liu, Z. Wang and X. Jiang, Angew. Chem., Int. Ed., 2011, 50, 3442–3445 CrossRef CAS PubMed.
- R.-J. Yu, W. Ma, X.-Y. Liu, H.-Y. Jin, H.-X. Han, H.-Y. Wang, H. Tian and Y.-T. Long, Theranostics, 2016, 6, 1732–1739 CrossRef PubMed.
- F. Zhou, M. Wang, L. Yuan, Z. Cheng, Z. Wu and H. Chen, Analyst, 2012, 137, 1779–1784 RSC.
- T. Emami, R. Madani, F. Golchinfar, A. Shoushtary and S. M. Amini, Monoclonal Antibodies Immunodiagn. Immunother., 2015, 34, 366–370 CrossRef CAS PubMed.
- O. Tokel, F. Inci and U. Demirci, Chem. Rev., 2014, 114, 5728–5752 CrossRef CAS PubMed.
- K. M. Mayer, S. Lee, H. Liao, B. C. Rostro, A. Fuentes, P. T. Scully, C. L. Nehl and J. H. Hafner, ACS Nano, 2008, 2, 687–692 CrossRef CAS PubMed.
- W.-J. Kim, S.-H. Choi, Y.-S. Rho and D.-J. Yoo, Bull. Korean Chem. Soc., 2011, 32, 4171–4175 CrossRef CAS.
- M. Islam, L. G. Bach, T.-S. Vo and K. T. Lim, J. Nanosci. Nanotechnol., 2015, 15, 176–180 CrossRef CAS PubMed.
- A. R. Campos, Z. Gao, M. G. Blaber, R. Huang, G. C. Schatz, R. P. Van Duyne and C. L. Haynes, J. Phys. Chem. C, 2016, 120, 20961–20969 CAS.
- J. U. Lee, A. H. Nguyen and S. J. Sim, Biosens. Bioelectron., 2015, 74, 341–346 CrossRef CAS PubMed.
- A. E. Cetin, A. F. Coskun, B. C. Galarreta, M. Huang, D. Herman, A. Ozcan and H. Altug, Light: Sci. Appl., 2014, 3, e122 CrossRef CAS.
- A. A. Yanik, M. Huang, O. Kamohara, A. Artar, T. W. Geisbert, J. H. Connor and H. Altug, Nano Lett., 2010, 10, 4962–4969 CrossRef CAS PubMed.
- F. Eftekhari, C. Escobedo, J. Ferreira, X. Duan, E. M. Girotto, A. G. Brolo, R. Gordon and D. Sinton, Anal. Chem., 2009, 81, 4308–4311 CrossRef CAS PubMed.
- C. Escobedo, A. G. Brolo, R. Gordon and D. Sinton, Anal. Chem., 2010, 82, 10015–10020 CrossRef CAS PubMed.
- S. F. Romanuik, S. M. Grist, B. L. Gray, D. Hohertz, K. L. Kavanagh, N. Gulzar, J. K. Scott, R. Nirwan, C. Hui and A. G. Brolo, IEEE Sens. J., 2011, 11, 2732–2739 CrossRef CAS.
- M. Couture, K. K. Ray, H.-P. Poirier-Richard, A. Crofton and J.-F. Masson, ACS Sens., 2016, 1, 287–294 CrossRef CAS.
- M. R. Islam, Y. Gao, X. Li and M. J. Serpe, J. Mater. Chem. B, 2014, 2, 2444–2451 RSC.
- M. R. Islam and M. J. Serpe, Biosens. Bioelectron., 2013, 49, 133–138 CrossRef CAS PubMed.
- O. Laczka, J.-M. Maesa, N. Godino, J. del Campo, M. Fougt-Hansen, J. P. Kutter, D. Snakenborg, F.-X. Muñoz-Pascual and E. Baldrich, Biosens. Bioelectron., 2011, 26, 3633–3640 CrossRef CAS PubMed.
- U. Dharmasiri, M. A. Witek, A. A. Adams, J. K. Osiri, M. L. Hupert, T. S. Bianchi, D. L. Roelke and S. A. Soper, Anal. Chem., 2010, 82, 2844–2849 CrossRef CAS PubMed.
- I. K. Dimov, J. L. Garcia-Cordero, J. O'Grady, C. R. Poulsen, C. Viguier, L. Kent, P. Daly, B. Lincoln, M. Maher and R. O'Kennedy, Lab Chip, 2008, 8, 2071–2078 RSC.
- C. Zhang, H. Wang and D. Xing, Biomed. Microdevices, 2011, 13, 885–897 CrossRef PubMed.
- X. Guan, H.-j. Zhang, Y.-n. Bi, L. Zhang and D.-l. Hao, Biomed. Microdevices, 2010, 12, 683–691 CrossRef CAS PubMed.
- D. J. You, K. J. Geshell and J.-Y. Yoon, Biosens. Bioelectron., 2011, 28, 399–406 CrossRef CAS PubMed.
- B. Lam, Z. Fang, E. H. Sargent and S. O. Kelley, Anal. Chem., 2011, 84, 21–25 CrossRef PubMed.
- K.-Y. Hwang, S.-Y. Jeong, Y.-R. Kim, K. Namkoong, H.-K. Lim, W.-S. Chung, J.-H. Kim and N. Huh, Sens. Actuators, B, 2011, 154, 46–51 CrossRef CAS.
- R. Riahi, K. E. Mach, R. Mohan, J. C. Liao and P. K. Wong, Anal. Chem., 2011, 83, 6349–6354 CrossRef CAS PubMed.
- S. K. Srivastava, H. B. Hamo, A. Kushmaro, R. S. Marks, C. Gruner, B. Rauschenbach and I. Abdulhalim, Analyst, 2015, 140, 3201–3209 RSC.
- B. Awqatty, S. Samaddar, K. J. Cash, H. A. Clark and J. M. Dubach, Analyst, 2014, 139, 5230–5238 RSC.
- S. Sumriddetchkajorn, K. Chaitavon and Y. Intaravanne, Sens. Actuators, B, 2014, 191, 561–566 CrossRef CAS.
- Q. Wei, R. Nagi, K. Sadeghi, S. Feng, E. Yan, S. J. Ki, R. Caire, D. Tseng and A. Ozcan, ACS Nano, 2014, 8, 1121–1129 CrossRef CAS PubMed.
- Q. M. Zhang, D. Berg, S. M. Mugo and M. J. Serpe, Chem. Commun., 2015, 51, 9726–9728 RSC.
- V. K. Gupta, N. Atar, M. L. Yola, M. Eryilmaz, H. Torul, U. Tamer, I. H. Boyaci and Z. Ustundag, J. Colloid Interface Sci., 2013, 406, 231–237 CrossRef CAS PubMed.
- K. E. Shafer-Peltier, C. L. Haynes, M. R. Glucksberg and R. P. Van Duyne, J. Am. Chem. Soc., 2003, 125, 588–593 CrossRef CAS PubMed.
- C. R. Yonzon, C. L. Haynes, X. Zhang, J. T. Walsh and R. P. Van Duyne, Anal. Chem., 2004, 76, 78–85 CrossRef CAS PubMed.
- I. Al-Ogaidi, H. Gou, A. K. Al-Kazaz, Z. P. Aguilar, A. K. Melconian, P. Zheng and N. Wu, Anal. Chim. Acta, 2014, 811, 76–80 CrossRef CAS PubMed.
- T. Hoare and R. Pelton, Macromolecules, 2007, 40, 670–678 CrossRef CAS.
- C. D. Sorrell and M. J. Serpe, Anal. Bioanal. Chem., 2012, 402, 2385–2393 CrossRef CAS PubMed.
- R. Apweiler, H. Hermjakob and N. Sharon, Biochim. Biophys. Acta, 1999, 1473, 4–8 CrossRef CAS.
- K. Ohtsubo and J. D. Marth, Cell, 2006, 126, 855–867 CrossRef CAS PubMed.
- A. Cazet, S. Julien, M. Bobowski, M.-A. Krzewinski-Recchi, A. Harduin-Lepers, S. Groux-Degroote and P. Delannoy, Carbohydr. Res., 2010, 345, 1377–1383 CrossRef CAS PubMed.
- S. Rachagani, M. P. Torres, N. Moniaux and S. K. Batra, Biofactors, 2009, 35, 509–527 CrossRef CAS PubMed.
- D. H. Dube and C. R. Bertozzi, Nat. Rev. Drug Discovery, 2005, 4, 477–488 CrossRef CAS PubMed.
- J.-T. Cao, Z.-X. Chen, X.-Y. Hao, P.-H. Zhang and J.-J. Zhu, Anal. Chem., 2012, 84, 10097–10104 CrossRef CAS PubMed.
| This journal is © The Royal Society of Chemistry 2016 |


