 Open Access Article
Method development and validation for the determination of selected endocrine disrupting compounds by liquid chromatography mass spectrometry and isotope pattern deconvolution in water samples. Comparison of two extraction techniques†
Neus
Fabregat-Cabello
,
Jorge
Pitarch-Motellón
,
Juan V.
Sancho
,
María
Ibáñez
and
Antoni Francesc
Roig-Navarro
*
Research Institute for Pesticides and Water, Universitat Jaume I, E-12071, Castelló, Spain. E-mail: roig@uji.es; Fax: +34 964 387 368; Tel: +34 964 387 359
First published on 4th March 2016
Abstract
In the present work two different extraction methodologies have been developed and validated for the determination of t-octylphenol and a technical mixture of nonylphenol (both, priority substances of EU water policy) and bisphenol A (BPA) in water samples. BPA was quantified by isotope dilution mass spectrometry and isotope pattern deconvolution for the first time taking advantage of 13C-isotopic analogues as internal standards, together with the previously studied alkylphenols. After preconcentration of the selected compounds, the samples were analyzed by ultra high pressure liquid chromatography and tandem mass spectrometry. For this purpose two extraction methodologies were proposed and compared: a routine extraction methodology based on solid-phase extraction (SPE), and a non-conventional technique based on hollow fiber liquid phase microextraction (HF-LPME). The sought methodologies were satisfactorily validated for the analysis of drinking water, surface water and effluent wastewater at two concentration levels, 0.1 and 1 μg L−1 for the alkylphenols and at 0.5 and 5 μg L−1 for BPA. Recoveries within 89–113% and 91–113% were obtained for HF-LPME and SPE respectively, with acceptable coefficients of variation in all cases according to SANCO guidelines. In addition, the use of isotope pattern deconvolution calculations provided the concentration of each analyte without the use of a calibration curve. Finally, a comparison of both methodologies is included, showing that while HF-LPME requires a shorter sample preparation time and the overall cost is lower, SPE extraction and manipulation is highlighted as being user friendly.
Introduction
Endocrine disrupting compounds (EDCs) are a group of exogenous organic compounds that are able to interfere with the normal function of the endocrine system. Some of these compounds are included in the main international aquatic regulations.1,2 The allowed concentrations of nonylphenol (NP) and t-octylphenol (OP) in inland waters according to EU Environmental Quality Standards (EQS)1 are 0.3 and 0.1 ng mL−1, respectively. However, to date, there is no regulatory status for most suspected EDCs. This is a consequence of the limited understanding of their effect on the environment and on human health, for example in the case of bisphenol A (BPA). To gain full scientific knowledge of the impact of EDCs on humans and on wildlife, the occurrence, transport, and fate of these compounds should be known.3 The analytical methodology required will involve the determination of very low concentrations of analytes in matrices of great complexity. Thus, developing reliable methods for the quantification of EDCs is still a challenge.Nowadays there is an increasing concern about the release of EDCs into the environment. One of the main sources of this contamination are plastic materials which are characterized by their widespread use and disposal. Plastics are supposed to be inert materials that cannot interact with cells due to their large molecular size. Nevertheless, they are able to adsorb, transport and also release, when degraded or leached, smaller molecular compounds.4 As a consequence, phenol derivates are released during all phases of the water cycle,5 including those of increasing concern such as BPA, OP and NP. These compounds can eventually reach the trophic chain and disrupt the endocrine system of higher consumers.
BPA is one of the highest volume chemicals in commerce, mainly used during the synthesis of polycarbonate plastics and epoxy resins. It is also used as an additive in other types of plastic, such as PVC. BPA is a small estrogenic monomer whose capacity to mimic various hormones is widely known.6 Alkylphenols are mainly employed for producing alkylphenol ethoxylates, a surfactant additive widely employed in the manufacture of a variety of detergents and plastic products. Nowadays, over 80% of the global production of alkylphenols corresponds to NP mixtures while the other 20% corresponds to the monomeric compound OP. NPs enter the aquatic environment primarily via the effluents of industrial and municipal wastewater-treatment plants, but also by direct discharge such as through pesticide application.7 Phenolic compounds have been found to contain weak estrogenic activity at μg L−1 concentration levels. Recent studies have demonstrated that branched alkyl phenols with 8–9 carbon chain lengths had the greatest estrogenic effects.8
When analyzing EDCs at ultratrace levels in water samples, a preconcentration step is mandatory. For this reason, a wide variety of preparation techniques have been applied for the extraction and enrichment of the target compounds.5,8–10 Nowadays, conventional procedures such as liquid–liquid extraction (LLE) or solid-phase extraction (SPE) are still the most common in routine laboratories.10 Nevertheless, the main current extraction trends involve miniaturization, automatization and green-chemistry related approaches. Reducing the time and cost of classical SPE can be achieved by the introduction of automation and miniaturization techniques11 while new extraction methodologies, which avoid the use of large solvent volumes and reduce the sample treatment, are being constantly developed. The most common microextraction methodologies are stir bar sorptive extraction (SBSE),12 and solid-phase microextraction (SPME) using classical PDMS fibers or the recently proposed polyethersulfone (PES) SPME tubes, which increases the extraction rate compared with previous materials.13 In addition, other relatively new extraction procedures have been applied for the determination of EDCs, including thin-film microextraction (TFME),14 hollow fiber liquid phase microextraction (HF-LPME)15 and membrane assisted solvent extraction (MASE).9
The determination of EDCs has been described using either high (or ultra high)-performance liquid chromatography (HPLC) and gas chromatography (GC)-based methods, mostly combined with mass spectrometry (MS) detectors. At present, the use of GC has been replaced by LC methods to separate EDCs, due to the rather hydrophilic character of most of them. Another advantage is that LC based methods avoid the need to perform any derivatization steps. Moreover, ultra high performance liquid chromatography (UHPLC) with tandem mass spectrometry (MS/MS) is normally preferred since it provides faster separations and is also able to achieve the sensitivity and selectivity required.16 Nevertheless, the great majority of miniaturized extraction techniques are still combined with GC separations. There are only a few exceptions where microextraction techniques are combined with LC-MS, these include the use of ionic liquid dispersive liquid-phase microextraction (DLLME)17 and, to a lesser extent, HF-LPME.18
Otherwise, it has to be pointed out that the main drawback of the hyphenated technique LC-MS is its interface, normally an electrospray ionization source (ESI), which tends to suffer from matrix effects19,20 leading to inaccurate quantifications. Matrix effects can be compensated for by means of different approaches. The most accurate way to deal with these effects during signal acquisition is by the addition of their corresponding isotopically labeled internal standard (IL-IS), as they present the same ionization behavior as analytes.21 When selecting an IL-IS, 13C or 15N labelling is preferred over deuterium labelling since chromatographic isotopic effects are common in the latter case.20
A very high number of papers have been published about the determination of EDCs. However, data comparability for these compounds is difficult. In a recent interlaboratory comparison22 the need for robust, standardized methods to improve data quality was emphasized. This conclusion is based on the high degree of variability between methods and the high number of outliers observed, specifically for BPA, NP and OP, which are regarded as especially difficult to measure accurately.
The aim of the present study was to develop a rapid, green chemistry related method for the extraction of NP, OP and BPA in water samples by means of HF-LPME and their reliable quantification, at regulated levels when available, by UHPLC-MS/MS. Also, a standard SPE was optimized for validation and comparison purposes. In addition, a quantification method based on IDMS was developed, using the corresponding isotopically 13C-labeled analogues of each target analyte, thus correcting the matrix effect. In order to reduce the total analysis time the quantification was carried out by using isotope pattern deconvolution (IPD), which avoids the use of calibration curves. Prior to method development, a thorough study of all of the contamination sources was performed.
Experimental
Reagents and materials
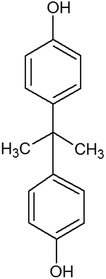
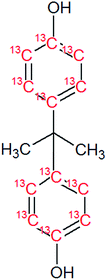
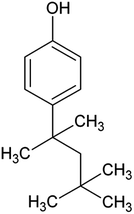
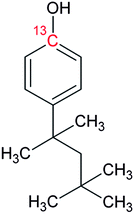
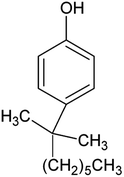
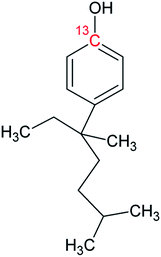
Bisphenol A (BPA, purity 98.5%) was provided by Dr. Ehrenstorfer (Augsburg, Germany), 4-tert-octylphenol (OP, purity 99.0%) by Supelco (Bellefonte, PA, USA) and technical nonylphenol (NP, Pestanal, purity 95.4%) from Riedel de Haen (Seelze, Germany). In-house synthesized 13C1-4-(3,6-dimethyl-3-heptyl)phenol (13C1-NP) (purity 99% and 13C1-enrichement 98%) and 13C1-4-tert-octylphenol (13C1-OP) (purity 99% and 13C1-enrichement 99%) were also employed.18,2313C12-bisphenol A (purity 98% and 13C12-enrichement 99%) was purchased from Cambridge Isotope Laboratories (Andover, MA, USA). Table 1 shows the molecular formulae of the selected compounds.![[thin space (1/6-em)]](https://www.rsc.org/images/entities/char_2009.gif) Kow
Kow
Methanol, acetone, and acetonitrile (minimum HPLC quality) were provided by Scharlau (Barcelona, Spain). For the extraction, 1-octanol (reagent grade, 99%) was obtained from Sigma-Aldrich Co. (Madrid, Spain). The pH of the mobile phase was adjusted by adding ammonium hydroxide from Fluka (Buchs, Switzerland). Bottled drinking water stored in polyethylene terephthalate (PET) flasks was also employed for validation purposes.
Individual stock solutions of alkylphenols and BPA were prepared by dissolving 50 mg of each, accurately weighed, in 50 mL of methanol. Since 13C12-BPA was purchased as a 1.2 mL solution of 100 mg L−1 in acetonitrile, the stock solution was prepared by dilution to 25 mL with methanol. This provided a concentration by reverse isotope dilution against the natural composition compound of 6.18 mg L−1. The same procedure was applied to calculate the exact concentrations of labeled stocks solutions, obtaining 15.41 mg L−1 of 13C1-NP and 10.04 mg L−1 of 13C1-OP.
An intermediate mixed solution of OP, NP and BPA with corresponding concentrations of 0.2, 0.2 and 1 mg L−1 was prepared after mixing the individual stock solutions and dilution with methanol. Similarly, a labeled mix solution of the 13C compounds was prepared at the same concentration level. For validation purposes, a lower concentration solution was prepared by a ten-fold dilution with methanol. All of the standard solutions were stored in amber glass bottles at −20 °C in a freezer.
The Accurel® Q3/2 polypropylene (PP) hollow fibers (600 μm i.d., 200 μm wall thickness and 0.2 μm pore size) were obtained from Membrana (Wuppertal, Germany). The cartridges used for SPE were C18 glass SPE tube ENVI-18 (500 mg/6 mL) obtained from Supelco (Bellefonte, PA, USA), as were the PTFE SPE Tube Adapter (with female luer port), 30 mL glass syringes and the load reservoirs.
The water purification system used was a Milli-Q gradient A10 with an EDS-Pak polisher (Millipore, Bedford, MA, USA). The EDS filter enables the removal of endocrine disruptors from ultrapure water. Certified polypropylene bonded caps with PTFE/red rubber septa from Supelco (Bellefonte, PA, USA) were employed for the LC vials.
Instrumentation
An Acquity UPLC system (Waters Corp., Milford, MA, USA) coupled to a TQD (triple quadrupole) mass spectrometer was employed for sample analysis. Chromatographic separation was performed with an Acquity UPLC HSS T3 column 1.8 μm, 2.1 mm × 100 mm (i.d.) (Waters) at a flow rate of 0.3 mL min−1 and an injection volume of 20 μL. The column was kept at 40 °C and the sample manager was maintained at 5 °C. The separation was performed under isocratic conditions with a mobile phase consisting of 97% methanol–water with 0.01% ammonia. The mobile phase was prepared in a volumetric flask by adding 3 mL of methanol, then the ammonia solution and finally water to a final volume of 100 mL. Due to the expected volatility losses of NH3 dissolved in methanol the mobile phase was prepared daily.Analysis was performed according to the following parameters: capillary voltage 3.30 kV, source and desolvation temperatures at 120 and 350 °C, cone gas and desolvation flow were set at 80 and 800 L h−1. The mass spectrometer was operated with electrospray ionization in the negative ion mode with selected reaction monitoring (SRM). MS/MS experimental conditions for the selected compounds are shown in Table 2. The drying as well as the nebulizing gas was nitrogen, obtained from a nitrogen generator N2 LC-MS adapted for LC-MS analyzers (Claind, Teknokroma, Barcelona, Spain). For operation in the MS/MS mode, the collision gas was argon 99.995% (Praxair, Madrid, Spain) at a pressure of approximately 4 × 10⁻³ mbar in the collision cell. Dwell times of 0.1 s per scan were chosen. MassLynx v4.1 (Waters) software as well as homemade Excel spreadsheets were used to process the quantitative data obtained. Replicated determination (n = 5) of abundances under these conditions provided good precision for the selected transitions with values of RSD always below 4%.
| Compound | Ret. time (min) | Precursor ion | Cone voltage (V) | SRM transitions for ion-ratioa native compound | SRM transitionsa isotopic label | SRM transitionsa IPD |
|---|---|---|---|---|---|---|
| a Information in brackets: collision energy (eV). Quantifier transition in bold. IPD: Isotope Pattern Deconvolution. | ||||||
| Bisphenol A (BPA) | 0.85 | [M − H]− | 30 | 227.2 > 212.1 (15) | 239.2 > 224.1 (15) | 227.2 > 212.1 (15) |
| 227.2 > 133.0 (20) | 13C12-BPA | 228.2 > 213.1 (15) | ||||
| 239.2 > 224.1 (15) | ||||||
| Octylphenol (OP) | 1.15 | [M − H]− | 30 | 205.2 > 133.0 (25) | 206.2 > 134.0 (25) | 205.2 > 133.0 (25) |
| 205.2 > 117.1 (45) | 13C1-OP | 206.2 > 134.0 (25) | ||||
| 207.2 > 135.0 (25) | ||||||
| Nonylphenol (NP) | 1.27 | [M − H]− | 30 | 219.2 > 133.0 (25) | 220.2 > 134.0 (25) | 219.2 > 133.0 (25) |
| 219.2 > 147.1 (25) | 13C1-NP | 220.2 > 134.0 (25) | ||||
| 221.2 > 135.0 (25) | ||||||
Preparation of water samples
Environmental samples with observable suspended particulate matter were decanted by pouring the water after sedimentation slowly from the sample bottles into clean 1 L glass (Schott-Duran) bottles.24 Then, 0.5 mL of the labeled mixture solution was added to a 100 mL volumetric flask, where the water sample was used to fill it and to adjust the final volume. This resulted in a final concentration of 0.1 μg L−1 except for 13C12-BPA which was 0.5 μg L−1. Accurate, and precise results can be obtained when the ratio of concentrations between the natural and labeled compound is in the range of 0.1 to 10, according to the random error propagation theory.25Recommended hollow fiber liquid phase microextraction and solid-phase extraction procedures
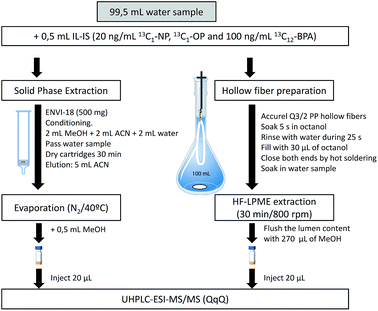
HF-LPME can be applied in a two or three-phase system. A two-phase system was chosen in the present work due to the higher enrichment factors and its easier handling.18,26 Fibers were cut into 13 cm long pieces, cleaned by means of sonication (15 min in methanol followed by 15 min in acetone), and filled with the acceptor phase, 1-octanol (Fig. 1), using a 100 μL HPLC microsyringe model 701N (outer diameter 0.72 mm) from Hamilton (Bonaduz, Switzerland). After extraction, the acceptor was transferred into an HPLC vial using an HPLC gastight syringe model 1001 (outer diameter 0.72 mm) from Hamilton (Reno, Nevada, USA). The samples in the vials were vortex homogenized.SPE was performed using glass cartridges (Fig. 1). After conditioning, 100 mL of sample were introduced by gravity using a PTFE adapter and a 30 mL reservoir.
Cleaning procedure
The ubiquitous presence of the selected compounds in all the laboratory material, included solvents, is probably the main challenge during the determination of EDCs at very low concentration levels. For this reason, and according to our previous experience,18,23 all of the glass material was rinsed with acetone, methanol and hexane. Compared with previous work, rinsing with hexane was also added to the cleaning procedure due to some contamination observed after rinsing only with the other two solvents.In the case of hollow fibers and magnetic stirrers, both were rinsed with acetone and sonicated for 15 min in methanol and 15 min in acetone before use. The HPLC syringes were rinsed twice with acetone and twice with methanol between samples. Due to their low cost, the fibers were discarded after being used to decrease the memory effect and cross-contamination.
Determination of EDC by isotope pattern deconvolutionm
The isotope dilution calculation methodology applied in this work is based on the combination of multiple linear regression and the use of labeled 13C-analogues of each analyte. Spiking samples with labeled analogues alters the natural isotopic composition of the analyte in the mixture. Once isotopic equilibrium is reached possible sample losses, do not alter the analysis result. Briefly, this approach assumes that the final isotopic composition observed in the mixture, ASRMimix, is a combination of the contribution of the abundances of the analyte, ASRMinat, and those of the isotopically enriched spike, ASRMilab.27–29 This can be better described in matrix notation as can be observed in eqn (1). | (1) |
As can be seen in eqn (1), an error vector, eSRMi, needs to be included in order to resolve the system of equations through multiple linear regression. The solutions to eqn (1) correspond to the molar fractions of natural and labeled compounds in the mixture, Xnat and Xlab. These can be obtained by using conventional spreadsheet software (e.g. LINEST function of Microsoft Excel). Finally, the amount of natural abundance compound, Nnat, can be directly calculated using eqn (2) since the added amount of labeled standard, Nlab, is known.
 | (2) |
Consequently, quantification of the EDCs does not require the use of a methodological calibration curve. It must be pointed out that the theoretical mass isotopomer distribution coming from each precursor ion has to be obtained and compared with those obtained experimentally. This is easily calculated by using the software Isopatrn implemented by L. Ramaley and L. Cubero-Herrera.30 This IPD methodology has been described thoroughly in previous works for both NP23 and OP.18
Finally, confirmation of the presence of the selected compounds was carried out by calculating the peak area ratios between the qualifier (q), and the quantifier transition (Q) and comparing them with ion-ratios from a reference standard (see Fig. 2).
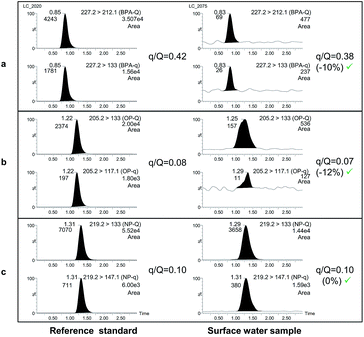 | ||
| Fig. 2 UHPLC-MS/MS chromatograms of BPA (a), OP (b) and NP (c) for reference standards (left) and for a positive surface water sample by HF-LPME. | ||
Method validation
Method validation was carried out by using different spiked water samples. Accuracy by means of recovery calculation and intra-day precision through the relative standard deviation (RSD) of the method were assessed. 0.1 ng mL−1, the EU Environmental Quality Standard (EQS)1 for OP in inland waters, was used as the lowest validation level for OP and NP. Samples were spiked at two concentration levels: 0.1 and 1 μg L−1 for alkylphenols and 0.5 and 5 μg L−1 for BPA. Since it was not possible to obtain a true blank sample, bottled water, effluent wastewater and surface water were previously analyzed and the concentrations of the analytes found were subtracted from the spiked samples. As a consequence, higher errors in the recovery calculation were obtained. Additionally, LOD and LOQ were assessed as 3xSD and 10xSD, respectively, in non-spiked water samples whose concentration was near the LOD. All of the measurements were conducted in quadruplicate.Results and discussion
Optimization of the chromatographic conditions
The proposed LC method was optimized to provide a simple and fast separation of BPA, OP and NP. In a first approach, gradient conditions using C18 columns were tested, as they are known to provide better peak shapes and increasing retention for the less polar compounds. On the basis of the gradient conditions used by Jing et al.,31 different combinations of methanol–water were studied. Bearing in mind the high levels of EDCs usually contained in Milli-Q grade water,32,33 it was passed through an extra purification system, an EDS polisher. Nevertheless, even using treated Milli-Q water, nonylphenol was accumulated during gradient injection cycles. As a consequence, gradient conditions were finally discarded.Therefore, isocratic conditions were also tested. Based on our previous work18,23 different percentages of methanol–water combinations, with and without ammonia and ammonium acetate as modifiers, were evaluated. The best sensitivity was reached with a mobile phase consisting of 97% methanol–water with 0.01% ammonia since the presence of NH4Ac negatively affected the signal of BPA. It must be highlighted that the chromatographic run was reduced to only 2 min, which considerably decreases the analysis time compared with previous developed methodologies.5,13,34 Finally, and as stated before, these conditions avoid the problems of lack of precision and inaccuracy between injections compared with previously developed methodologies using gradient separation.13 A chromatogram obtained under these conditions can be seen in Fig. 2.
Measurement of the isotopic composition of 13C12-BPA by LC-MS/MS
As stated above, the correct quantification via IPD equations requires the accurate knowledge of the relative abundances of both the natural and isotopically labeled compounds. For this reason, abundances were experimentally measured for each analyte (both natural and labeled) by preparing individual 500 μg L−1 standards in methanol and injecting each five times with the appropriate SRM transitions, obtained with the software Isopatrn.In LC-MS/MS, the occurrence of different fragmentation mechanisms may occur simultaneously in the collision cell, and fragment ions containing different number of hydrogen atoms can overlap in the mass spectrum.35,36 As a consequence, the purity of the selected cluster must be evaluated, following the procedure described in previous work.18,23 It was observed that the major contribution for selected compounds corresponded to clusters [M − H] and [M − 2H]. The values obtained for NP were a contribution of 96.0 ± 0.3 for [M − H − C6H14]− and 4.0 ± 0.3% for [M − H − C6H15]− while for OP of 98.10 ± 0.13 for [M − H − C5H12]− and 1.9 ± 0.13% for [M − H − C5H13]−. In the case of BPA, the observed contributions were 88.2 ± 0.3 for [M − H − CH3]− and 11.8 ± 0.3% for [M − H − CH4]−. These contributions were included in the matrix of abundances used for IPD calculations.
Concentration and extent of 13C-enrichment of the 13C12-BPA standard
In order to apply IPD calculations, it is mandatory to know the exact amount of each labeled compound added to the sample. For this reason, the concentration of 13C12-BPA was calculated against its corresponding reference natural analogue. Under these circumstances, we obtained a concentration of 6.18 ± 0.09 mg L−1. The isotopic enrichment of 13C was found to be 99.0% which was calculated according to a method described elsewhere23 and matched with the nominal enrichment provided by the manufacturer.Optimization of the HF-LPME experimental parameters
The efficiency of the current procedure was examined by studying the extraction solvent and time, with the stirring speed set at 800 rpm. This agitation rate was selected since it was the highest value that did not result in a vortex in the sample solution. Other parameters, including the extraction pH and the amount of sodium chloride added to the sample solution were not evaluated since they normally have a low or negative influence.18,37The acceptor solvent was selected by assessing the extraction of the target compounds from water samples over 30 min with octanol, diethyl ether and toluene. Octanol was preferred due to the high partition coefficient of water–octanol for the selected compounds (see Table 1). For each solvent, a triplicate of 100 mL of Milli-Q water fortified with the three compounds at a concentration level of 5 μg L−1 plus a blank sample were evaluated. Negligible recoveries were obtained for both diethyl ether and toluene. Thus, octanol was chosen as the acceptor phase. This solvent has the advantage of being compatible with the chromatographic conditions when diluted in methanol, thereby simplifying the sample treatment procedure.
Finally, the influence of extraction time was also tested. For this study, water samples were extracted under the optimized conditions for 15, 30 and 45 min. It was observed that 30 min provided the highest enrichment (preconcentration) factors for the three compounds in the octanol extracts: around 300 for BPA, 500 for OP and 400 for NP.15
Optimization of the SPE experimental parameters
Considering the results reported in previous publications10,23 as well as possible contamination, C18 glass tube cartridges were selected due to their ability to retain non-polar compounds. The optimization was performed by evaluating four different elution solvents (methanol, acetonitrile, acetone and hexane) and collecting two consecutive fractions of 5 mL for each solvent. Then, each fraction was evaporated under a gentle stream of N2 and finally reconstituted in 0.5 mL of methanol. The best results were obtained using 5 mL of acetonitrile as the elution solvent, which provided absolute recoveries of 78%, 68% and 59% for BPA, OP and NP, respectively.Performance of the analytical methods: SPE vs. HF-LPME
Once the SPE procedure and the HF-LPME parameters were optimized, the method validation was carried out. As no certified reference material was available for the target compounds, different spiked water samples were used to assess the accuracy by means of recovery calculation, and intra-day precision through the relative standard deviation (RSD) of the method. Three types of water samples were evaluated, bottled water, surface water and effluent wastewater. The annual average EQS for inland waters for OP1 was chosen as the lowest concentration level to be validated for alkylphenols together with a 10-fold higher value. Thus, two concentration levels, 0.1 and 1 μg L−1 for alkylphenols and 0.5 and 5 μg L−1 for BPA were selected. Compared to OP and NP, the BPA levels were increased due to the high RSD obtained for HF-LPME in the preliminary experiments. For each combination of matrix-validation level, four independent replicates were analyzed within a day and injected in duplicate.As an example of the method performance Fig. 2 illustrates the detection and confirmation of the selected compounds in a surface water sample. As stated previously, since no sample blank was found for any of the studied matrices, water samples of each matrix spiked only with the isotope labeled mixture were also processed to subtract the endogenous amount (blank value) of the target compounds. The subtraction of the blank values from fortified samples resulted in a higher lack of precision in the recovery calculation. As can be observed in Table 3, this mostly affected the lowest validated level, especially for NP as higher blank levels were found.
| Compound | Validation level (μg L−1) | Bottled water | Effluent wastewater | Surface water | |||
|---|---|---|---|---|---|---|---|
| HF-LPME | SPE | HF-LPME | SPE | HF-LPME | SPE | ||
| Bisphenol A (BPA) | 0.5 | 104 (13) | 93 (3) | 102 (13) | 93 (9) | 104 (7) | 96 (3) |
| 5 | 98 (8) | 94 (1.3) | 100 (8) | 102 (2.3) | 99 (11) | 107 (3) | |
| Octylphenol (OP) | 0.1 | 105 (10) | 105 (7) | 100 (11) | 104 (8) | 96 (16) | 109 (6) |
| 1 | 100 (1.3) | 102 (1.4) | 99 (1.5) | 100 (3) | 102 (4) | 97 (4) | |
| Nonylphenol (NP) | 0.1 | 109 (16) | 97 (17) | 89 (16) | 113 (12) | 94 (16) | 91 (17) |
| 1 | 108 (2.2) | 103 (8) | 113 (8) | 103 (8) | 111 (8) | 102 (8) | |
The results obtained were satisfactory for BPA, OP and NP in all of the water samples, with recoveries of between 89% and 113% for HF-LPME, and between 91% and 113% for SPE. RSDs were below 16% for HF-LPME while SPE presented a maximum of 17% (Table 3). These values are in agreement with the SANCO guideline SANCO/12571/2013 (ref. 38) which proposes RSDs ≤ 20% and recoveries of between 70% and 120%. In both cases, the highest RSDs corresponded to NP at the lowest validated level, which is probably caused by the highest error due to the subtraction of the endogenous concentration in samples. Consequently, the extraction methodologies developed were satisfactorily validated for all of the matrices.
The limit of detection (LOD) and limit of quantification (LOQ) were estimated as 3 x SDbl and 10 x SDbl, respectively. SDbl is the standard deviation (n = 4) of a non-spiked sample, for each matrix, whose concentration is near the LOD. The obtained values are presented in Table 4 together with the concentrations obtained for the three selected samples. As stated before, the maximum levels of BPA in water have not been established in any legislation. For the measurements, the labeled compounds, 13C12-BPA, 13C1-OP, 13C1-NP, were added at the same concentration level as the added natural compounds. Both the single labeled and the uniformly labeled internal standards coeluted with their natural analogues (see Fig. A1 in ESI†), thus no chromatographic isotopic effects were observed, making it possible for them to correct for any possible matrix effects.19,20
| Sample | Compound | Limit of detection (ng L−1) | Limit of quantification (ng L−1) | Non-spiked concentration ± 1 SDa (ng L−1) |
|---|---|---|---|---|
| a Concentration and SD values correspond to one replicate injected twice. b Concentration values lower than LOQ but above the LOD. | ||||
| Bottled water | BPA | 7 | 24 | 25.9 ± 2.2 |
| OP | 5 | 15 | 18.5 ± 1.9 | |
| NP | 5 | 18 | 177 ± 3 | |
| Effluent wastewater | BPA | 6 | 20 | <LOQb |
| OP | 7 | 25 | 33.2 ± 0.3 | |
| NP | 19 | 63 | 148 ± 4 | |
| Surface water | BPA | 7 | 22 | <LOQb |
| OP | 6 | 20 | 32.4 ± 1.7 | |
| NP | 6 | 20 | 178 ± 10 | |
The analytical characteristics of both of the extraction techniques in terms of time, cost, total volume consumption and handling were also compared.
On the one hand, the selected miniaturized extraction, HF-LPME, has two main advantages: the low cost of each extraction fiber (approximately 0.03 euro) and the very low solvent consumption (300 μL) which is in line with green chemistry tendencies. In addition, this method allows an average of 9 extractions in 2 hours (with the magnetic stirring set of 9 plates used in the present work). Thus, around 13 minutes are needed per sample extracted.
Alternatively, the SPE technique, in the off-line version used in this work (12 position), is a very simple, transferable and accurate extraction methodology which has been widely tested. This approach can be much easier to apply. The disadvantages of this methodology are the high price per SPE glass cartridge (around 7 euros each), the higher volume consumption (9.5 mL of organic solvent per sample) and the longer sample treatment time. It is a tedious extraction and permits, approximately, a maximum of 20 extracted samples per 8 h-working day, resulting in an average extraction time of 24 minutes per sample. It has to be pointed out that if only 10 samples are extracted, the total time per sample will be increased, making it a laborious procedure.
Confirmation of the possible findings was carried out by calculating the peak area ratios between the confirmation transition (underneath the quantifier transition in Table 2) and the quantifier (in bold in the same table) and by comparing them with the ion-ratio calculated from a reference standard (Fig. 2). Maximum deviations accepted in q/Q ratios (30%) were based on guideline SANCO/12571/2013.38
Finally, all of the SRM transitions, employed for IPD calculations as well as the confirmation transitions for BPA, OP and NP, could be acquired simultaneously at this low level for all of the analytes. This makes it possible to quantify and confirm the selected analytes with a high level of confidence in a single injection.
Conclusions
In this work, an HF-LPME method for UHPLC-MS/MS has been demonstrated to be quick and reliable. It is suitable for the simultaneous determination of BPA, OP and NP with high sensitivity, high enrichment factors and good sample clean-up ability in complex matrices. No derivatization step is required and analytes can be separated in a 2 minute run. The proposed extraction procedure is performed in only 30 min, which is a great advantage compared with other microextraction techniques which normally require longer extraction times (e.g. SBSE or SPME). Moreover, the very low solvent consumption, 300 μL only, is in line with current green chemistry tendencies.Regarding separation, isocratic conditions with a mobile phase consisting of 97% methanol–water with 0.01% ammonia provided the best sensitivity. The chromatographic run was reduced to only 2 min, and problems related to NP contamination compared with other developed methodologies using gradient conditions were avoided.
IPD calculations have been proven to be reliable and also fast, providing one result per sample injection. Multiple linear regression has the advantage that methodological calibration curves are no longer needed, thus reducing the total analysis time. Quantification methodology, based on IDMS through 13C-labeled compounds, effectively compensate for any possible matrix effects while avoiding problems related to isotopic effects.
Comparable results in terms of precision and accuracy have been observed for both of the extraction methodologies tested, classical SPE and HF-LPME. Extraction using disposable hollow-fibers with octanol as the acceptor phase has been proven to be faster and cheaper. However, preparation of the fibers and withdrawal of the acceptor phase can be complicated. Finally, although more lengthy, the SPE method is highlighted for its ease of use.
Acknowledgements
The authors acknowledge financial support from the Generalitat Valenciana (Research group of excellence Prometeo 2009/054 and Collaborative Research on Environment and Food Safety ISIC/2012/016), as well as University Jaume I for project PB1-1B2013-55. N. Fabregat-Cabello also acknowledges the Generalitat Valenciana for her Ph.D. research grant under the Program VALi+D. Finally the authors are grateful to the Serveis Centrals d'Instrumentació Científica (SCIC) of University Jaume I for using Acquity and TQD instruments.Notes and references
- Directive 2013/39/EU of the European Parliament and of the Council of 12 August 2013 amending Directives 2000/60/EC and 2008/105/EC as regards priority substances in the field of water policy, 2013.
- U.S. Environmental Protection Agency (EPA) National Recommended Water Quality Criteria, http://water.epa.gov/scitech/swguidance/standards/criteria/current/index.cfm, accessed April 2015.
- Z. Sosa-Ferrera, C. Mahugo-Fantana and J. J. Santana-Rodríguez, BioMed Res. Int., 2013, 2013, 1–23 CrossRef PubMed.
- E. L. Teuten, J. M. Saquing, D. R. U. Knappe, M. A. Barlaz, S. Jonsson, A. Björn, S. J. Rowland, R. C. Thompson, T. S. Galloway, R. Yamashita, D. Ochi, Y. Watanuki, C. Moore, P. H. Viet, T. S. Tana, M. Prudente, R. Boonyatumanond, M. P. Zakaria, K. Akkhavong, Y. Ogata, H. Hirai, S. Iwasa, K. Mizukawa, Y. Hagino, A. Imamura, M. Saha and H. Takadal, Philos. Trans. R. Soc. London, 2009, 364, 2027–2045 CrossRef CAS PubMed.
- H. W. Chen, C. H. Liang, Z. M. Wu, E. E. Chang, T. F. Lin, P. C. Chiang and G. S. Wang, Sci. Total Environ., 2013, 449, 20–28 CrossRef CAS PubMed.
- W. V. Welshons, S. C. Nagel and F. S. vom Saal, Endocrinology, 2006, 147, 56–69 CrossRef PubMed.
- R. Loos, J. Wollgast, J. Castro-Jiménez, G. Mariani, T. Huber, G. Locoro, G. Hanke, G. Umlauf, G. Bidoglio, P. Hohenblum, W. Moche, S. Weiss, H. Schmid, F. Leiendecker, T. Ternes, A. Navarro Ortega, A. Hildebrandt, D. Barceló, P. Lepom, I. Dimitrova, O. Nitcheva, S. Polesello, S. Valsecchi, S. Boutrup, O. Sortkjaer, R. de Boer and J. Staeb, Trends Anal. Chem., 2008, 27, 89–95 CrossRef CAS.
- A. D. LaFleur and K. A. Schug, Anal. Chim. Acta, 2011, 696, 6–26 CrossRef CAS PubMed.
- A. Iparraguirre, P. Navarro, R. Rodil, A. Prieto, M. Olivares, N. Etxebarria and O. Zuloaga, J. Chromatogr. A, 2014, 1356, 163–170 CrossRef CAS PubMed.
- H. G. Mol, S. Sunarto and O. M. Steijger, J. Chromatogr. A, 2000, 879, 97–112 CrossRef CAS PubMed.
- B. Buszewski and M. Szultka, Crit. Rev. Anal. Chem., 2012, 42, 198–213 CrossRef CAS.
- S. Nakamura and S. Daishima, J. Chromatogr. A, 2004, 1038, 291–294 CrossRef CAS PubMed.
- O. Ros, A. Vallejo, L. Blanco-Zubiaguirre, M. Olivares, A. Delgado, N. Etxebarria and A. Prieto, Talanta, 2015, 134, 247–255 CrossRef CAS PubMed.
- M. Sun, Q. Wu, C. Wang and Z. Wang, Anal. Methods, 2014, 6, 6316–6321 RSC.
- C. Basheer and H. K. Lee, J. Chromatogr. A, 2004, 1057, 163–169 CrossRef CAS PubMed.
- K. Wille, H. F. De Brabander, L. Vanhaecke, E. De Wulf, P. Van Caeter and C. R. Janssen, Trends Anal. Chem., 2012, 35, 87–108 CrossRef CAS.
- N. Salgueiro-González, E. Concha-Graña, I. Turnes-Carou, S. Muniategui-Lorenzo, P. López-Mahía and D. Prada-Rodríguez, J. Chromatogr. A, 2012, 1223, 1–8 CrossRef PubMed.
- N. Fabregat-Cabello, J. V Sancho, A. Vidal, F. V González and A. F. Roig-Navarro, J. Chromatogr. A, 2014, 1328, 43–51 CrossRef CAS PubMed.
- A. Furey, M. Moriarty, V. Bane, B. Kinsella and M. Lehane, Talanta, 2013, 115, 104–122 CrossRef CAS PubMed.
- H. Trufelli, P. Palma, G. Famiglini and A. Cappiello, Mass Spectrom. Rev., 2011, 30, 491–509 CrossRef CAS PubMed.
- P. Rodríguez-González, J. M. Marchante-Gayón, J. I. García Alonso and A. Sanz-Medel, Spectrochim. Acta, Part A, 2005, 60, 151–207 CrossRef.
- B. J. Vanderford, J. E. Drewes, A. Eaton, Y. C. Guo, A. Haghani, C. Hoppe-Jones, M. P. Schluesener, S. A. Snyder, T. Ternes and C. J. Wood, Anal. Chem., 2014, 86, 774–782 CrossRef CAS PubMed.
- N. Fabregat-Cabello, Á. Castillo, J. V. Sancho, F. V. González and A. F. Roig-Navarro, J. Chromatogr. A, 2013, 1301, 19–26 CrossRef CAS PubMed.
- R. Loos, G. Locoro and S. Contini, Water Res., 2010, 44, 2325–2335 CrossRef CAS PubMed.
- J. I. García Alonso, Anal. Chim. Acta, 1995, 312, 57–78 CrossRef.
- M. A. Bello-Lopez, M. Ramos-Payan, J. A. Ocaña-González, R. Fernández-Torres and M. Callejón-Monchón, Anal. Lett., 2012, 45, 804–830 CrossRef CAS.
- A. González-Antuña, P. Rodríguez-González, G. Centineo and J. I. García Alonso, Analyst, 2010, 135, 953–964 RSC.
- J. Meija, L. Yang, J. a. Caruso and Z. Mester, J. Anal. At. Spectrom., 2006, 21, 1294–1297 RSC.
- P. Rodríguez-González and J. I. García Alonso, J. Anal. At. Spectrom., 2010, 25, 239–259 RSC.
- L. Ramaley and L. Cubero Herrera, Rapid Commun. Mass Spectrom., 2008, 22, 2707–2714 CrossRef CAS PubMed.
- X. Jing, S. Bing, W. U. Xiaoyan, S. U. N. Xiaojie and W. U. Yongning, Biomed. Environ. Sci., 2011, 24, 40–46 Search PubMed.
- M.-H. Dévier, K. Le Menach, L. Viglino, L. Di Gioia, P. Lachassagne and H. Budzinski, Sci. Total Environ., 2013, 443, 621–632 CrossRef PubMed.
- M. Kawaguchi, R. Ito, N. Okanouchi, K. Saito and H. Nakazawa, J. Chromatogr. B: Anal. Technol. Biomed. Life Sci., 2008, 870, 98–102 CrossRef CAS PubMed.
- J. Wang and W. C. Schnute, Rapid Commun. Mass Spectrom., 2010, 24, 2605–2610 CrossRef CAS PubMed.
- J. Meija and J. a. Caruso, J. Am. Soc. Mass Spectrom., 2004, 15, 654–658 CrossRef CAS PubMed.
- M. Fernández-Fernández, A. González-antuña, P. Rodríguez-gonzález, M. E. Añón, F. V Álvarez and J. I. García Alonso, Clin. Chim. Acta, 2014, 431, 96–102 CrossRef PubMed.
- M. Villar-Navarro, M. Ramos-Payán, R. Fernández-Torres, M. Callejón-Mochón and M. Á. Bello-López, Sci. Total Environ., 2013, 443, 1–6 CrossRef CAS PubMed.
- Guidance document on analytical quality control and validation procedures for pesticide residues analysis in food and feed. Document no. SANCO/12571/2013.
Footnote |
| † Electronic supplementary information (ESI) available. See DOI: 10.1039/c6ay00221h |
| This journal is © The Royal Society of Chemistry 2016 |

